
|
|||||
|
 | |
| |
| |
| |
| |
| |
|
Gene: SOX7 |
Gene summary for SOX7 |
| Gene information | Species | Human | Gene symbol | SOX7 | Gene ID | 83595 |
| Gene name | SRY-box transcription factor 7 | |
| Gene Alias | SOX7 | |
| Cytomap | 8p23.1 | |
| Gene Type | protein-coding | GO ID | GO:0001704 | UniProtAcc | Q9BT81 |
Top |
Malignant transformation analysis |
| Identification of the aberrant gene expression in precancerous and cancerous lesions by comparing the gene expression of stem-like cells in diseased tissues with normal stem cells |
| Entrez ID | Symbol | Replicates | Species | Organ | Tissue | Adj P-value | Log2FC | Malignancy |
| 83595 | SOX7 | P36T-E | Human | Esophagus | ESCC | 3.75e-05 | 8.46e-01 | 0.1187 |
| 83595 | SOX7 | P37T-E | Human | Esophagus | ESCC | 2.70e-14 | -2.74e-01 | 0.1371 |
| 83595 | SOX7 | P39T-E | Human | Esophagus | ESCC | 2.29e-13 | -3.66e-01 | 0.0894 |
| 83595 | SOX7 | P40T-E | Human | Esophagus | ESCC | 4.26e-02 | -9.76e-02 | 0.109 |
| 83595 | SOX7 | P42T-E | Human | Esophagus | ESCC | 1.15e-15 | 8.09e-01 | 0.1175 |
| 83595 | SOX7 | P47T-E | Human | Esophagus | ESCC | 8.69e-07 | 1.87e-01 | 0.1067 |
| 83595 | SOX7 | P48T-E | Human | Esophagus | ESCC | 3.64e-06 | 2.79e-01 | 0.0959 |
| 83595 | SOX7 | P54T-E | Human | Esophagus | ESCC | 4.10e-11 | 7.31e-01 | 0.0975 |
| 83595 | SOX7 | P61T-E | Human | Esophagus | ESCC | 1.20e-03 | 3.67e-01 | 0.099 |
| 83595 | SOX7 | P62T-E | Human | Esophagus | ESCC | 1.11e-07 | 2.17e-01 | 0.1302 |
| 83595 | SOX7 | P65T-E | Human | Esophagus | ESCC | 1.73e-02 | 5.38e-02 | 0.0978 |
| 83595 | SOX7 | P74T-E | Human | Esophagus | ESCC | 1.15e-09 | 9.11e-01 | 0.1479 |
| 83595 | SOX7 | P79T-E | Human | Esophagus | ESCC | 1.93e-03 | 4.36e-01 | 0.1154 |
| 83595 | SOX7 | P80T-E | Human | Esophagus | ESCC | 1.90e-22 | 1.29e+00 | 0.155 |
| 83595 | SOX7 | P83T-E | Human | Esophagus | ESCC | 4.24e-11 | 4.40e-01 | 0.1738 |
| 83595 | SOX7 | P89T-E | Human | Esophagus | ESCC | 1.44e-04 | 1.23e+00 | 0.1752 |
| 83595 | SOX7 | P127T-E | Human | Esophagus | ESCC | 7.56e-03 | -3.30e-01 | 0.0826 |
| 83595 | SOX7 | P130T-E | Human | Esophagus | ESCC | 6.84e-05 | -1.16e-01 | 0.1676 |
| 83595 | SOX7 | HCC1 | Human | Liver | HCC | 4.28e-02 | 1.02e+00 | 0.5336 |
| 83595 | SOX7 | HCC2 | Human | Liver | HCC | 3.11e-04 | 6.15e-01 | 0.5341 |
| Page: 1 2 3 4 |
| Tissue | Expression Dynamics | Abbreviation |
| Esophagus |  | ESCC: Esophageal squamous cell carcinoma |
| HGIN: High-grade intraepithelial neoplasias | ||
| LGIN: Low-grade intraepithelial neoplasias | ||
| Liver | 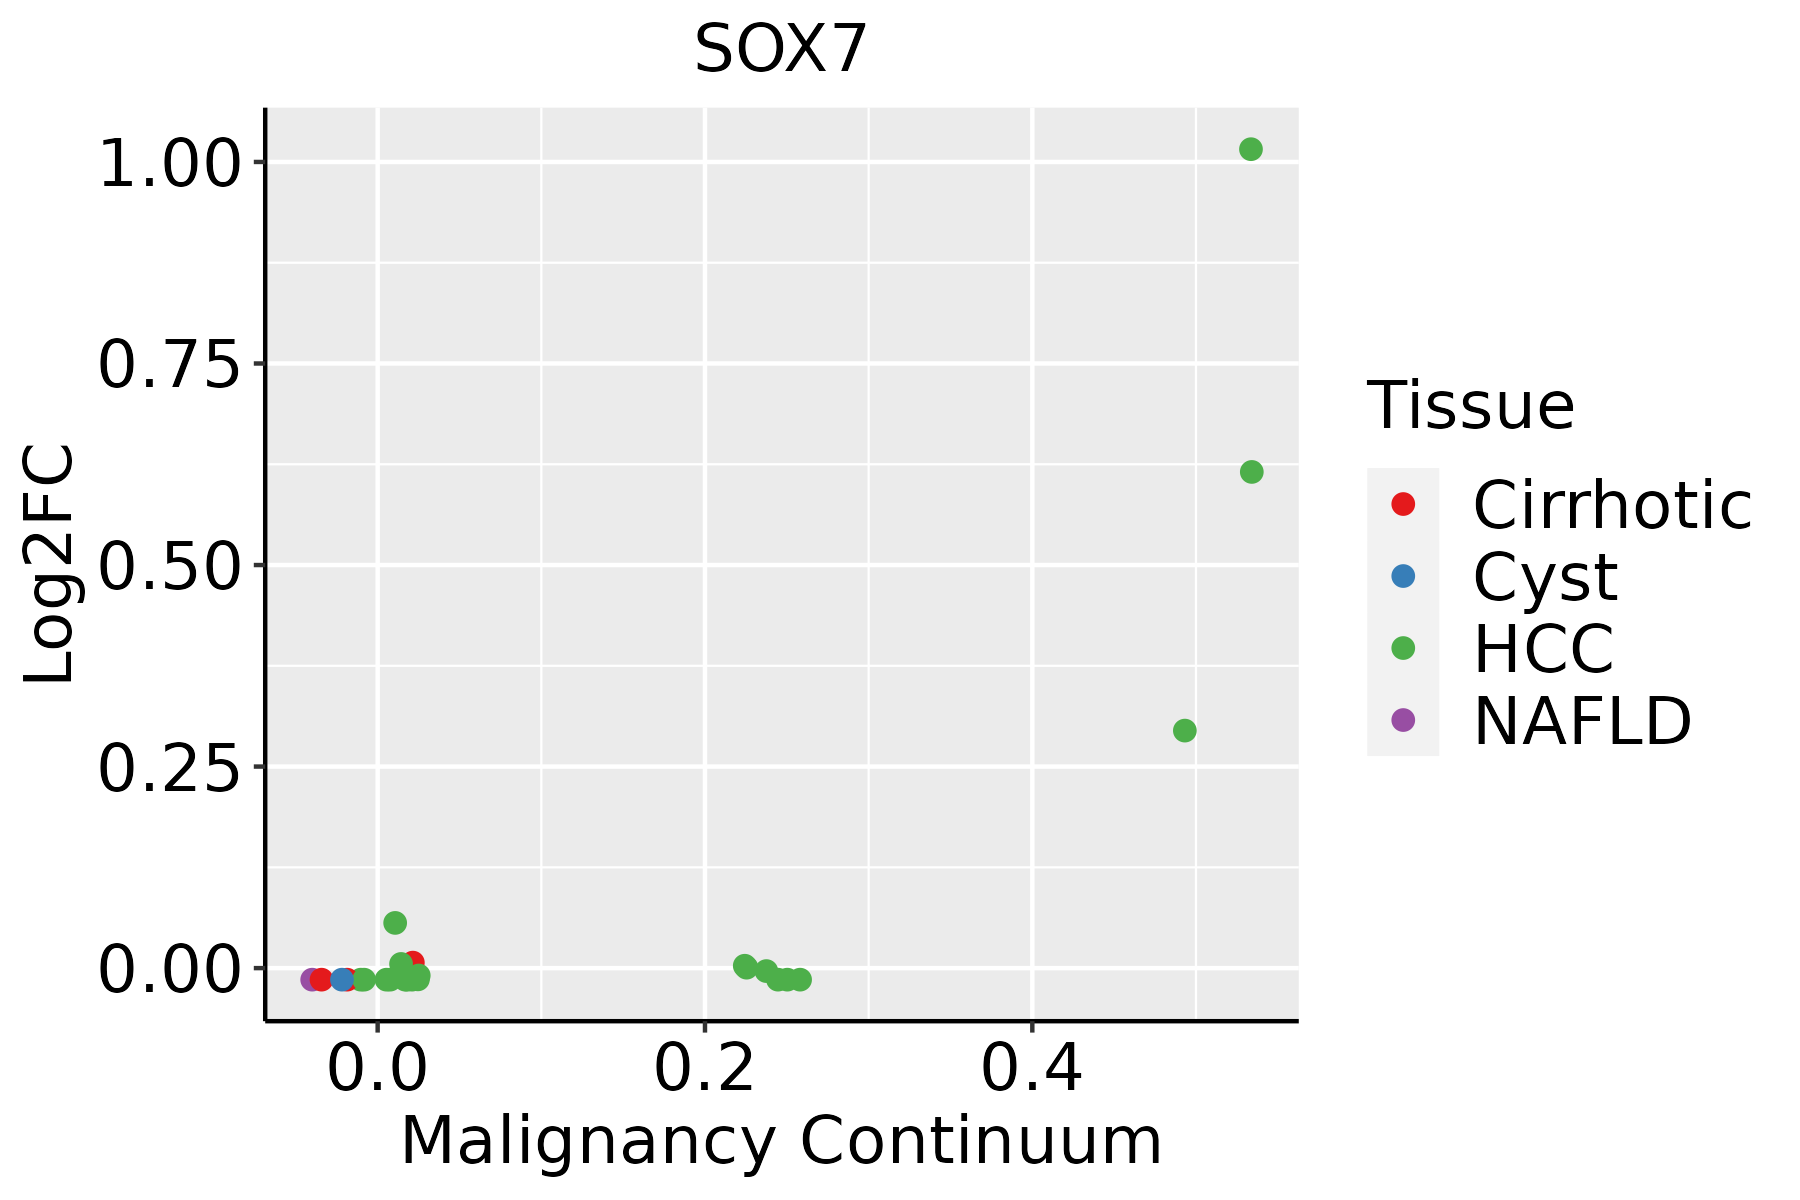 | HCC: Hepatocellular carcinoma |
| NAFLD: Non-alcoholic fatty liver disease | ||
| Oral Cavity | 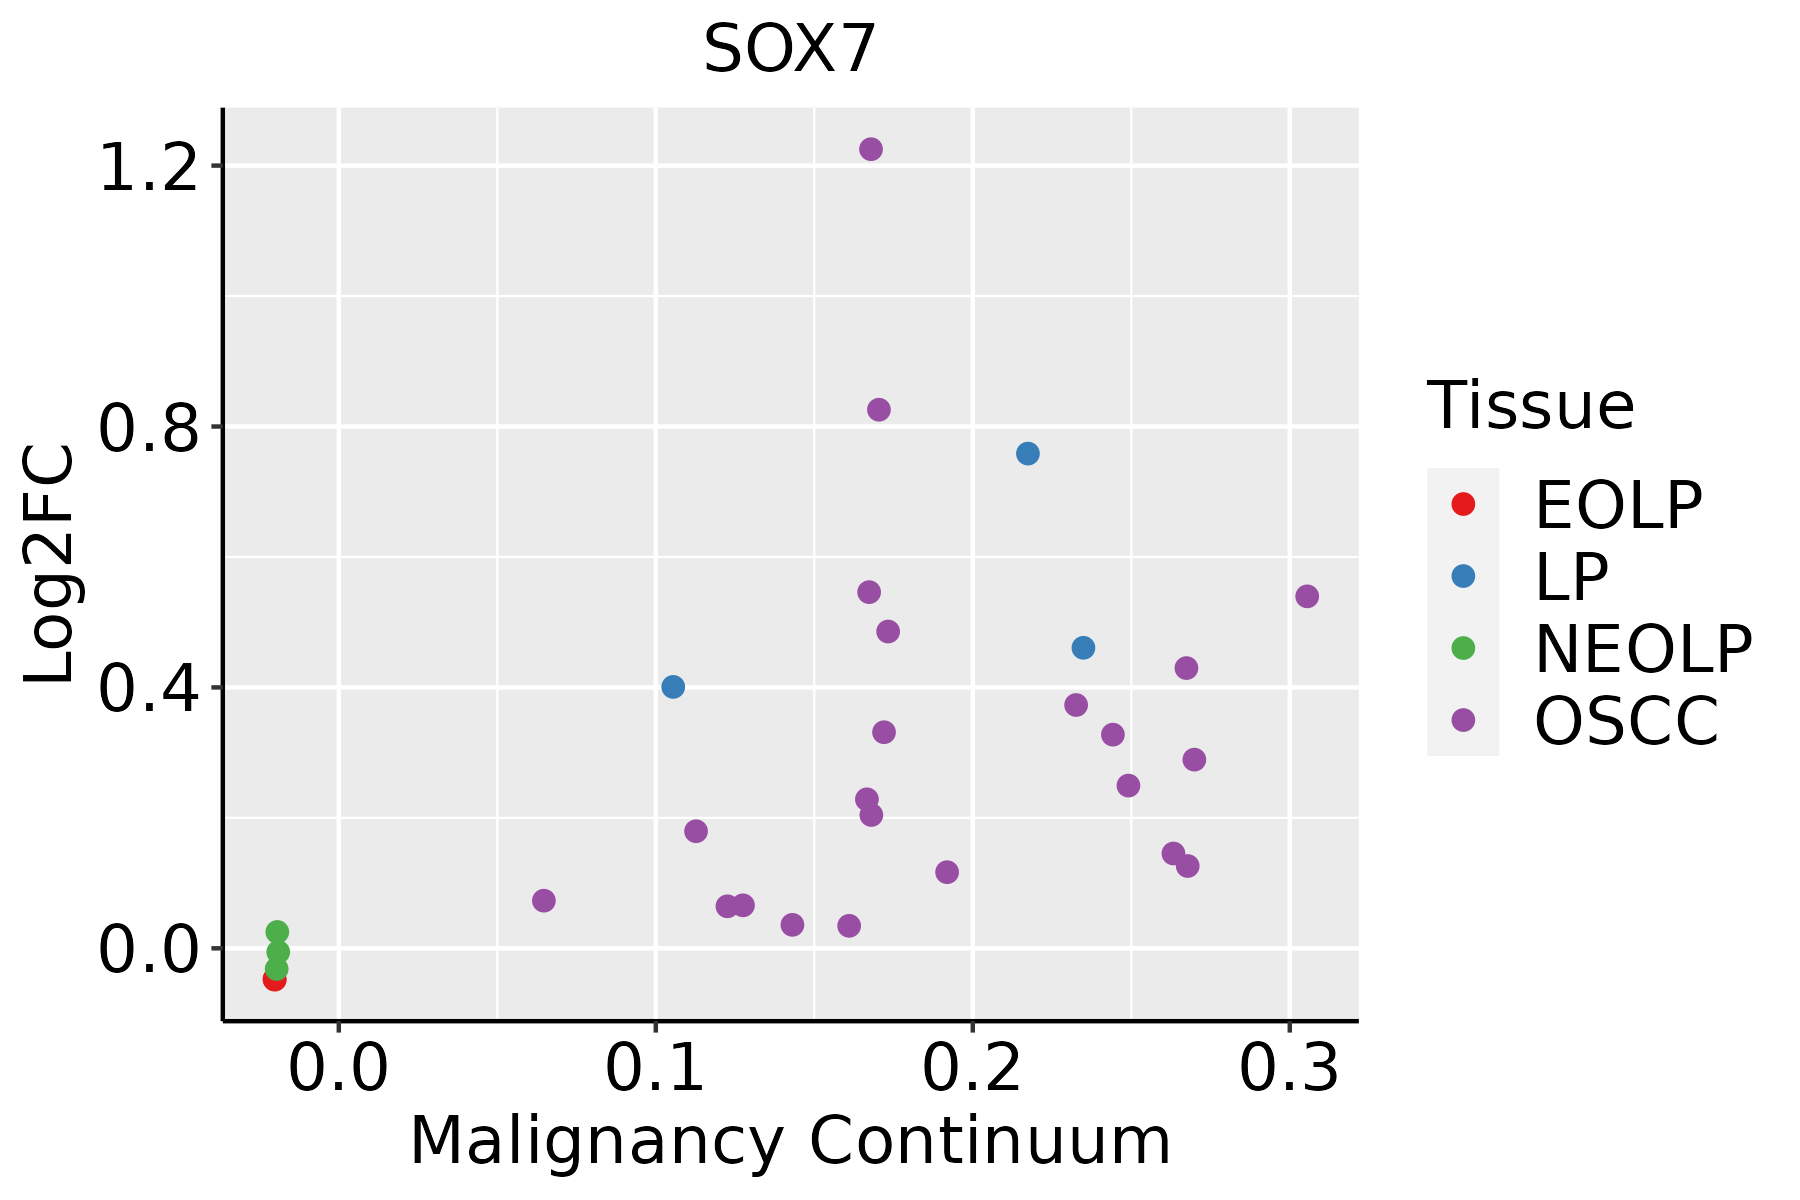 | EOLP: Erosive Oral lichen planus |
| LP: leukoplakia | ||
| NEOLP: Non-erosive oral lichen planus | ||
| OSCC: Oral squamous cell carcinoma | ||
| Prostate | 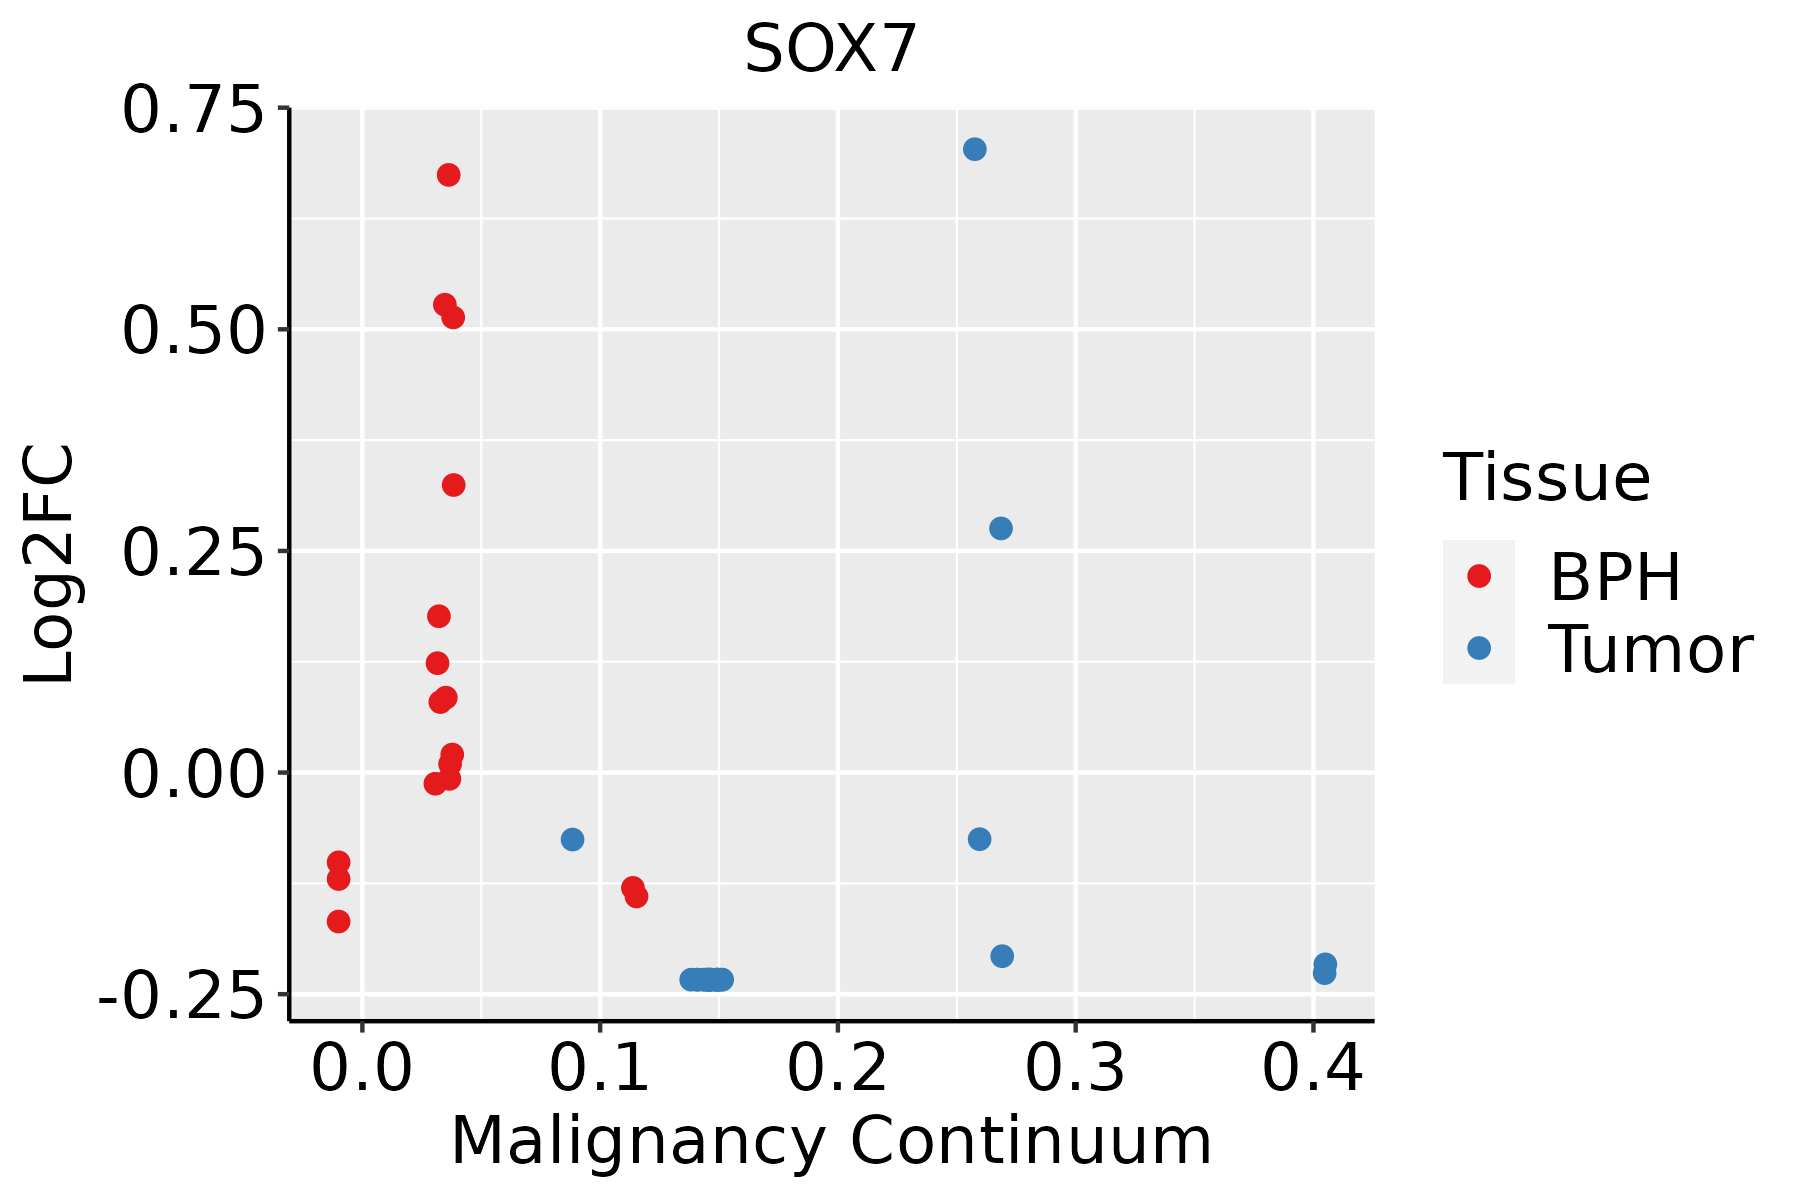 | BPH: Benign Prostatic Hyperplasia |
| Skin | 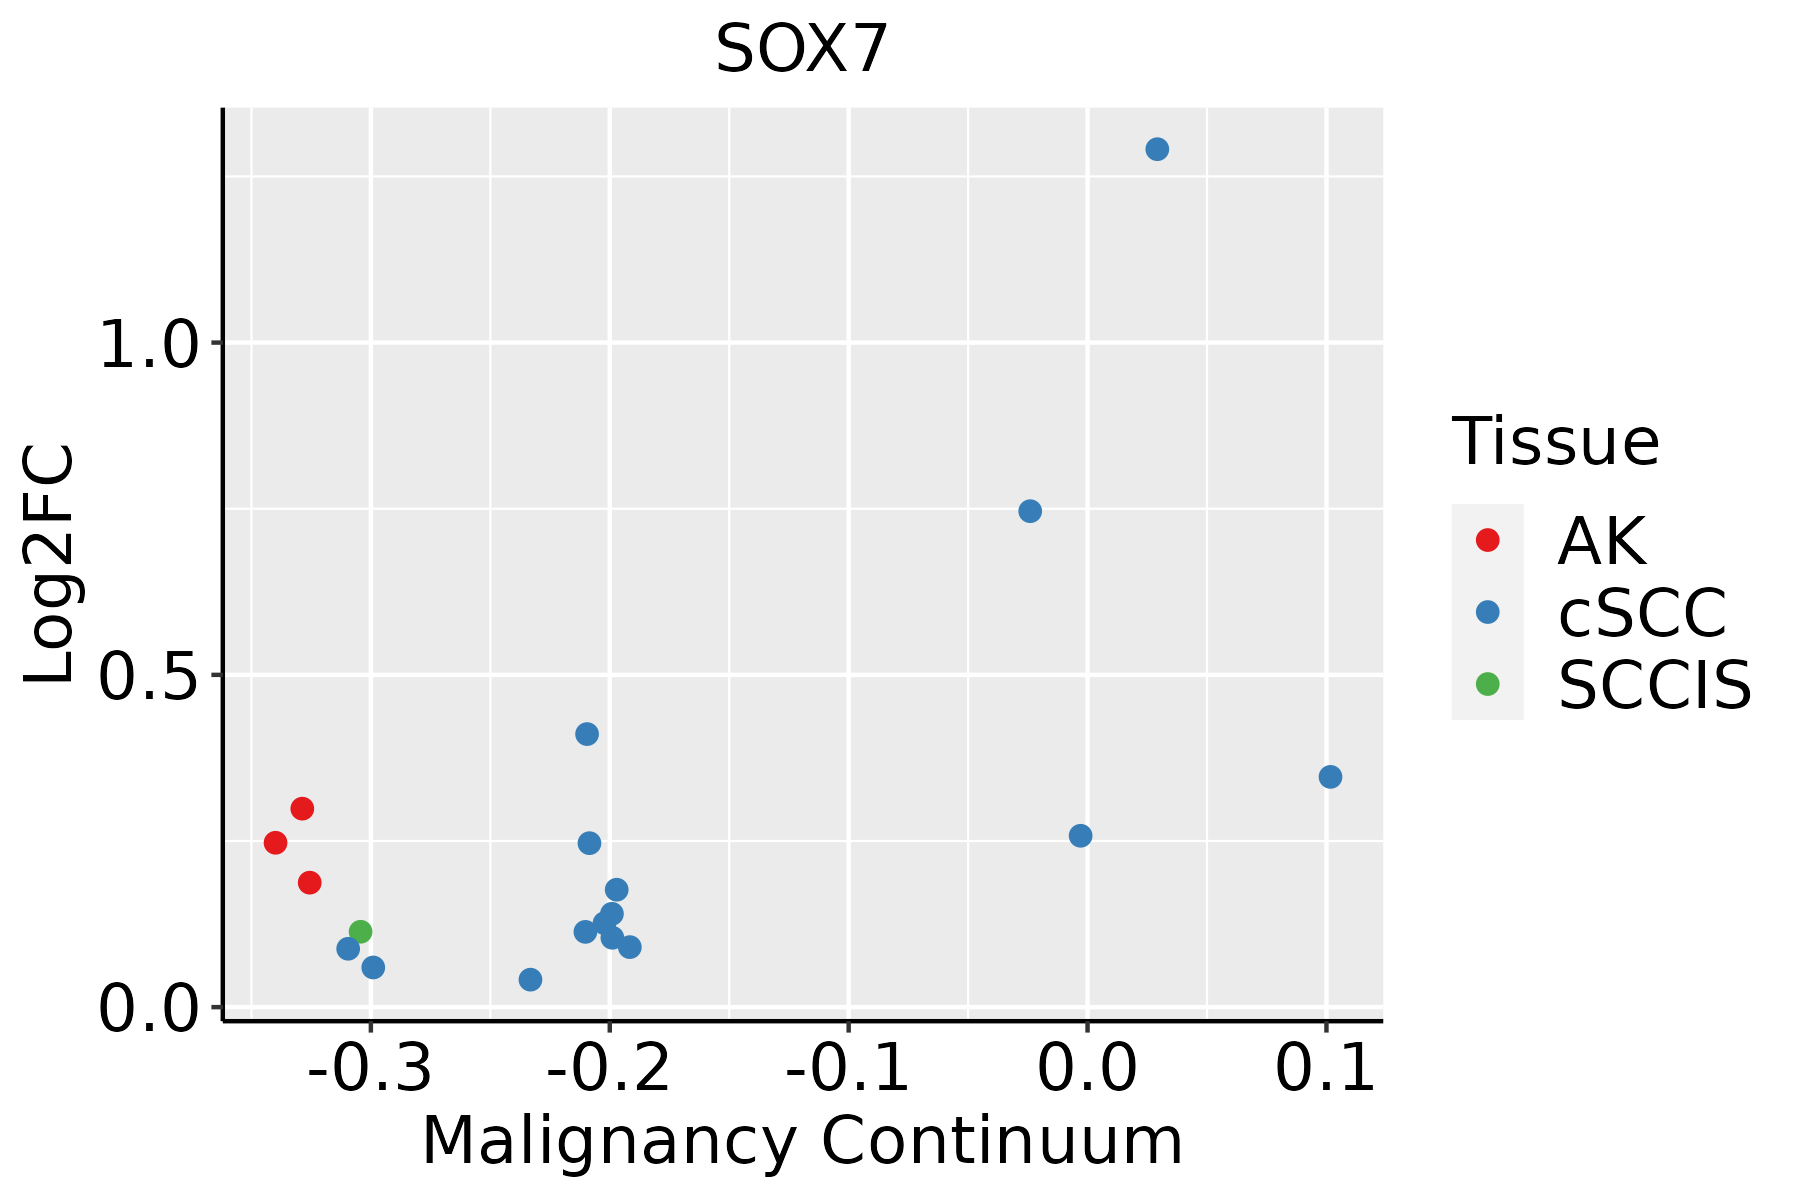 | AK: Actinic keratosis |
| cSCC: Cutaneous squamous cell carcinoma | ||
| SCCIS:squamous cell carcinoma in situ |
| ∗log2FC in expression of this searched gene in stem-like cells from each diseased tissue sample relative to stem-like cells in normal samples in each tissue plotted against the malignancy continuum. Samples are colored based on if they are from different disease stage. |
Top |
Malignant transformation related pathway analysis |
| Find out the enriched GO biological processes and KEGG pathways involved in transition from healthy to precancer to cancer |
| Tissue | Disease Stage | Enriched GO biological Processes |
| Colorectum | AD |  |
| Colorectum | SER |  |
| Colorectum | MSS |  |
| Colorectum | MSI-H |  |
| Colorectum | FAP |  |
| ∗Top 15 enriched GO BP terms are showed in the bar plot of each disease state in each tissue. Each row represents a significant GO biological process which is colored according to the -log10(p.adjust). |
| Page: 1 2 3 4 5 6 7 8 9 |
| GO ID | Tissue | Disease Stage | Description | Gene Ratio | Bg Ratio | pvalue | p.adjust | Count |
| GO:004586227 | Esophagus | HGIN | positive regulation of proteolysis | 107/2587 | 372/18723 | 2.61e-14 | 4.60e-12 | 107 |
| GO:004328126 | Esophagus | HGIN | regulation of cysteine-type endopeptidase activity involved in apoptotic process | 59/2587 | 209/18723 | 3.39e-08 | 1.97e-06 | 59 |
| GO:200011626 | Esophagus | HGIN | regulation of cysteine-type endopeptidase activity | 63/2587 | 235/18723 | 9.71e-08 | 5.02e-06 | 63 |
| GO:005254726 | Esophagus | HGIN | regulation of peptidase activity | 102/2587 | 461/18723 | 6.29e-07 | 2.72e-05 | 102 |
| GO:001095225 | Esophagus | HGIN | positive regulation of peptidase activity | 53/2587 | 197/18723 | 8.70e-07 | 3.59e-05 | 53 |
| GO:005254826 | Esophagus | HGIN | regulation of endopeptidase activity | 96/2587 | 432/18723 | 1.09e-06 | 4.30e-05 | 96 |
| GO:004328020 | Esophagus | HGIN | positive regulation of cysteine-type endopeptidase activity involved in apoptotic process | 38/2587 | 129/18723 | 2.92e-06 | 1.01e-04 | 38 |
| GO:200105620 | Esophagus | HGIN | positive regulation of cysteine-type endopeptidase activity | 41/2587 | 148/18723 | 6.65e-06 | 2.07e-04 | 41 |
| GO:001095020 | Esophagus | HGIN | positive regulation of endopeptidase activity | 47/2587 | 179/18723 | 7.23e-06 | 2.20e-04 | 47 |
| GO:003011116 | Esophagus | HGIN | regulation of Wnt signaling pathway | 65/2587 | 328/18723 | 1.53e-03 | 1.77e-02 | 65 |
| GO:001605516 | Esophagus | HGIN | Wnt signaling pathway | 83/2587 | 444/18723 | 2.27e-03 | 2.33e-02 | 83 |
| GO:019873816 | Esophagus | HGIN | cell-cell signaling by wnt | 83/2587 | 446/18723 | 2.58e-03 | 2.55e-02 | 83 |
| GO:006082816 | Esophagus | HGIN | regulation of canonical Wnt signaling pathway | 50/2587 | 253/18723 | 5.27e-03 | 4.35e-02 | 50 |
| GO:0045862111 | Esophagus | ESCC | positive regulation of proteolysis | 256/8552 | 372/18723 | 7.88e-20 | 9.43e-18 | 256 |
| GO:2000116111 | Esophagus | ESCC | regulation of cysteine-type endopeptidase activity | 158/8552 | 235/18723 | 1.67e-11 | 5.90e-10 | 158 |
| GO:0043281111 | Esophagus | ESCC | regulation of cysteine-type endopeptidase activity involved in apoptotic process | 143/8552 | 209/18723 | 2.12e-11 | 7.31e-10 | 143 |
| GO:001605517 | Esophagus | ESCC | Wnt signaling pathway | 268/8552 | 444/18723 | 2.32e-10 | 6.58e-09 | 268 |
| GO:019873817 | Esophagus | ESCC | cell-cell signaling by wnt | 269/8552 | 446/18723 | 2.41e-10 | 6.79e-09 | 269 |
| GO:0010952111 | Esophagus | ESCC | positive regulation of peptidase activity | 133/8552 | 197/18723 | 4.31e-10 | 1.14e-08 | 133 |
| GO:0052547111 | Esophagus | ESCC | regulation of peptidase activity | 275/8552 | 461/18723 | 7.54e-10 | 1.88e-08 | 275 |
| Page: 1 2 3 4 5 6 7 8 |
| Pathway ID | Tissue | Disease Stage | Description | Gene Ratio | Bg Ratio | pvalue | p.adjust | qvalue | Count |
| Page: 1 |
Top |
Cell-cell communication analysis |
| Identification of potential cell-cell interactions between two cell types and their ligand-receptor pairs for different disease states |
| Ligand | Receptor | LRpair | Pathway | Tissue | Disease Stage |
| Page: 1 |
Top |
Single-cell gene regulatory network inference analysis |
| Find out the significant the regulons (TFs) and the target genes of each regulon across cell types for different disease states |
| TF | Cell Type | Tissue | Disease Stage | Target Gene | RSS | Regulon Activity |
| SOX7 | MSC.ADIPO | Breast | Healthy | AKAP12,EMP1,INHBB, etc. | 2.04e-01 |  |
| SOX7 | MSC.ADIPO | Breast | Precancer | AKAP12,EMP1,INHBB, etc. | 1.35e-01 |  |
| SOX7 | END | Cervix | ADJ | SOX17,CD93,IFI27, etc. | 4.36e-01 |  |
| SOX7 | END | Cervix | CC | SOX17,CD93,IFI27, etc. | 4.71e-01 |  |
| SOX7 | BAS | Lung | Healthy | CRIP2,SPARCL1,CMTM6, etc. | 1.26e-01 |  |
| SOX7 | MVA | Lung | AAH | CD93,TNFSF10,RAMP2, etc. | 3.63e-01 |  |
| SOX7 | PVA | Lung | AAH | CD93,TNFSF10,RAMP2, etc. | 2.52e-01 | |
| SOX7 | MVA | Lung | ADJ | CD93,TNFSF10,RAMP2, etc. | 1.88e-01 |  |
| SOX7 | INCAF | Lung | ADJ | CD93,TNFSF10,RAMP2, etc. | 9.62e-02 | |
| SOX7 | MVA | Lung | AIS | CD93,TNFSF10,RAMP2, etc. | 4.53e-01 |  |
| ∗The dot plots of a searched regulon are shown for all cell subpopulations in each disease state of each tissue based on the regulon specific score inferred using pySCENIC and by calculating the average expression. |
| Page: 1 2 3 4 |
Top |
Somatic mutation of malignant transformation related genes |
| Annotation of somatic variants for genes involved in malignant transformation |
| Hugo Symbol | Variant Class | Variant Classification | dbSNP RS | HGVSc | HGVSp | HGVSp Short | SWISSPROT | BIOTYPE | SIFT | PolyPhen | Tumor Sample Barcode | Tissue | Histology | Sex | Age | Stage | Therapy Types | Drugs | Outcome |
| SOX7 | SNV | Missense_Mutation | c.940G>A | p.Ala314Thr | p.A314T | Q9BT81 | protein_coding | tolerated(1) | benign(0.006) | TCGA-AN-A0AK-01 | Breast | breast invasive carcinoma | Female | >=65 | I/II | Unknown | Unknown | SD | |
| SOX7 | SNV | Missense_Mutation | novel | c.315N>A | p.His105Gln | p.H105Q | Q9BT81 | protein_coding | deleterious(0) | probably_damaging(1) | TCGA-B6-A0IJ-01 | Breast | breast invasive carcinoma | Female | <65 | I/II | Unknown | Unknown | SD |
| SOX7 | SNV | Missense_Mutation | c.813N>T | p.Met271Ile | p.M271I | Q9BT81 | protein_coding | tolerated(0.82) | benign(0) | TCGA-DG-A2KK-01 | Cervix | cervical & endocervical cancer | Female | <65 | III/IV | Chemotherapy | cisplatin | SD | |
| SOX7 | SNV | Missense_Mutation | novel | c.295N>A | p.Glu99Lys | p.E99K | Q9BT81 | protein_coding | deleterious(0) | probably_damaging(0.999) | TCGA-Q1-A5R2-01 | Cervix | cervical & endocervical cancer | Female | <65 | I/II | Chemotherapy | cisplatin | PR |
| SOX7 | SNV | Missense_Mutation | novel | c.793N>C | p.Ser265Pro | p.S265P | Q9BT81 | protein_coding | tolerated(0.25) | benign(0.009) | TCGA-AA-3984-01 | Colorectum | colon adenocarcinoma | Female | <65 | I/II | Unknown | Unknown | SD |
| SOX7 | SNV | Missense_Mutation | c.293C>T | p.Ala98Val | p.A98V | Q9BT81 | protein_coding | deleterious(0) | probably_damaging(1) | TCGA-AA-A010-01 | Colorectum | colon adenocarcinoma | Female | <65 | I/II | Chemotherapy | folinic | CR | |
| SOX7 | SNV | Missense_Mutation | c.724N>C | p.Tyr242His | p.Y242H | Q9BT81 | protein_coding | tolerated(0.13) | benign(0.029) | TCGA-AZ-4315-01 | Colorectum | colon adenocarcinoma | Male | <65 | I/II | Unknown | Unknown | SD | |
| SOX7 | SNV | Missense_Mutation | rs142748053 | c.457N>T | p.Arg153Trp | p.R153W | Q9BT81 | protein_coding | deleterious(0.02) | possibly_damaging(0.462) | TCGA-D5-6926-01 | Colorectum | colon adenocarcinoma | Male | >=65 | III/IV | Chemotherapy | 5-fluorouracil | SD |
| SOX7 | SNV | Missense_Mutation | rs767524561 | c.395N>A | p.Gly132Asp | p.G132D | Q9BT81 | protein_coding | deleterious(0) | probably_damaging(0.984) | TCGA-DM-A1D7-01 | Colorectum | colon adenocarcinoma | Male | >=65 | I/II | Unknown | Unknown | PD |
| SOX7 | SNV | Missense_Mutation | rs746671600 | c.961G>A | p.Val321Met | p.V321M | Q9BT81 | protein_coding | deleterious(0.01) | possibly_damaging(0.852) | TCGA-G4-6320-01 | Colorectum | colon adenocarcinoma | Male | >=65 | III/IV | Chemotherapy | oxaliplatin | SD |
| Page: 1 2 3 4 5 6 7 8 |
Top |
Related drugs of malignant transformation related genes |
| Identification of chemicals and drugs interact with genes involved in malignant transfromation |
| (DGIdb 4.0) |
| Entrez ID | Symbol | Category | Interaction Types | Drug Claim Name | Drug Name | PMIDs |
| Page: 1 |

Copyright 2023-Present -The University of Texas Health Science Center at Houston |