
|
|||||
|
 | |
| |
| |
| |
| |
| |
|
Gene: SOCS6 |
Gene summary for SOCS6 |
| Gene information | Species | Human | Gene symbol | SOCS6 | Gene ID | 9306 |
| Gene name | suppressor of cytokine signaling 6 | |
| Gene Alias | CIS-4 | |
| Cytomap | 18q22.2 | |
| Gene Type | protein-coding | GO ID | GO:0001775 | UniProtAcc | A0A024R379 |
Top |
Malignant transformation analysis |
| Identification of the aberrant gene expression in precancerous and cancerous lesions by comparing the gene expression of stem-like cells in diseased tissues with normal stem cells |
| Entrez ID | Symbol | Replicates | Species | Organ | Tissue | Adj P-value | Log2FC | Malignancy |
| 9306 | SOCS6 | P26T-E | Human | Esophagus | ESCC | 4.29e-18 | 2.09e-01 | 0.1276 |
| 9306 | SOCS6 | P27T-E | Human | Esophagus | ESCC | 5.54e-06 | 8.52e-02 | 0.1055 |
| 9306 | SOCS6 | P28T-E | Human | Esophagus | ESCC | 2.79e-13 | 3.13e-01 | 0.1149 |
| 9306 | SOCS6 | P30T-E | Human | Esophagus | ESCC | 5.09e-05 | 3.96e-01 | 0.137 |
| 9306 | SOCS6 | P31T-E | Human | Esophagus | ESCC | 3.97e-16 | 1.74e-01 | 0.1251 |
| 9306 | SOCS6 | P32T-E | Human | Esophagus | ESCC | 2.25e-12 | 6.66e-02 | 0.1666 |
| 9306 | SOCS6 | P36T-E | Human | Esophagus | ESCC | 2.62e-14 | 3.31e-01 | 0.1187 |
| 9306 | SOCS6 | P37T-E | Human | Esophagus | ESCC | 1.37e-19 | 9.24e-02 | 0.1371 |
| 9306 | SOCS6 | P38T-E | Human | Esophagus | ESCC | 4.25e-02 | -9.09e-02 | 0.127 |
| 9306 | SOCS6 | P39T-E | Human | Esophagus | ESCC | 1.82e-12 | 4.16e-01 | 0.0894 |
| 9306 | SOCS6 | P40T-E | Human | Esophagus | ESCC | 1.52e-08 | -2.14e-02 | 0.109 |
| 9306 | SOCS6 | P42T-E | Human | Esophagus | ESCC | 2.52e-03 | 6.11e-02 | 0.1175 |
| 9306 | SOCS6 | P44T-E | Human | Esophagus | ESCC | 3.59e-07 | 6.69e-02 | 0.1096 |
| 9306 | SOCS6 | P47T-E | Human | Esophagus | ESCC | 5.37e-16 | 9.51e-02 | 0.1067 |
| 9306 | SOCS6 | P48T-E | Human | Esophagus | ESCC | 1.98e-09 | 5.46e-02 | 0.0959 |
| 9306 | SOCS6 | P49T-E | Human | Esophagus | ESCC | 4.14e-05 | 2.90e-01 | 0.1768 |
| 9306 | SOCS6 | P52T-E | Human | Esophagus | ESCC | 1.21e-03 | 1.01e-01 | 0.1555 |
| 9306 | SOCS6 | P54T-E | Human | Esophagus | ESCC | 3.83e-11 | 4.24e-01 | 0.0975 |
| 9306 | SOCS6 | P57T-E | Human | Esophagus | ESCC | 1.23e-16 | 1.11e-01 | 0.0926 |
| 9306 | SOCS6 | P61T-E | Human | Esophagus | ESCC | 1.01e-11 | 2.71e-02 | 0.099 |
| Page: 1 2 3 |
| Tissue | Expression Dynamics | Abbreviation |
| Esophagus |  | ESCC: Esophageal squamous cell carcinoma |
| HGIN: High-grade intraepithelial neoplasias | ||
| LGIN: Low-grade intraepithelial neoplasias | ||
| Oral Cavity | 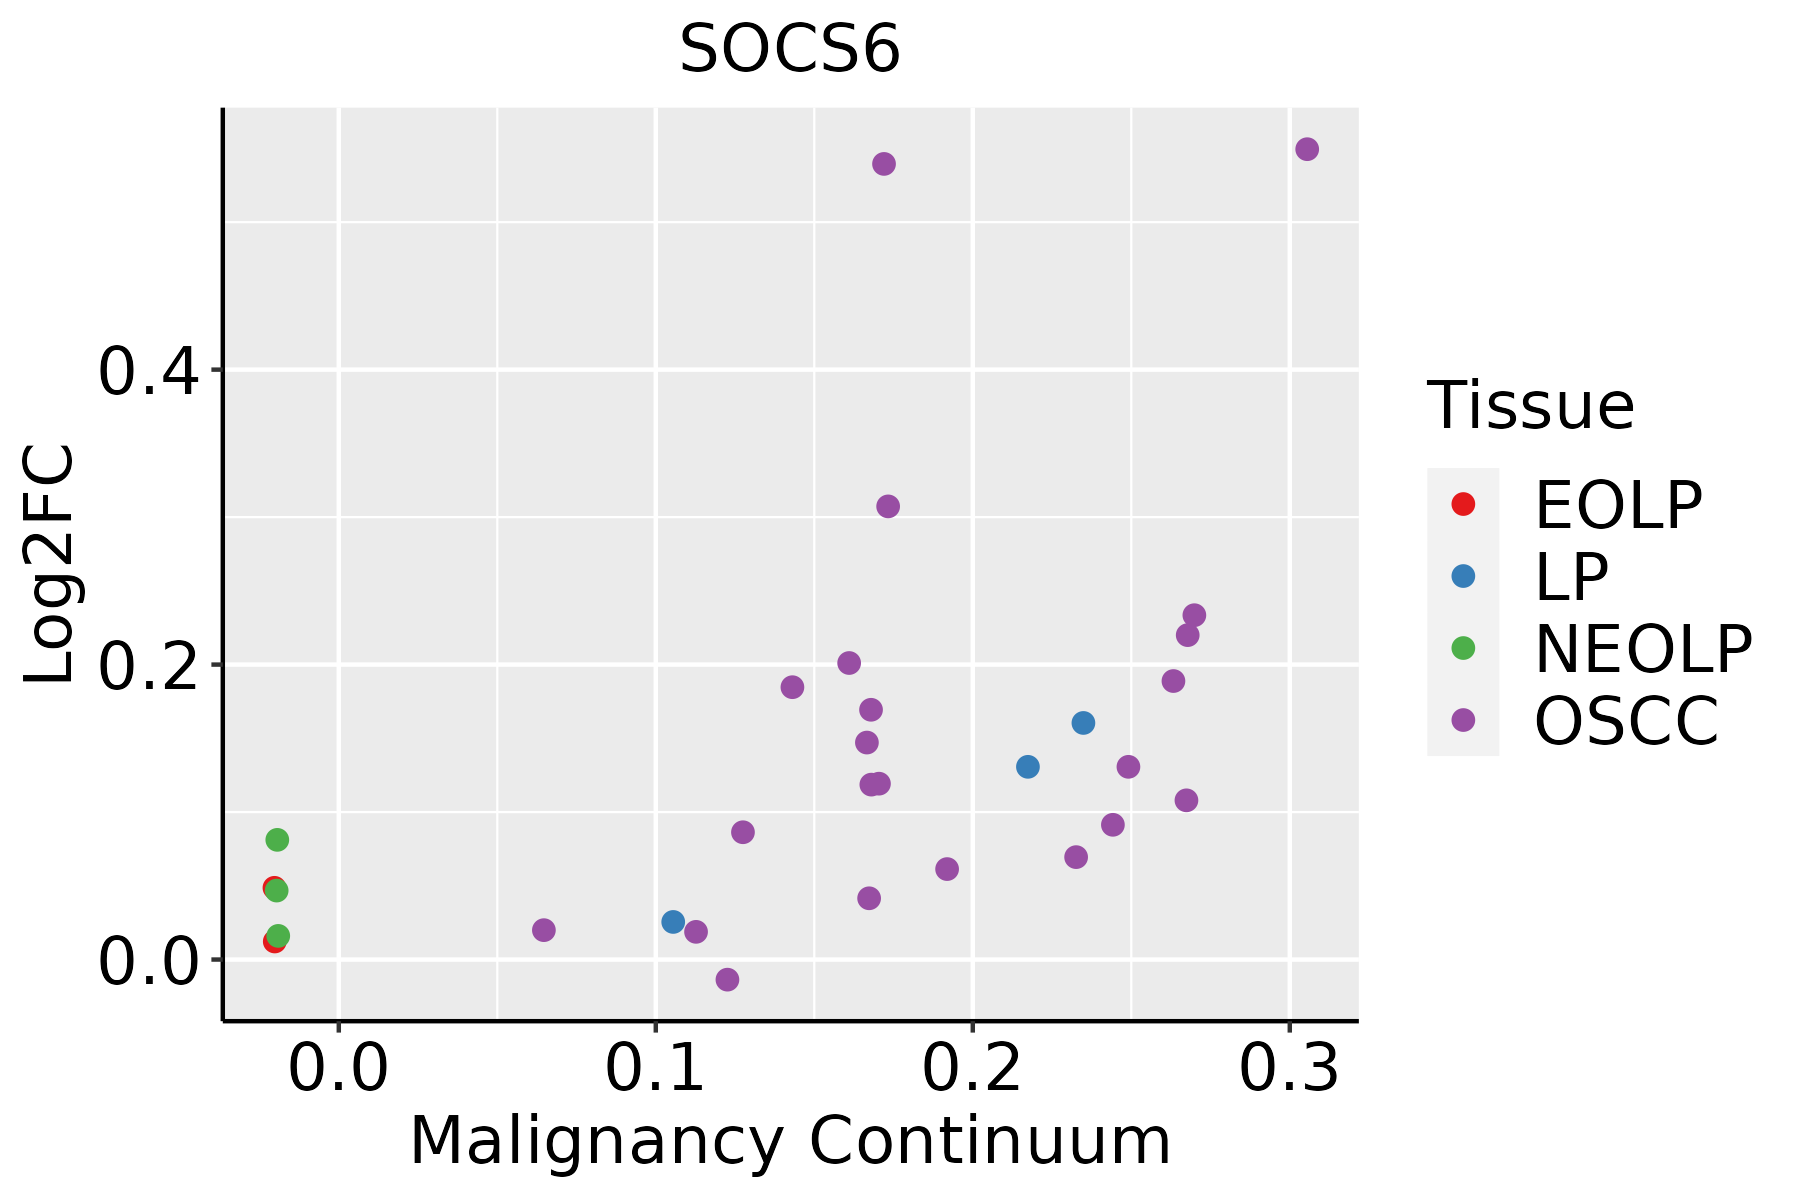 | EOLP: Erosive Oral lichen planus |
| LP: leukoplakia | ||
| NEOLP: Non-erosive oral lichen planus | ||
| OSCC: Oral squamous cell carcinoma |
| ∗log2FC in expression of this searched gene in stem-like cells from each diseased tissue sample relative to stem-like cells in normal samples in each tissue plotted against the malignancy continuum. Samples are colored based on if they are from different disease stage. |
Top |
Malignant transformation related pathway analysis |
| Find out the enriched GO biological processes and KEGG pathways involved in transition from healthy to precancer to cancer |
| Tissue | Disease Stage | Enriched GO biological Processes |
| Colorectum | AD |  |
| Colorectum | SER |  |
| Colorectum | MSS |  |
| Colorectum | MSI-H |  |
| Colorectum | FAP |  |
| ∗Top 15 enriched GO BP terms are showed in the bar plot of each disease state in each tissue. Each row represents a significant GO biological process which is colored according to the -log10(p.adjust). |
| Page: 1 2 3 4 5 6 7 8 9 |
| GO ID | Tissue | Disease Stage | Description | Gene Ratio | Bg Ratio | pvalue | p.adjust | Count |
| GO:0010498111 | Esophagus | ESCC | proteasomal protein catabolic process | 369/8552 | 490/18723 | 1.13e-41 | 1.80e-38 | 369 |
| GO:00086544 | Esophagus | ESCC | phospholipid biosynthetic process | 162/8552 | 253/18723 | 2.59e-09 | 5.73e-08 | 162 |
| GO:00464744 | Esophagus | ESCC | glycerophospholipid biosynthetic process | 135/8552 | 211/18723 | 5.75e-08 | 1.02e-06 | 135 |
| GO:00450175 | Esophagus | ESCC | glycerolipid biosynthetic process | 154/8552 | 252/18723 | 5.20e-07 | 6.96e-06 | 154 |
| GO:00066446 | Esophagus | ESCC | phospholipid metabolic process | 218/8552 | 383/18723 | 5.37e-06 | 5.59e-05 | 218 |
| GO:00066505 | Esophagus | ESCC | glycerophospholipid metabolic process | 174/8552 | 306/18723 | 4.92e-05 | 3.85e-04 | 174 |
| GO:002240720 | Esophagus | ESCC | regulation of cell-cell adhesion | 239/8552 | 448/18723 | 5.88e-04 | 3.19e-03 | 239 |
| GO:00464864 | Esophagus | ESCC | glycerolipid metabolic process | 211/8552 | 392/18723 | 6.51e-04 | 3.46e-03 | 211 |
| GO:000268316 | Esophagus | ESCC | negative regulation of immune system process | 231/8552 | 434/18723 | 8.48e-04 | 4.36e-03 | 231 |
| GO:004211018 | Esophagus | ESCC | T cell activation | 256/8552 | 487/18723 | 1.18e-03 | 5.87e-03 | 256 |
| GO:000715918 | Esophagus | ESCC | leukocyte cell-cell adhesion | 192/8552 | 371/18723 | 1.03e-02 | 3.51e-02 | 192 |
| GO:00066611 | Esophagus | ESCC | phosphatidylinositol biosynthetic process | 73/8552 | 131/18723 | 1.31e-02 | 4.28e-02 | 73 |
| GO:190303717 | Esophagus | ESCC | regulation of leukocyte cell-cell adhesion | 174/8552 | 336/18723 | 1.36e-02 | 4.43e-02 | 174 |
| GO:001049820 | Oral cavity | OSCC | proteasomal protein catabolic process | 336/7305 | 490/18723 | 5.45e-41 | 8.63e-38 | 336 |
| GO:004211016 | Oral cavity | OSCC | T cell activation | 245/7305 | 487/18723 | 2.00e-07 | 3.22e-06 | 245 |
| GO:002240718 | Oral cavity | OSCC | regulation of cell-cell adhesion | 218/7305 | 448/18723 | 1.71e-05 | 1.68e-04 | 218 |
| GO:00086543 | Oral cavity | OSCC | phospholipid biosynthetic process | 130/7305 | 253/18723 | 3.96e-05 | 3.46e-04 | 130 |
| GO:005086315 | Oral cavity | OSCC | regulation of T cell activation | 161/7305 | 329/18723 | 1.44e-04 | 1.02e-03 | 161 |
| GO:000715916 | Oral cavity | OSCC | leukocyte cell-cell adhesion | 178/7305 | 371/18723 | 2.44e-04 | 1.57e-03 | 178 |
| GO:190303715 | Oral cavity | OSCC | regulation of leukocyte cell-cell adhesion | 162/7305 | 336/18723 | 3.39e-04 | 2.08e-03 | 162 |
| Page: 1 2 |
| Pathway ID | Tissue | Disease Stage | Description | Gene Ratio | Bg Ratio | pvalue | p.adjust | qvalue | Count |
| Page: 1 |
Top |
Cell-cell communication analysis |
| Identification of potential cell-cell interactions between two cell types and their ligand-receptor pairs for different disease states |
| Ligand | Receptor | LRpair | Pathway | Tissue | Disease Stage |
| Page: 1 |
Top |
Single-cell gene regulatory network inference analysis |
| Find out the significant the regulons (TFs) and the target genes of each regulon across cell types for different disease states |
| TF | Cell Type | Tissue | Disease Stage | Target Gene | RSS | Regulon Activity |
| ∗The dot plots of a searched regulon are shown for all cell subpopulations in each disease state of each tissue based on the regulon specific score inferred using pySCENIC and by calculating the average expression. |
| Page: 1 |
Top |
Somatic mutation of malignant transformation related genes |
| Annotation of somatic variants for genes involved in malignant transformation |
| Hugo Symbol | Variant Class | Variant Classification | dbSNP RS | HGVSc | HGVSp | HGVSp Short | SWISSPROT | BIOTYPE | SIFT | PolyPhen | Tumor Sample Barcode | Tissue | Histology | Sex | Age | Stage | Therapy Types | Drugs | Outcome |
| SOCS6 | SNV | Missense_Mutation | c.1214N>T | p.Ser405Phe | p.S405F | O14544 | protein_coding | deleterious(0) | probably_damaging(0.988) | TCGA-A7-A2KD-01 | Breast | breast invasive carcinoma | Female | <65 | III/IV | Chemotherapy | cytoxan | SD | |
| SOCS6 | SNV | Missense_Mutation | novel | c.1358N>T | p.Ser453Phe | p.S453F | O14544 | protein_coding | deleterious(0) | probably_damaging(0.999) | TCGA-A7-A2KD-01 | Breast | breast invasive carcinoma | Female | <65 | III/IV | Chemotherapy | cytoxan | SD |
| SOCS6 | SNV | Missense_Mutation | novel | c.115N>T | p.Asp39Tyr | p.D39Y | O14544 | protein_coding | deleterious_low_confidence(0) | possibly_damaging(0.621) | TCGA-AN-A046-01 | Breast | breast invasive carcinoma | Female | >=65 | I/II | Unknown | Unknown | SD |
| SOCS6 | SNV | Missense_Mutation | rs762157657 | c.826N>A | p.Ala276Thr | p.A276T | O14544 | protein_coding | tolerated_low_confidence(0.36) | benign(0.041) | TCGA-AO-A128-01 | Breast | breast invasive carcinoma | Female | <65 | I/II | Chemotherapy | doxorubicin | SD |
| SOCS6 | SNV | Missense_Mutation | rs750346315 | c.778N>T | p.Arg260Cys | p.R260C | O14544 | protein_coding | tolerated_low_confidence(0.14) | benign(0.083) | TCGA-BH-A0BT-01 | Breast | breast invasive carcinoma | Female | <65 | I/II | Chemotherapy | adriamycin | CR |
| SOCS6 | SNV | Missense_Mutation | c.224N>T | p.Gly75Val | p.G75V | O14544 | protein_coding | deleterious(0) | probably_damaging(0.999) | TCGA-BH-A18F-01 | Breast | breast invasive carcinoma | Female | <65 | I/II | Chemotherapy | taxotere | CR | |
| SOCS6 | SNV | Missense_Mutation | c.1061N>A | p.Val354Asp | p.V354D | O14544 | protein_coding | deleterious(0.01) | possibly_damaging(0.621) | TCGA-BH-A18Q-01 | Breast | breast invasive carcinoma | Female | <65 | I/II | Unknown | Unknown | SD | |
| SOCS6 | SNV | Missense_Mutation | c.1493N>A | p.Arg498His | p.R498H | O14544 | protein_coding | deleterious(0.02) | benign(0.035) | TCGA-MU-A5YI-01 | Cervix | cervical & endocervical cancer | Female | <65 | I/II | Unknown | Unknown | PD | |
| SOCS6 | SNV | Missense_Mutation | c.916N>A | p.Asp306Asn | p.D306N | O14544 | protein_coding | tolerated(0.08) | benign(0.255) | TCGA-VS-A9U7-01 | Cervix | cervical & endocervical cancer | Female | <65 | I/II | Chemotherapy | cisplatin | CR | |
| SOCS6 | SNV | Missense_Mutation | c.1304N>G | p.His435Arg | p.H435R | O14544 | protein_coding | deleterious(0) | possibly_damaging(0.88) | TCGA-A6-6653-01 | Colorectum | colon adenocarcinoma | Male | >=65 | I/II | Unknown | Unknown | SD |
| Page: 1 2 3 4 5 6 7 |
Top |
Related drugs of malignant transformation related genes |
| Identification of chemicals and drugs interact with genes involved in malignant transfromation |
| (DGIdb 4.0) |
| Entrez ID | Symbol | Category | Interaction Types | Drug Claim Name | Drug Name | PMIDs |
| 9306 | SOCS6 | NA | INSULIN | INSULIN | 18356406 |
| Page: 1 |

Copyright 2023-Present -The University of Texas Health Science Center at Houston |