
|
|||||
|
 | |
| |
| |
| |
| |
| |
|
Gene: SNX24 |
Gene summary for SNX24 |
| Gene information | Species | Human | Gene symbol | SNX24 | Gene ID | 28966 |
| Gene name | sorting nexin 24 | |
| Gene Alias | PRO1284 | |
| Cytomap | 5q23.2 | |
| Gene Type | protein-coding | GO ID | GO:0006810 | UniProtAcc | Q9Y343 |
Top |
Malignant transformation analysis |
| Identification of the aberrant gene expression in precancerous and cancerous lesions by comparing the gene expression of stem-like cells in diseased tissues with normal stem cells |
| Entrez ID | Symbol | Replicates | Species | Organ | Tissue | Adj P-value | Log2FC | Malignancy |
| 28966 | SNX24 | P32T-E | Human | Esophagus | ESCC | 1.37e-08 | 1.59e-01 | 0.1666 |
| 28966 | SNX24 | P37T-E | Human | Esophagus | ESCC | 1.00e-02 | 1.17e-01 | 0.1371 |
| 28966 | SNX24 | P39T-E | Human | Esophagus | ESCC | 8.66e-06 | 1.02e-01 | 0.0894 |
| 28966 | SNX24 | P42T-E | Human | Esophagus | ESCC | 2.87e-03 | 1.21e-01 | 0.1175 |
| 28966 | SNX24 | P44T-E | Human | Esophagus | ESCC | 3.67e-02 | 9.95e-02 | 0.1096 |
| 28966 | SNX24 | P47T-E | Human | Esophagus | ESCC | 1.93e-05 | 8.33e-02 | 0.1067 |
| 28966 | SNX24 | P48T-E | Human | Esophagus | ESCC | 2.35e-07 | 1.23e-01 | 0.0959 |
| 28966 | SNX24 | P49T-E | Human | Esophagus | ESCC | 3.90e-04 | 4.15e-01 | 0.1768 |
| 28966 | SNX24 | P52T-E | Human | Esophagus | ESCC | 6.52e-11 | 2.54e-01 | 0.1555 |
| 28966 | SNX24 | P54T-E | Human | Esophagus | ESCC | 7.27e-08 | 1.76e-01 | 0.0975 |
| 28966 | SNX24 | P57T-E | Human | Esophagus | ESCC | 3.71e-06 | 5.98e-02 | 0.0926 |
| 28966 | SNX24 | P61T-E | Human | Esophagus | ESCC | 5.58e-06 | 1.64e-01 | 0.099 |
| 28966 | SNX24 | P62T-E | Human | Esophagus | ESCC | 1.19e-18 | 3.00e-01 | 0.1302 |
| 28966 | SNX24 | P65T-E | Human | Esophagus | ESCC | 8.27e-06 | 1.17e-01 | 0.0978 |
| 28966 | SNX24 | P74T-E | Human | Esophagus | ESCC | 3.77e-11 | 3.01e-01 | 0.1479 |
| 28966 | SNX24 | P75T-E | Human | Esophagus | ESCC | 3.48e-08 | 2.01e-01 | 0.1125 |
| 28966 | SNX24 | P76T-E | Human | Esophagus | ESCC | 1.85e-17 | 1.84e-01 | 0.1207 |
| 28966 | SNX24 | P79T-E | Human | Esophagus | ESCC | 7.05e-08 | 8.90e-02 | 0.1154 |
| 28966 | SNX24 | P80T-E | Human | Esophagus | ESCC | 9.77e-20 | 3.61e-01 | 0.155 |
| 28966 | SNX24 | P82T-E | Human | Esophagus | ESCC | 3.25e-08 | 4.69e-01 | 0.1072 |
| Page: 1 2 3 4 |
| Tissue | Expression Dynamics | Abbreviation |
| Esophagus | 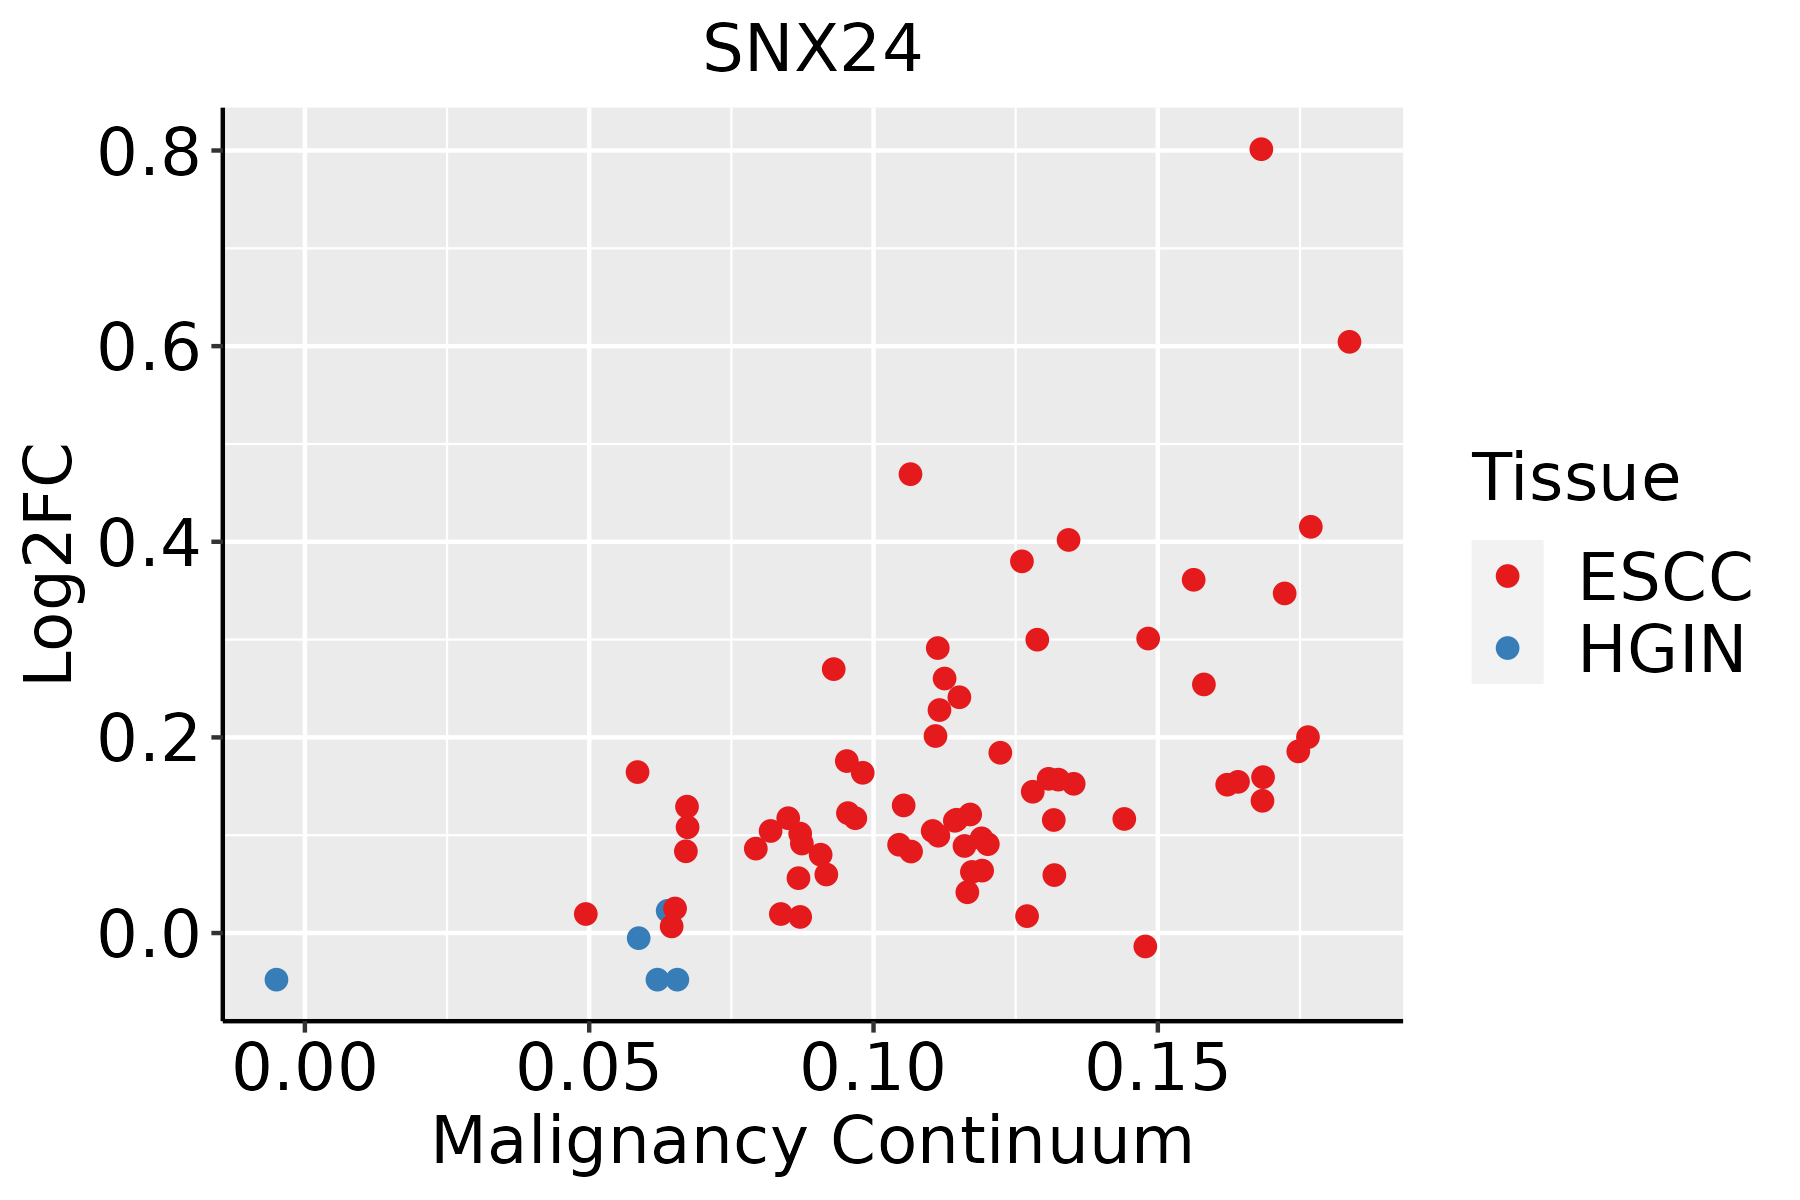 | ESCC: Esophageal squamous cell carcinoma |
| HGIN: High-grade intraepithelial neoplasias | ||
| LGIN: Low-grade intraepithelial neoplasias | ||
| Oral Cavity | 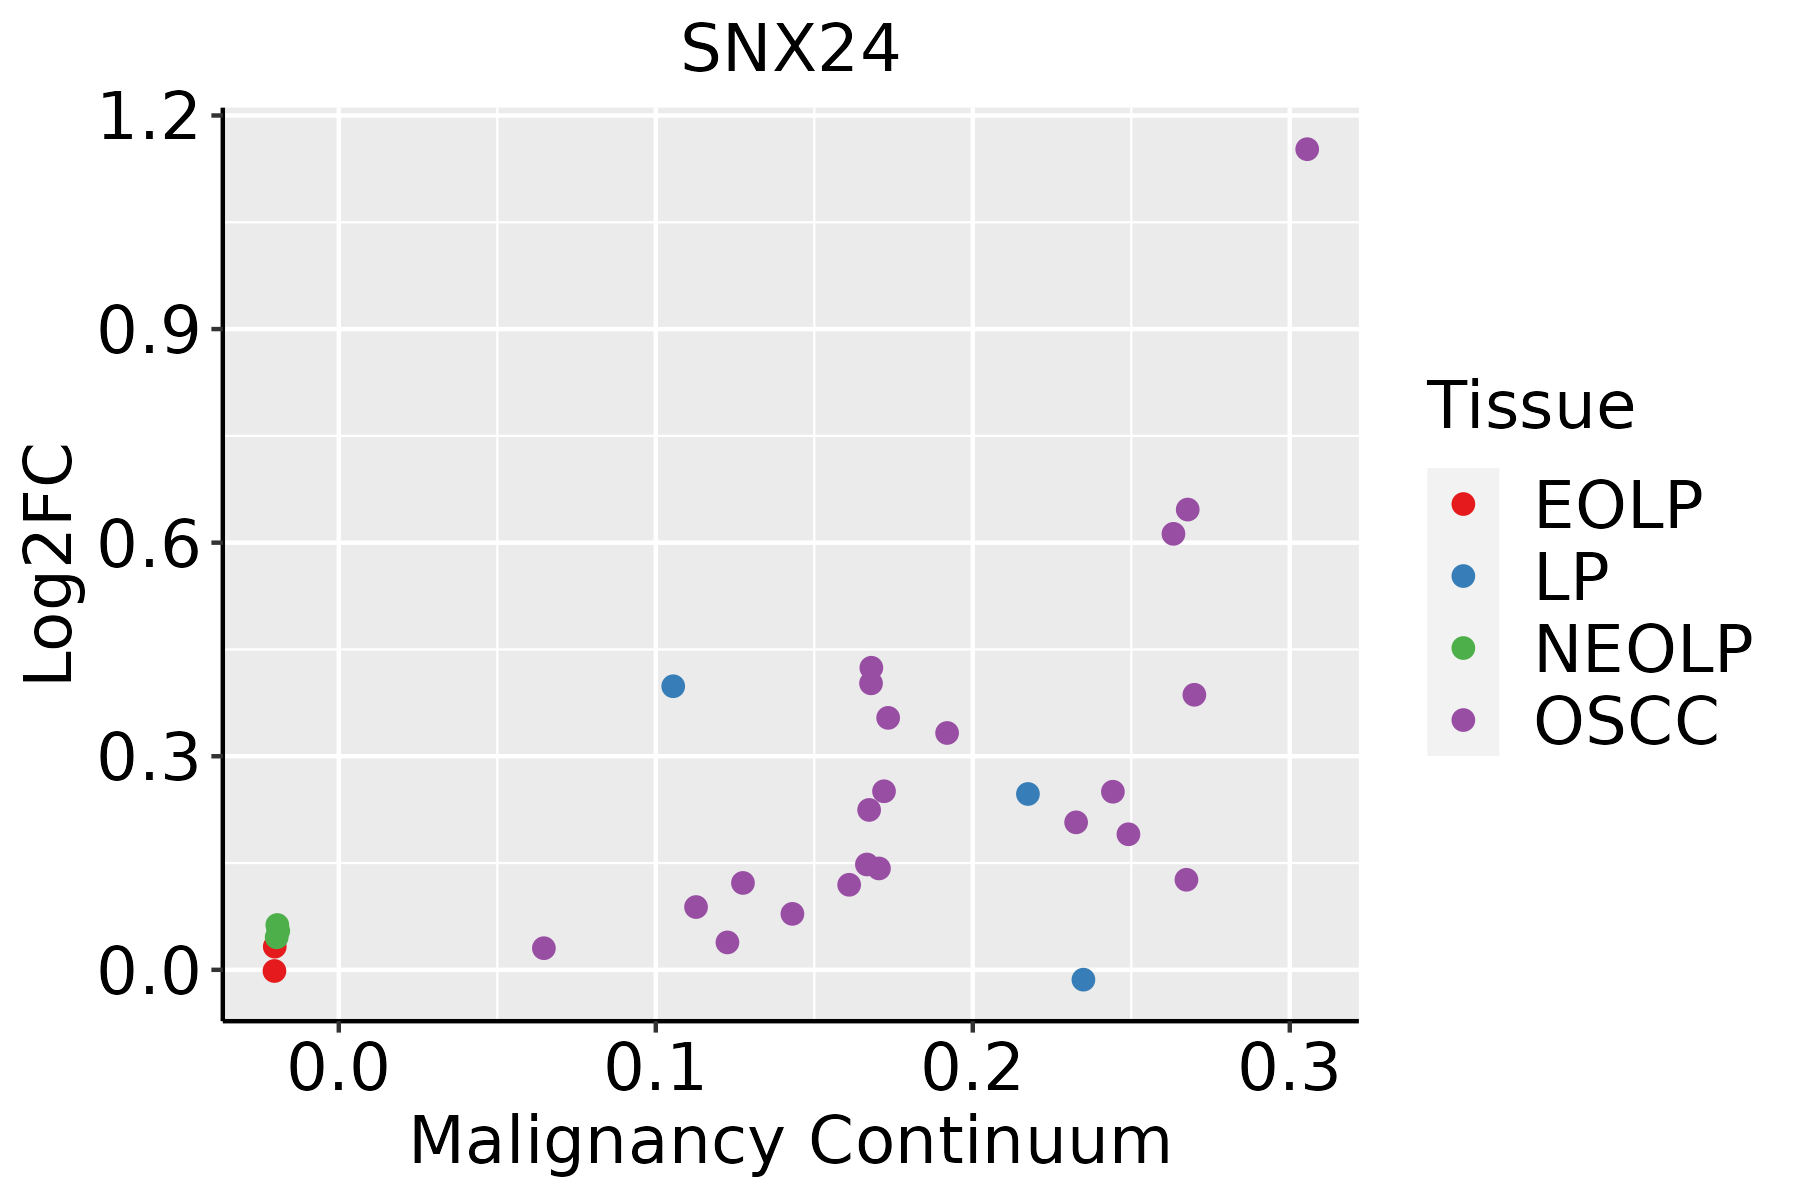 | EOLP: Erosive Oral lichen planus |
| LP: leukoplakia | ||
| NEOLP: Non-erosive oral lichen planus | ||
| OSCC: Oral squamous cell carcinoma | ||
| Thyroid |  | ATC: Anaplastic thyroid cancer |
| HT: Hashimoto's thyroiditis | ||
| PTC: Papillary thyroid cancer |
| ∗log2FC in expression of this searched gene in stem-like cells from each diseased tissue sample relative to stem-like cells in normal samples in each tissue plotted against the malignancy continuum. Samples are colored based on if they are from different disease stage. |
Top |
Malignant transformation related pathway analysis |
| Find out the enriched GO biological processes and KEGG pathways involved in transition from healthy to precancer to cancer |
| Tissue | Disease Stage | Enriched GO biological Processes |
| Colorectum | AD |  |
| Colorectum | SER |  |
| Colorectum | MSS |  |
| Colorectum | MSI-H |  |
| Colorectum | FAP |  |
| ∗Top 15 enriched GO BP terms are showed in the bar plot of each disease state in each tissue. Each row represents a significant GO biological process which is colored according to the -log10(p.adjust). |
| Page: 1 2 3 4 5 6 7 8 9 |
| GO ID | Tissue | Disease Stage | Description | Gene Ratio | Bg Ratio | pvalue | p.adjust | Count |
| Page: 1 |
| Pathway ID | Tissue | Disease Stage | Description | Gene Ratio | Bg Ratio | pvalue | p.adjust | qvalue | Count |
| Page: 1 |
Top |
Cell-cell communication analysis |
| Identification of potential cell-cell interactions between two cell types and their ligand-receptor pairs for different disease states |
| Ligand | Receptor | LRpair | Pathway | Tissue | Disease Stage |
| Page: 1 |
Top |
Single-cell gene regulatory network inference analysis |
| Find out the significant the regulons (TFs) and the target genes of each regulon across cell types for different disease states |
| TF | Cell Type | Tissue | Disease Stage | Target Gene | RSS | Regulon Activity |
| ∗The dot plots of a searched regulon are shown for all cell subpopulations in each disease state of each tissue based on the regulon specific score inferred using pySCENIC and by calculating the average expression. |
| Page: 1 |
Top |
Somatic mutation of malignant transformation related genes |
| Annotation of somatic variants for genes involved in malignant transformation |
| Hugo Symbol | Variant Class | Variant Classification | dbSNP RS | HGVSc | HGVSp | HGVSp Short | SWISSPROT | BIOTYPE | SIFT | PolyPhen | Tumor Sample Barcode | Tissue | Histology | Sex | Age | Stage | Therapy Types | Drugs | Outcome |
| SNX24 | SNV | Missense_Mutation | novel | c.31N>A | p.Glu11Lys | p.E11K | Q9Y343 | protein_coding | deleterious(0.05) | benign(0.001) | TCGA-3C-AALI-01 | Breast | breast invasive carcinoma | Female | <65 | I/II | Unspecific | Poly E | Complete Response |
| SNX24 | SNV | Missense_Mutation | rs761488376 | c.43C>A | p.Leu15Met | p.L15M | Q9Y343 | protein_coding | tolerated(0.23) | benign(0.003) | TCGA-BH-A18G-01 | Breast | breast invasive carcinoma | Female | >=65 | I/II | Unknown | Unknown | SD |
| SNX24 | SNV | Missense_Mutation | rs754151591 | c.121N>A | p.Glu41Lys | p.E41K | Q9Y343 | protein_coding | deleterious(0) | probably_damaging(0.987) | TCGA-AZ-4315-01 | Colorectum | colon adenocarcinoma | Male | <65 | I/II | Unknown | Unknown | SD |
| SNX24 | SNV | Missense_Mutation | c.338G>A | p.Ser113Asn | p.S113N | Q9Y343 | protein_coding | tolerated(0.1) | benign(0.143) | TCGA-DC-4749-01 | Colorectum | rectum adenocarcinoma | Male | <65 | I/II | Unknown | Unknown | SD | |
| SNX24 | SNV | Missense_Mutation | rs767703090 | c.491C>A | p.Pro164His | p.P164H | Q9Y343 | protein_coding | deleterious(0) | possibly_damaging(0.455) | TCGA-AP-A0LM-01 | Endometrium | uterine corpus endometrioid carcinoma | Female | <65 | III/IV | Chemotherapy | cisplatin | SD |
| SNX24 | SNV | Missense_Mutation | novel | c.254N>A | p.Val85Asp | p.V85D | Q9Y343 | protein_coding | deleterious(0) | possibly_damaging(0.486) | TCGA-AP-A1DK-01 | Endometrium | uterine corpus endometrioid carcinoma | Female | <65 | I/II | Unknown | Unknown | SD |
| SNX24 | SNV | Missense_Mutation | novel | c.92N>T | p.Arg31Ile | p.R31I | Q9Y343 | protein_coding | deleterious(0) | probably_damaging(0.976) | TCGA-B5-A1MR-01 | Endometrium | uterine corpus endometrioid carcinoma | Female | >=65 | III/IV | Unknown | Unknown | SD |
| SNX24 | SNV | Missense_Mutation | c.295T>C | p.Phe99Leu | p.F99L | Q9Y343 | protein_coding | deleterious(0) | benign(0) | TCGA-DF-A2KU-01 | Endometrium | uterine corpus endometrioid carcinoma | Female | Unknown | I/II | Unknown | Unknown | SD | |
| SNX24 | SNV | Missense_Mutation | c.208N>A | p.Val70Ile | p.V70I | Q9Y343 | protein_coding | deleterious(0.04) | probably_damaging(0.956) | TCGA-44-6779-01 | Lung | lung adenocarcinoma | Female | <65 | I/II | Chemotherapy | taxol | PD | |
| SNX24 | SNV | Missense_Mutation | novel | c.191G>A | p.Arg64Lys | p.R64K | Q9Y343 | protein_coding | tolerated(0.26) | probably_damaging(0.946) | TCGA-55-7910-01 | Lung | lung adenocarcinoma | Female | <65 | I/II | Chemotherapy | cisplatin | PD |
| Page: 1 2 |
Top |
Related drugs of malignant transformation related genes |
| Identification of chemicals and drugs interact with genes involved in malignant transfromation |
| (DGIdb 4.0) |
| Entrez ID | Symbol | Category | Interaction Types | Drug Claim Name | Drug Name | PMIDs |
| Page: 1 |

Copyright 2023-Present -The University of Texas Health Science Center at Houston |