Schematic overview of the cellular and molecular mechanisms involved in the cancer progression, including the proposed cellular and molecular mechanisms in cancer cells trajectory. AT1: alveolar type 1 cells; AT2: alveolar type 2 cells; AAH: atypical adenomatous hyperplasia; AIS: adenocarcinoma in situ; MIA: minimally invasive adenocarcinoma; IA: invasive adenocarcinoma; EMT: epithelial-mesenchymal transition

Home

Download

Statistics

Help

Contact

Center for Computational Systems Medicine
leaf

Gene summary

leaf

Malignant transformation analysis

leaf

Malignant transformation related pathway analysis

leaf

Cell-cell communication analysis

leaf

Single-cell gene regulatory network inference analysis

leaf

Somatic mutation of malignant transformation related genes

leaf

Related drugs of malignant transformation related genes

Gene: SNX17

Gene summary for SNX17

check button Gene summary.

Gene informationSpeciesHuman
Gene symbol

SNX17

Gene ID

9784

Gene namesorting nexin 17
Gene AliasSNX17
Cytomap2p23.3
Gene Typeprotein-coding
GO ID

GO:0001568

UniProtAcc

B4DTB8


Top

Malignant transformation analysis

check button Identification of the aberrant gene expression in precancerous and cancerous lesions by comparing the gene expression of stem-like cells in diseased tissues with normal stem cells
check button Malignant transformation involving gene list.
Entrez IDSymbolReplicatesSpeciesOrganTissueAdj P-valueLog2FCMalignancy
9784SNX17HTA11_99999974143_84620HumanColorectumMSS5.49e-184.39e-010.3005
9784SNX17LZE2THumanEsophagusESCC4.77e-087.49e-010.082
9784SNX17LZE4THumanEsophagusESCC2.50e-237.67e-010.0811
9784SNX17LZE7THumanEsophagusESCC4.38e-064.62e-010.0667
9784SNX17LZE8THumanEsophagusESCC1.48e-134.58e-010.067
9784SNX17LZE20THumanEsophagusESCC1.76e-022.65e-010.0662
9784SNX17LZE22D1HumanEsophagusHGIN1.90e-072.82e-010.0595
9784SNX17LZE22THumanEsophagusESCC1.03e-046.33e-010.068
9784SNX17LZE24THumanEsophagusESCC2.42e-267.41e-010.0596
9784SNX17LZE21THumanEsophagusESCC4.39e-096.63e-010.0655
9784SNX17LZE6THumanEsophagusESCC8.80e-168.74e-010.0845
9784SNX17P1T-EHumanEsophagusESCC6.24e-076.06e-010.0875
9784SNX17P2T-EHumanEsophagusESCC1.30e-801.47e+000.1177
9784SNX17P4T-EHumanEsophagusESCC5.06e-431.04e+000.1323
9784SNX17P5T-EHumanEsophagusESCC1.76e-205.16e-010.1327
9784SNX17P8T-EHumanEsophagusESCC6.21e-489.00e-010.0889
9784SNX17P9T-EHumanEsophagusESCC8.82e-297.06e-010.1131
9784SNX17P10T-EHumanEsophagusESCC2.14e-439.26e-010.116
9784SNX17P11T-EHumanEsophagusESCC2.91e-281.28e+000.1426
9784SNX17P12T-EHumanEsophagusESCC7.59e-479.65e-010.1122
Page: 1 2 3 4 5 6 7 8 

check button Transcriptomic changes along malignancy continuum.
TissueExpression DynamicsAbbreviation
Colorectum (GSE201348)The image shows the transcriptomic changes along malignancy continuum.log2FC in expression of this searched gene in stem-like cells from each diseased tissue sample relative to stem-like cells in normal samples in each tissue plotted against the malignancy continuum. Samples are colored based on if they are from different disease stage.FAP: Familial adenomatous polyposis
CRC: Colorectal cancer
Colorectum (HTA11)The image shows the transcriptomic changes along malignancy continuum.log2FC in expression of this searched gene in stem-like cells from each diseased tissue sample relative to stem-like cells in normal samples in each tissue plotted against the malignancy continuum. Samples are colored based on if they are from different disease stage.AD: Adenomas
SER: Sessile serrated lesions
MSI-H: Microsatellite-high colorectal cancer
MSS: Microsatellite stable colorectal cancer
EsophagusThe image shows the transcriptomic changes along malignancy continuum.log2FC in expression of this searched gene in stem-like cells from each diseased tissue sample relative to stem-like cells in normal samples in each tissue plotted against the malignancy continuum. Samples are colored based on if they are from different disease stage.
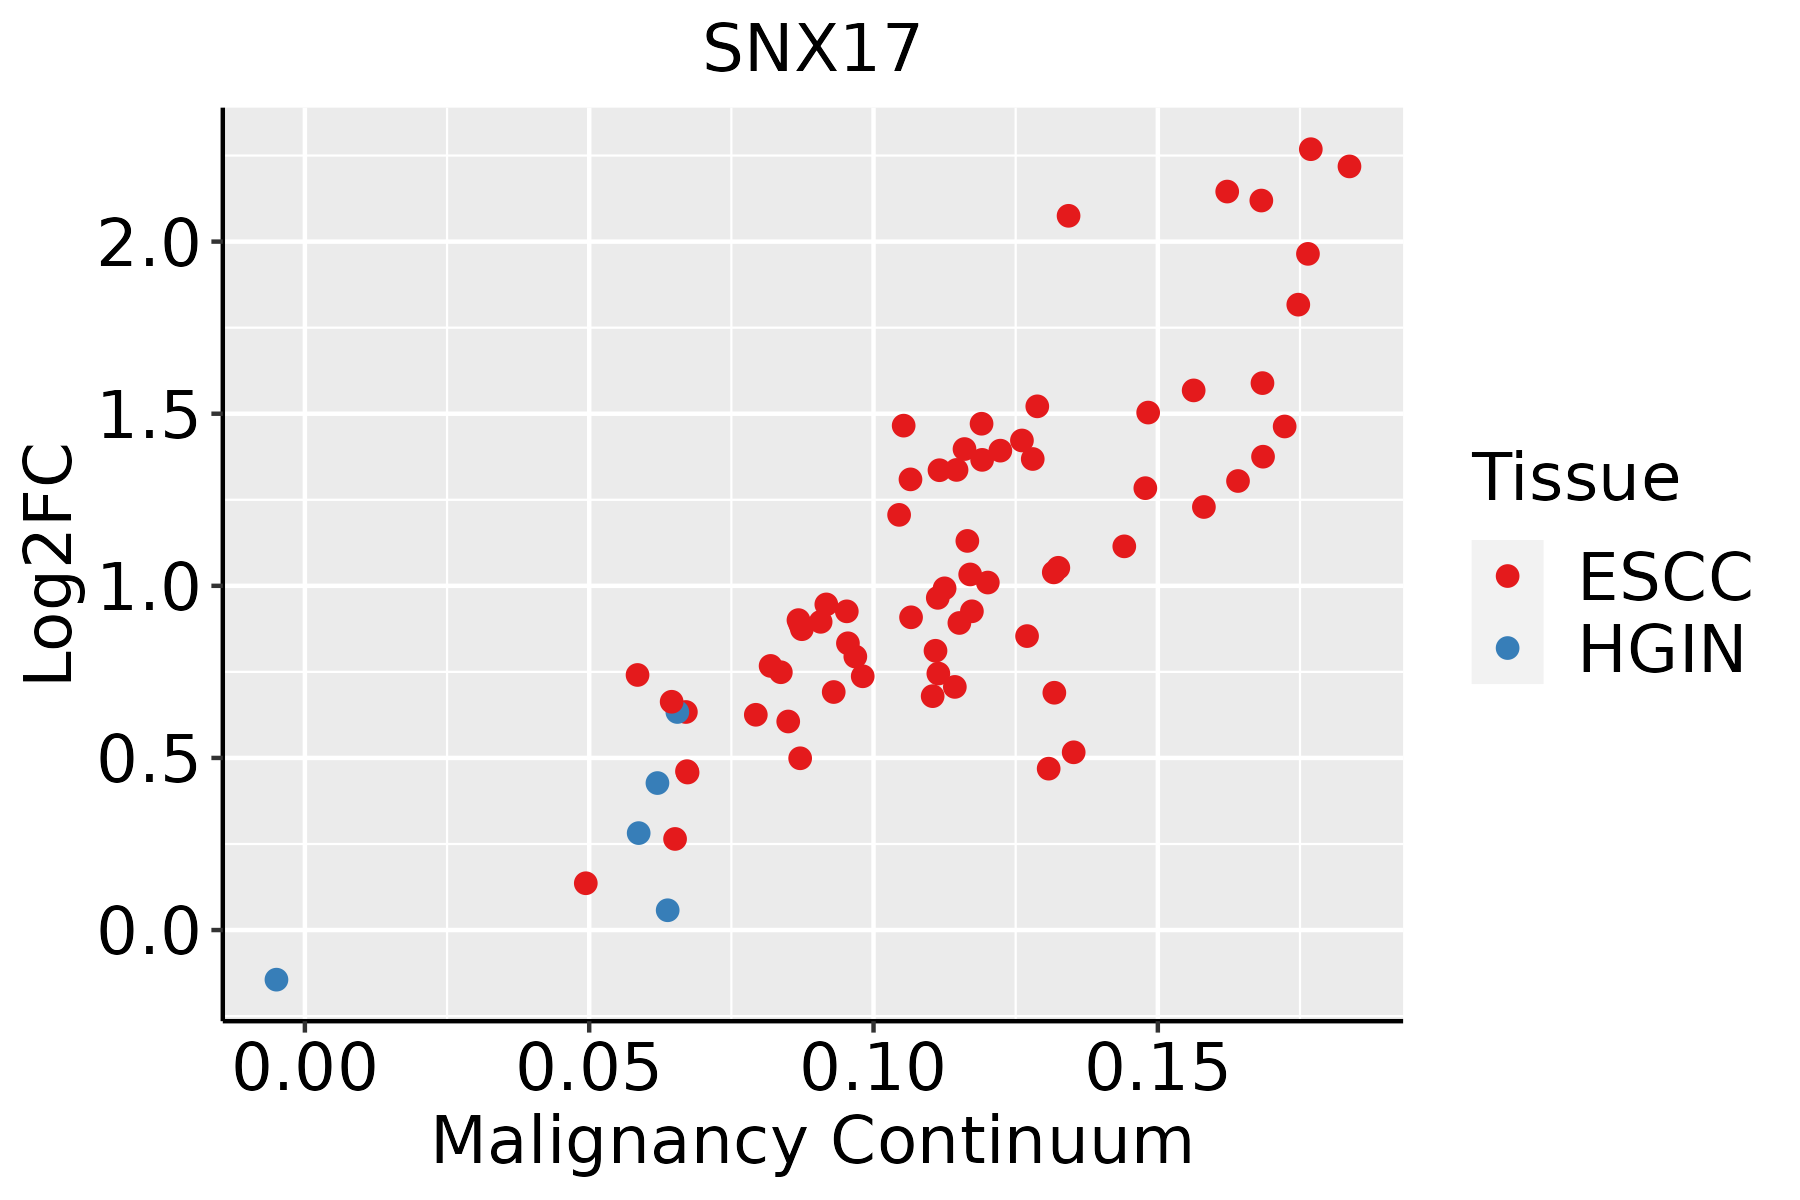
ESCC: Esophageal squamous cell carcinoma
HGIN: High-grade intraepithelial neoplasias
LGIN: Low-grade intraepithelial neoplasias
LiverThe image shows the transcriptomic changes along malignancy continuum.log2FC in expression of this searched gene in stem-like cells from each diseased tissue sample relative to stem-like cells in normal samples in each tissue plotted against the malignancy continuum. Samples are colored based on if they are from different disease stage.
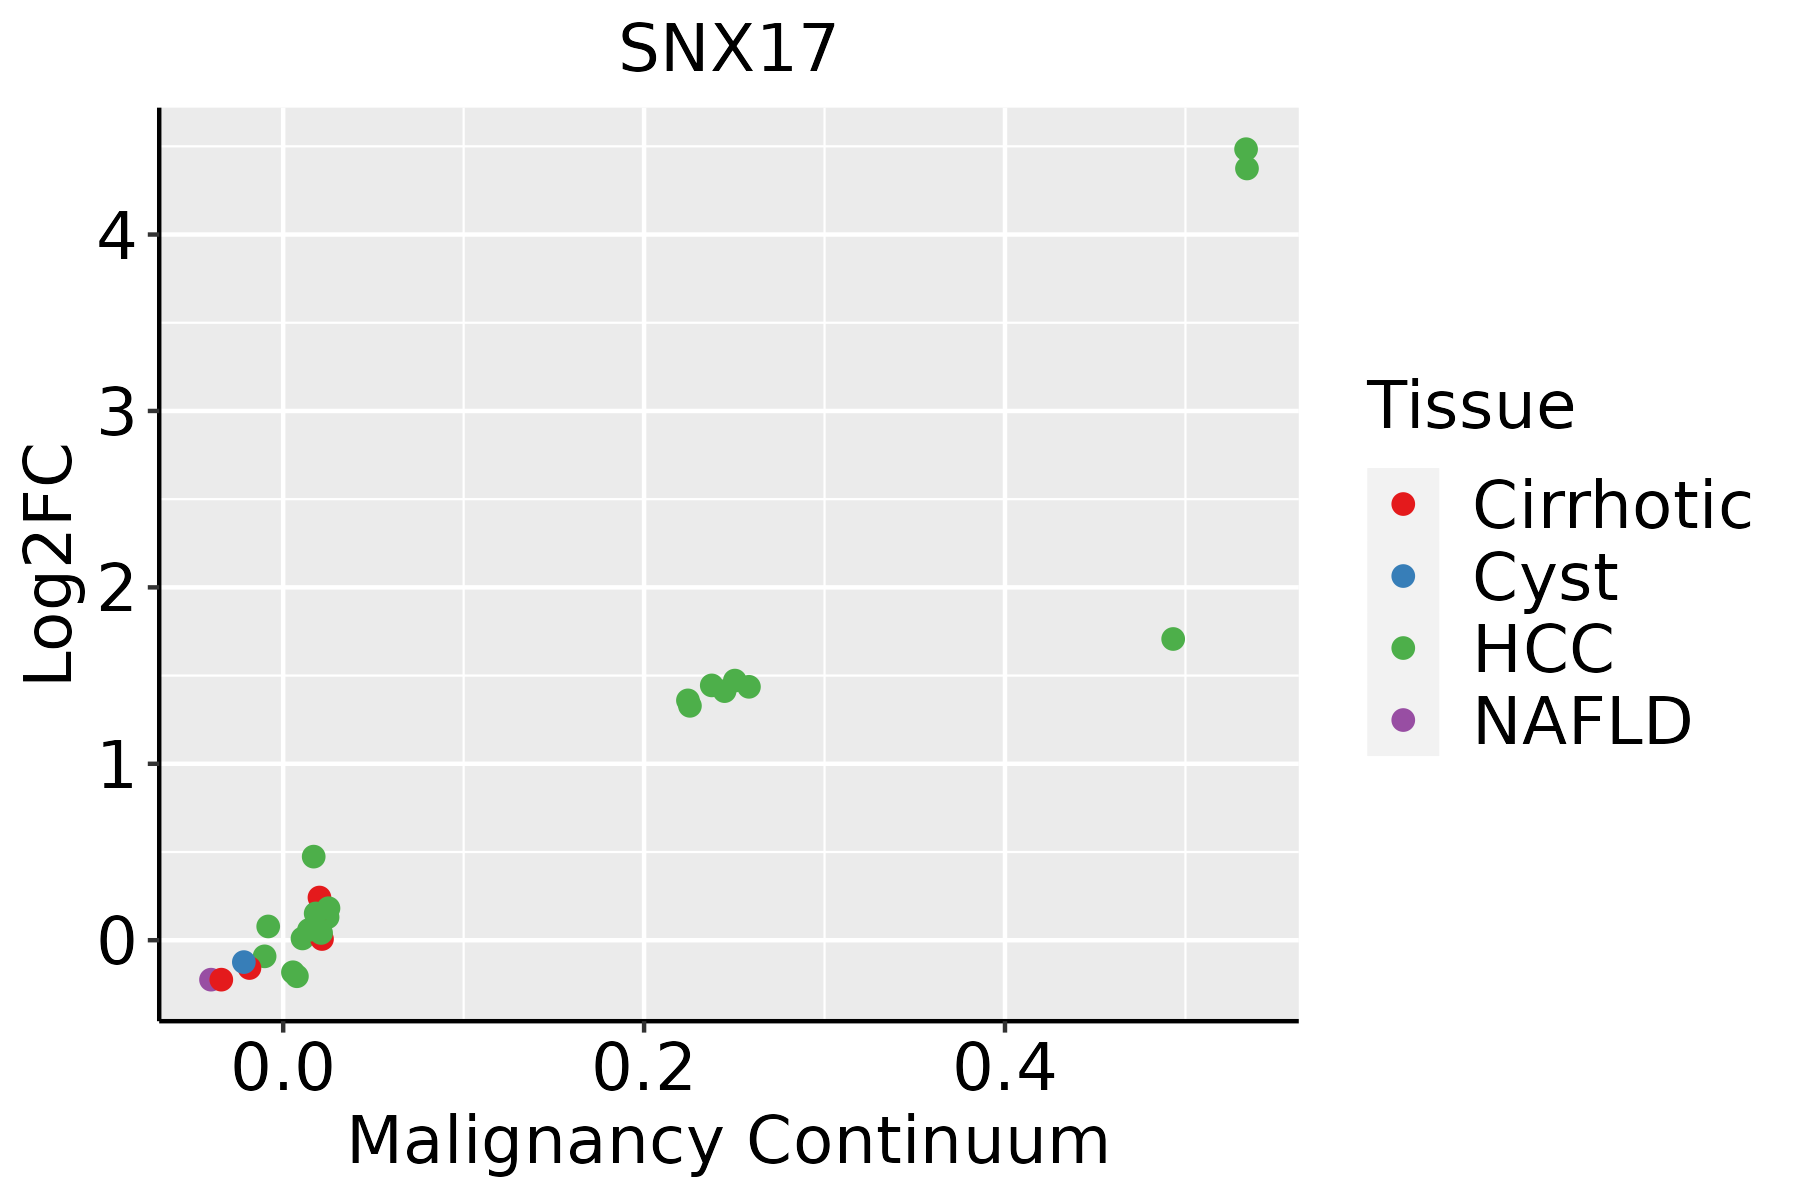
HCC: Hepatocellular carcinoma
NAFLD: Non-alcoholic fatty liver disease
Oral CavityThe image shows the transcriptomic changes along malignancy continuum.log2FC in expression of this searched gene in stem-like cells from each diseased tissue sample relative to stem-like cells in normal samples in each tissue plotted against the malignancy continuum. Samples are colored based on if they are from different disease stage.
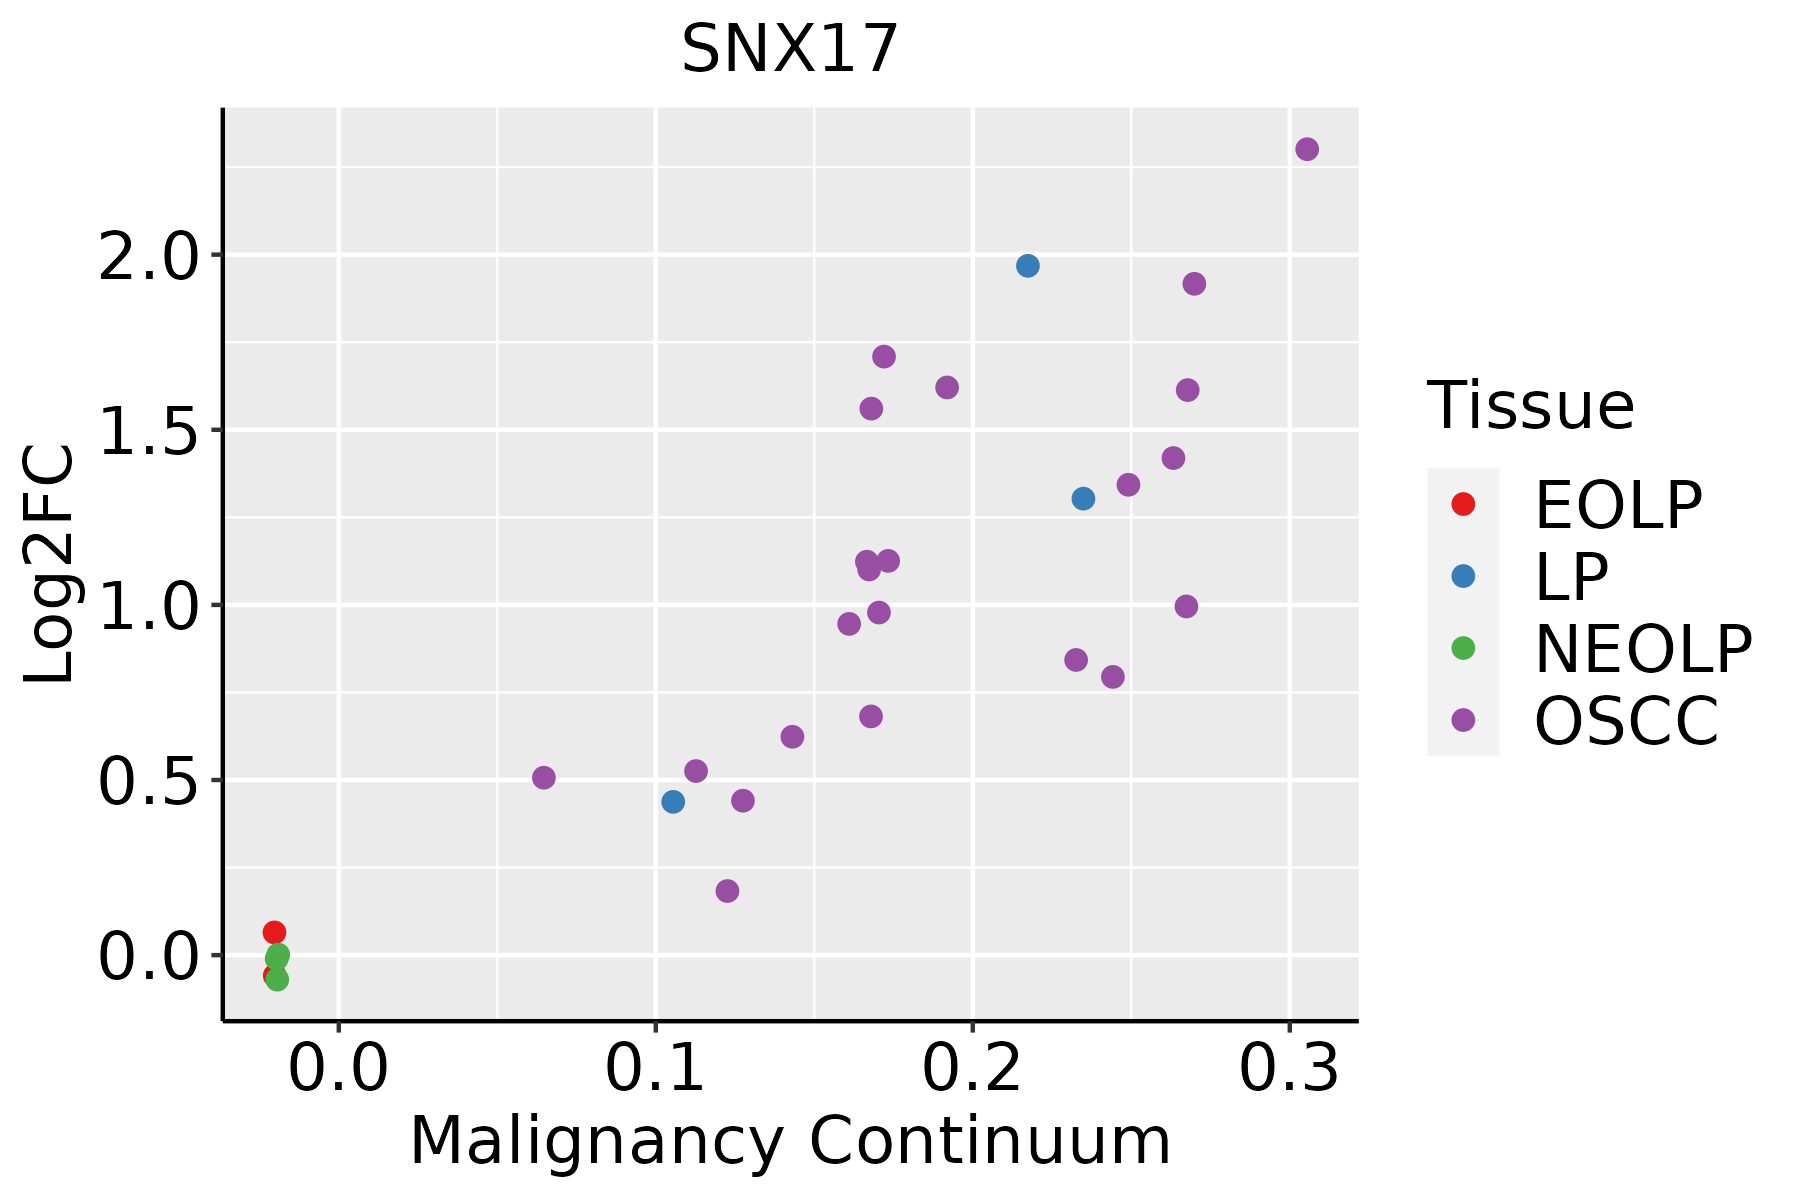
EOLP: Erosive Oral lichen planus
LP: leukoplakia
NEOLP: Non-erosive oral lichen planus
OSCC: Oral squamous cell carcinoma
ProstateThe image shows the transcriptomic changes along malignancy continuum.log2FC in expression of this searched gene in stem-like cells from each diseased tissue sample relative to stem-like cells in normal samples in each tissue plotted against the malignancy continuum. Samples are colored based on if they are from different disease stage.
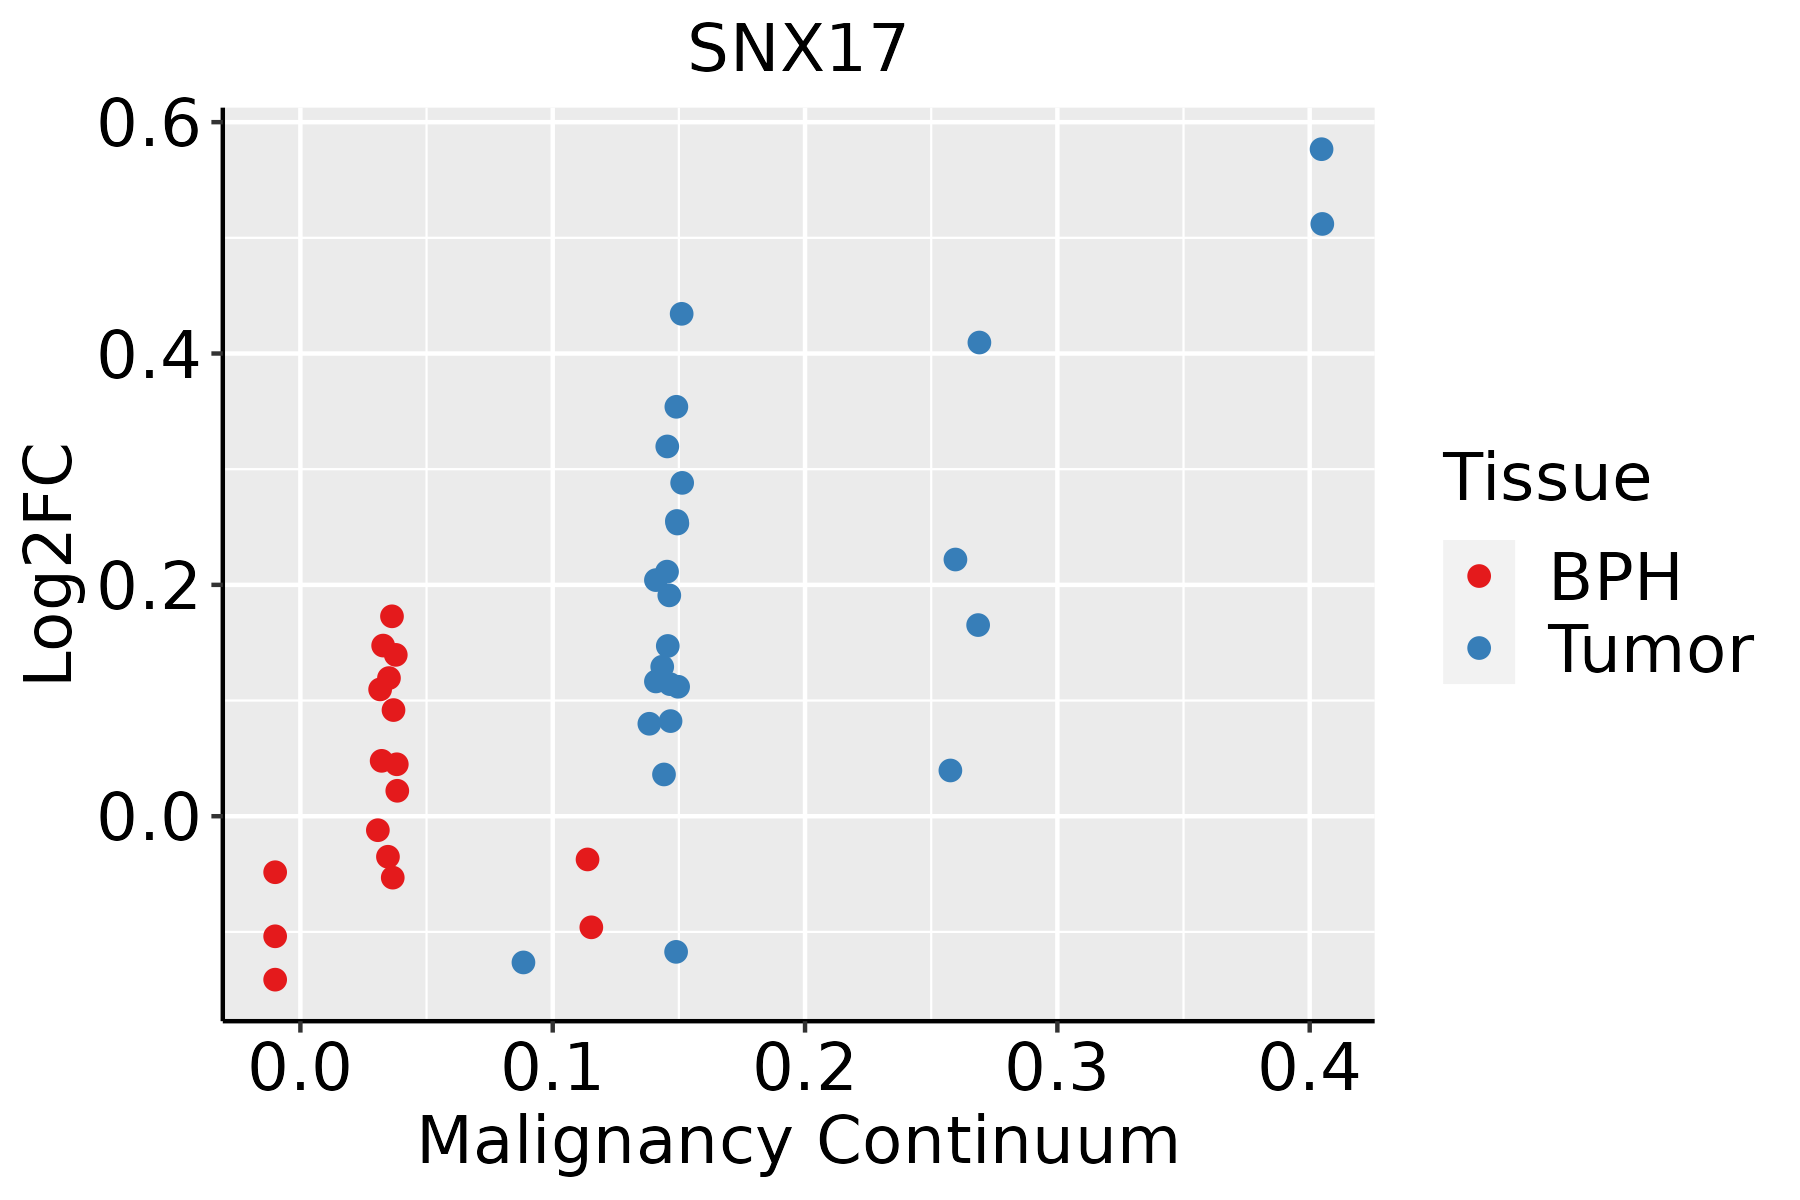
BPH: Benign Prostatic Hyperplasia
SkinThe image shows the transcriptomic changes along malignancy continuum.log2FC in expression of this searched gene in stem-like cells from each diseased tissue sample relative to stem-like cells in normal samples in each tissue plotted against the malignancy continuum. Samples are colored based on if they are from different disease stage.
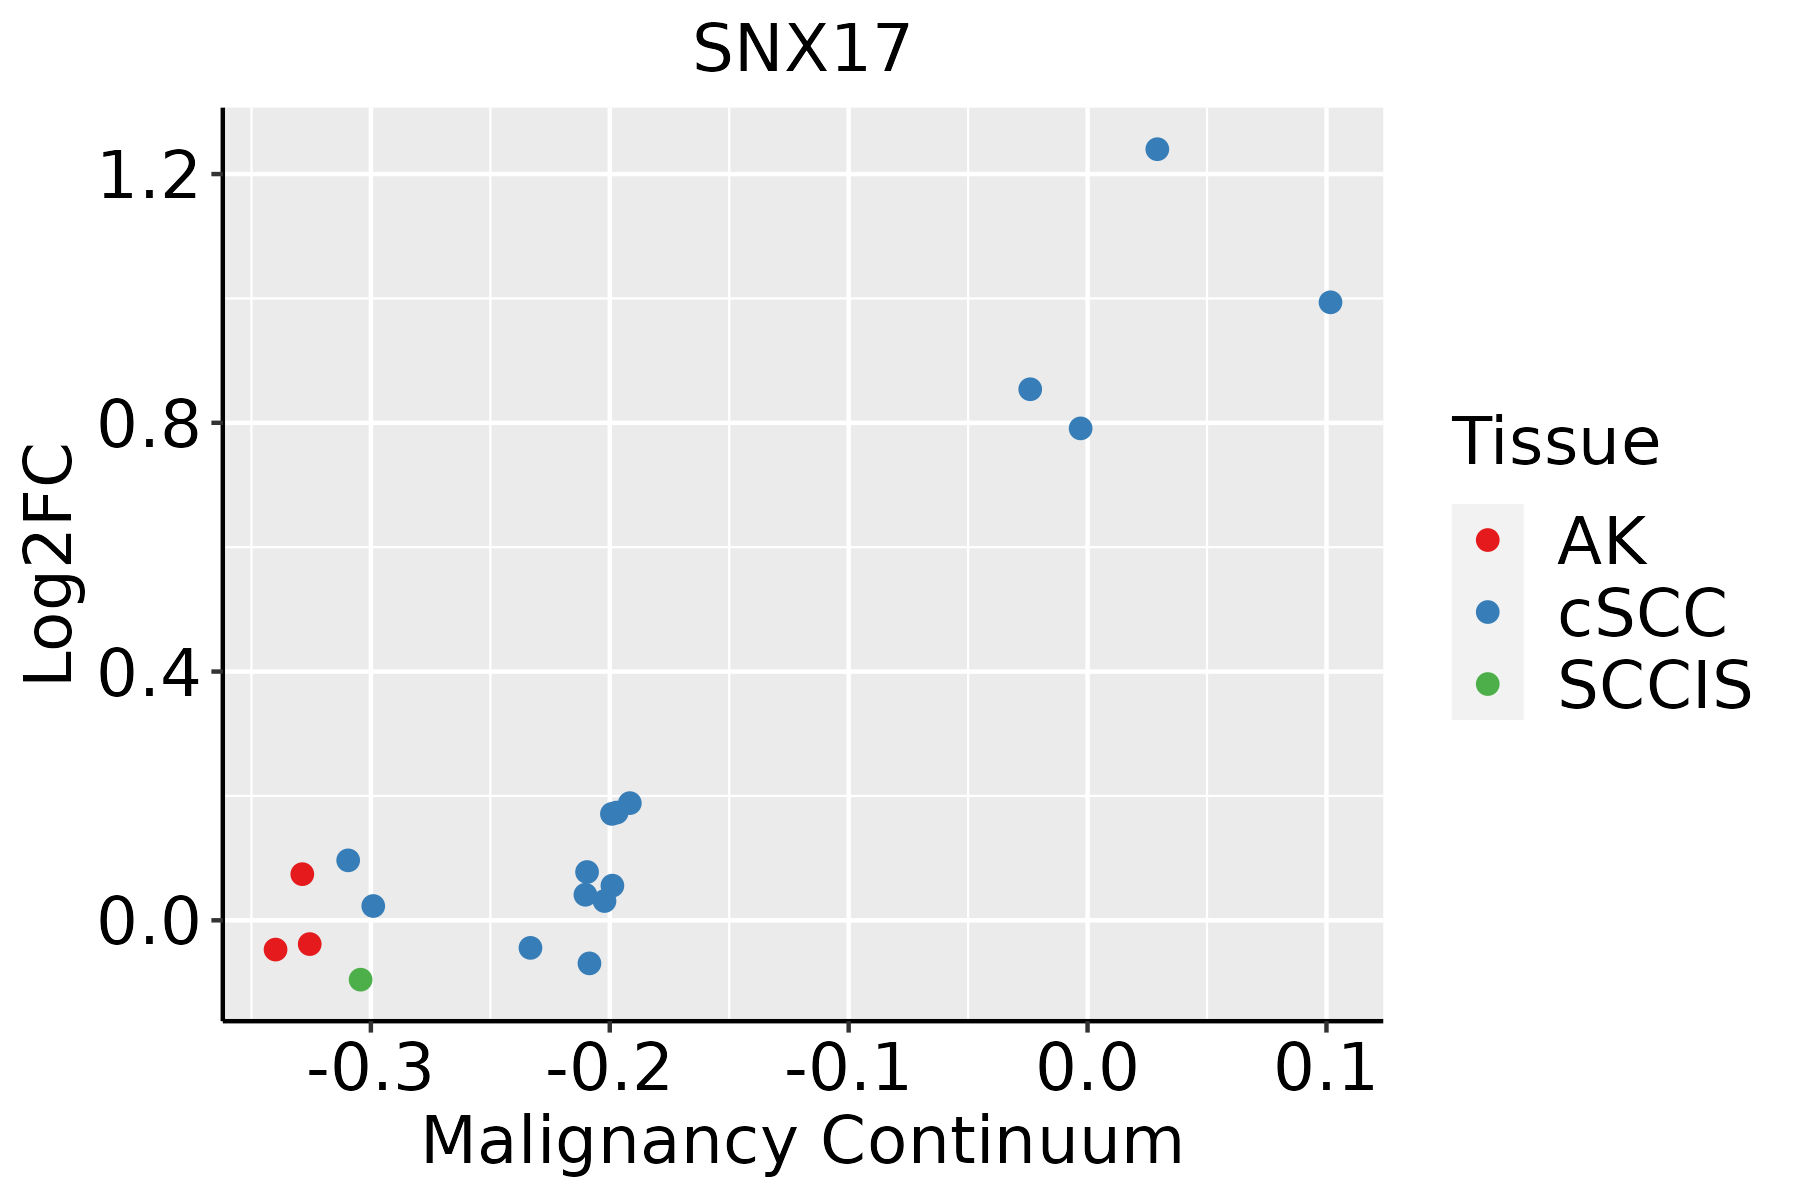
AK: Actinic keratosis
cSCC: Cutaneous squamous cell carcinoma
SCCIS:squamous cell carcinoma in situ
ThyroidThe image shows the transcriptomic changes along malignancy continuum.log2FC in expression of this searched gene in stem-like cells from each diseased tissue sample relative to stem-like cells in normal samples in each tissue plotted against the malignancy continuum. Samples are colored based on if they are from different disease stage.
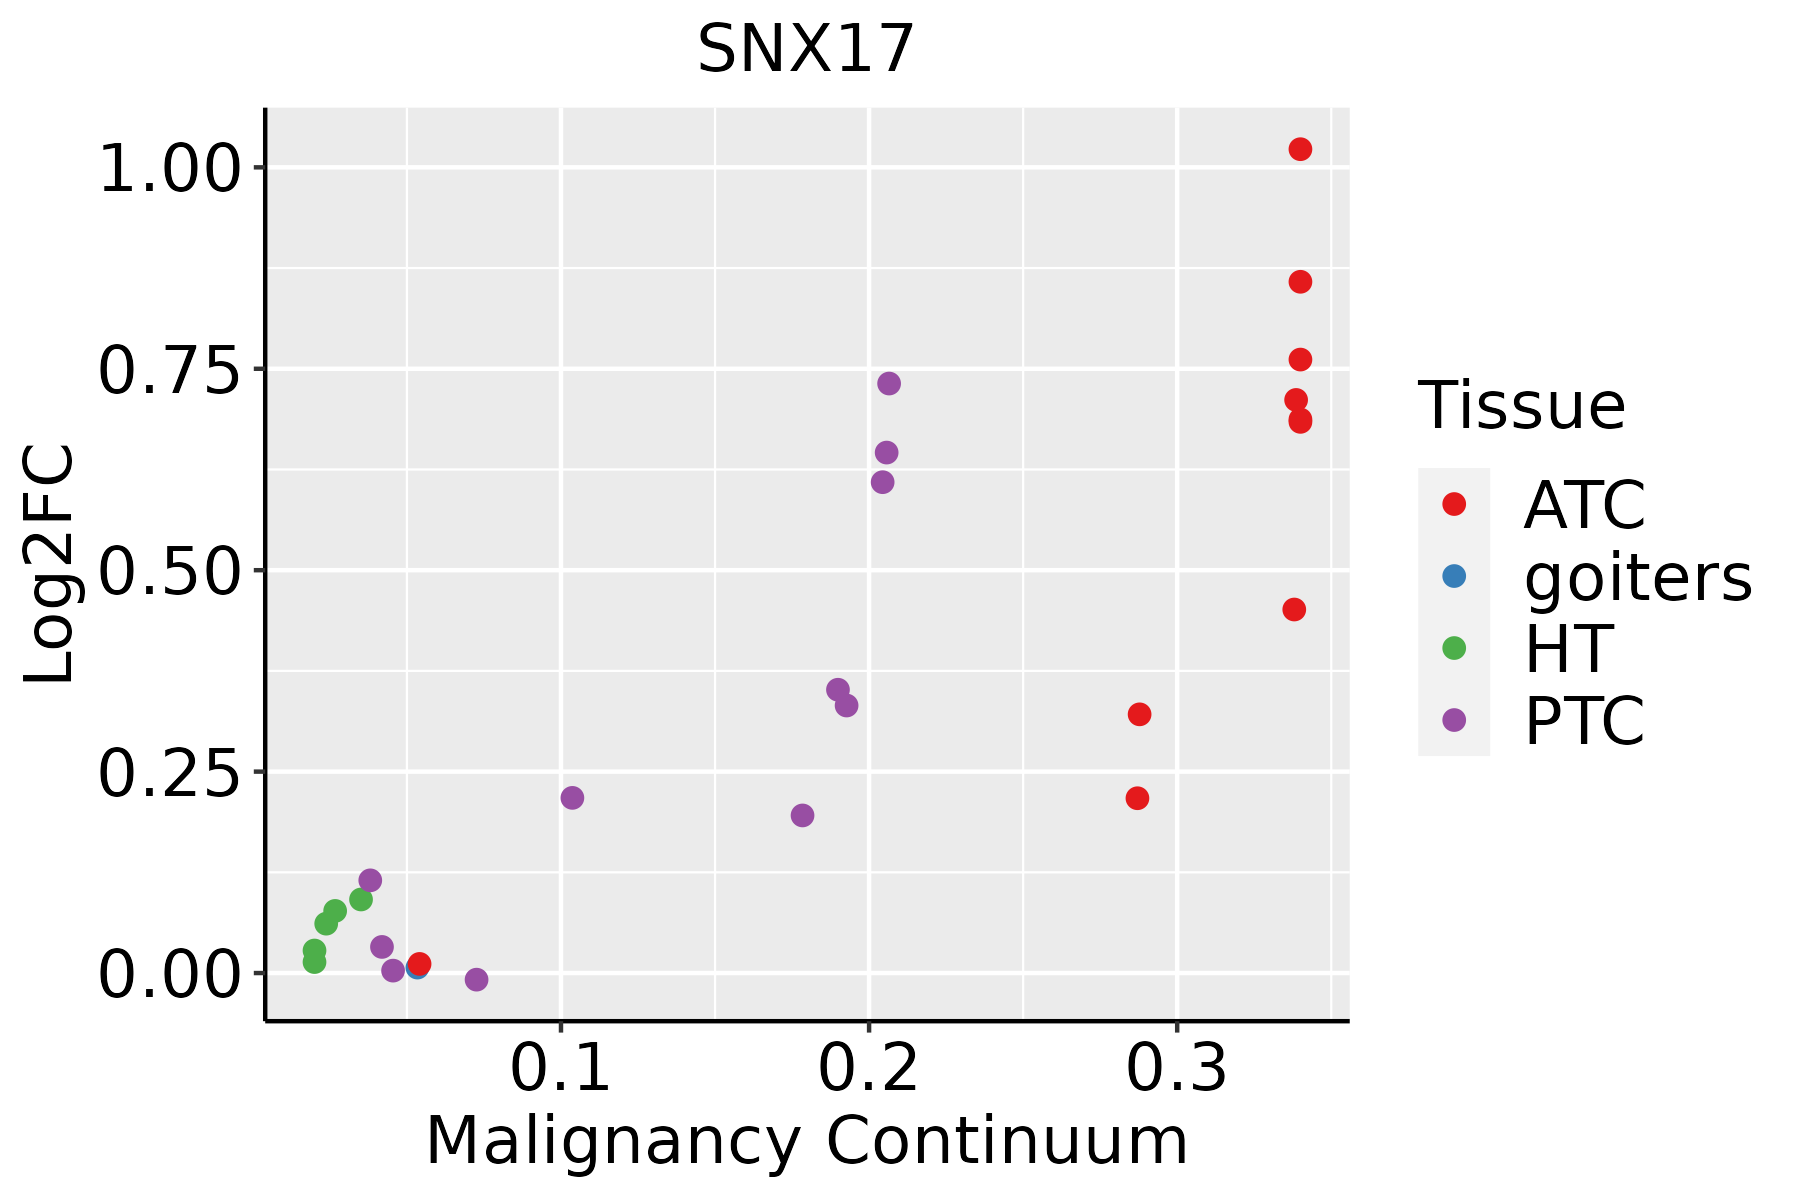
ATC: Anaplastic thyroid cancer
HT: Hashimoto's thyroiditis
PTC: Papillary thyroid cancer
∗log2FC in expression of this searched gene in stem-like cells from each diseased tissue sample relative to stem-like cells in normal samples in each tissue plotted against the malignancy continuum. Samples are colored based on if they are from different disease stage.

Top

Malignant transformation related pathway analysis

check buttonFind out the enriched GO biological processes and KEGG pathways involved in transition from healthy to precancer to cancer
check button Figure of enriched GO biological processes.
TissueDisease StageEnriched GO biological Processes
ColorectumADGO analysis - Figure of enriched GO biological processes: Top 15 enriched GO BP terms are showed in the bar plot of each disease state in each tissue. Each row represents a significant GO biological process which is colored according to the -log10(p.adjust).
ColorectumSERGO analysis - Figure of enriched GO biological processes: Top 15 enriched GO BP terms are showed in the bar plot of each disease state in each tissue. Each row represents a significant GO biological process which is colored according to the -log10(p.adjust).
ColorectumMSSGO analysis - Figure of enriched GO biological processes: Top 15 enriched GO BP terms are showed in the bar plot of each disease state in each tissue. Each row represents a significant GO biological process which is colored according to the -log10(p.adjust).
ColorectumMSI-HGO analysis - Figure of enriched GO biological processes: Top 15 enriched GO BP terms are showed in the bar plot of each disease state in each tissue. Each row represents a significant GO biological process which is colored according to the -log10(p.adjust).
ColorectumFAPGO analysis - Figure of enriched GO biological processes: Top 15 enriched GO BP terms are showed in the bar plot of each disease state in each tissue. Each row represents a significant GO biological process which is colored according to the -log10(p.adjust).
∗Top 15 enriched GO BP terms are showed in the bar plot of each disease state in each tissue. Each row represents a significant GO biological process which is colored according to the -log10(p.adjust).
Page: 1 2 3 4 5 6 7 8 9 

check button Enriched GO biological processes.
GO IDTissueDisease StageDescriptionGene RatioBg Ratiopvaluep.adjustCount
GO:0016197ColorectumADendosomal transport90/3918230/187231.88e-101.73e-0890
GO:0098876ColorectumADvesicle-mediated transport to the plasma membrane57/3918136/187232.30e-081.27e-0657
GO:1901361ColorectumADorganic cyclic compound catabolic process153/3918495/187238.23e-084.18e-06153
GO:0044282ColorectumADsmall molecule catabolic process118/3918376/187231.05e-063.55e-05118
GO:0006066ColorectumADalcohol metabolic process106/3918353/187233.02e-055.57e-04106
GO:0016042ColorectumADlipid catabolic process97/3918320/187234.31e-057.56e-0497
GO:0006898ColorectumADreceptor-mediated endocytosis76/3918244/187231.07e-041.59e-0376
GO:0030100ColorectumADregulation of endocytosis67/3918211/187231.42e-042.01e-0367
GO:0032456ColorectumADendocytic recycling28/391873/187234.87e-045.30e-0328
GO:0046164ColorectumADalcohol catabolic process20/391855/187236.03e-033.78e-0220
GO:0008202ColorectumADsteroid metabolic process85/3918319/187238.07e-034.75e-0285
GO:00161971ColorectumSERendosomal transport61/2897230/187231.03e-053.35e-0461
GO:00160421ColorectumSERlipid catabolic process77/2897320/187233.52e-059.18e-0477
GO:00442821ColorectumSERsmall molecule catabolic process87/2897376/187235.31e-051.27e-0387
GO:00988761ColorectumSERvesicle-mediated transport to the plasma membrane37/2897136/187233.08e-045.00e-0337
GO:00060661ColorectumSERalcohol metabolic process79/2897353/187233.50e-045.50e-0379
GO:19013611ColorectumSERorganic cyclic compound catabolic process104/2897495/187235.46e-047.63e-03104
GO:00461641ColorectumSERalcohol catabolic process17/289755/187233.00e-032.65e-0217
GO:00301001ColorectumSERregulation of endocytosis48/2897211/187233.29e-032.82e-0248
GO:19013612ColorectumMSSorganic cyclic compound catabolic process148/3467495/187233.47e-103.18e-08148
Page: 1 2 3 4 5 6 7 8 

check button Enriched KEGG pathways.
Pathway IDTissueDisease StageDescriptionGene RatioBg Ratiopvaluep.adjustqvalueCount
Page: 1 

Top

Cell-cell communication analysis

check buttonIdentification of potential cell-cell interactions between two cell types and their ligand-receptor pairs for different disease states
LigandReceptorLRpairPathwayTissueDisease Stage
Page: 1 

Top

Single-cell gene regulatory network inference analysis

check buttonFind out the significant the regulons (TFs) and the target genes of each regulon across cell types for different disease states
TFCell TypeTissueDisease StageTarget GeneRSSRegulon Activity
∗The dot plots of a searched regulon are shown for all cell subpopulations in each disease state of each tissue based on the regulon specific score inferred using pySCENIC and by calculating the average expression.
Page: 1 

Top

Somatic mutation of malignant transformation related genes

check buttonAnnotation of somatic variants for genes involved in malignant transformation
Hugo SymbolVariant ClassVariant ClassificationdbSNP RSHGVScHGVSpHGVSp ShortSWISSPROTBIOTYPESIFTPolyPhenTumor Sample BarcodeTissueHistologySexAgeStageTherapy TypesDrugsOutcome
SNX17SNVMissense_Mutationrs756756686c.827N>Tp.Ala276Valp.A276VQ15036protein_codingdeleterious(0)benign(0.043)TCGA-A2-A0CX-01Breastbreast invasive carcinomaFemale<65I/IIChemotherapyadriamycinSD
SNX17SNVMissense_Mutationrs747689756c.708N>Tp.Trp236Cysp.W236CQ15036protein_codingdeleterious(0)probably_damaging(0.998)TCGA-AC-A23H-01Breastbreast invasive carcinomaFemale>=65I/IIUnknownUnknownPD
SNX17SNVMissense_Mutationc.1034N>Ap.Arg345Hisp.R345HQ15036protein_codingtolerated(0.1)benign(0.006)TCGA-AQ-A1H3-01Breastbreast invasive carcinomaFemale<65III/IVChemotherapyadriamycinSD
SNX17SNVMissense_Mutationnovelc.954N>Ap.Met318Ilep.M318IQ15036protein_codingtolerated(0.24)benign(0.134)TCGA-B6-A3ZX-01Breastbreast invasive carcinomaFemale<65III/IVChemotherapycyclophosphamidePD
SNX17SNVMissense_Mutationc.1054N>Ap.Tyr352Asnp.Y352NQ15036protein_codingdeleterious(0)probably_damaging(0.999)TCGA-E2-A1LL-01Breastbreast invasive carcinomaFemale>=65III/IVChemotherapydocetaxelPD
SNX17SNVMissense_Mutationnovelc.968T>Gp.Val323Glyp.V323GQ15036protein_codingdeleterious(0)possibly_damaging(0.536)TCGA-OL-A6VO-01Breastbreast invasive carcinomaFemale<65I/IIChemotherapytaxotereCR
SNX17insertionIn_Frame_Insnovelc.281_282insTGGTTTTCTGTCCAGTCTTACTGCTCTAGTAGCCTTTACp.Ser94_Ser95insGlyPheLeuSerSerLeuThrAlaLeuValAlaPheThrp.S94_S95insGFLSSLTALVAFTQ15036protein_codingTCGA-A2-A0D0-01Breastbreast invasive carcinomaFemale<65I/IIChemotherapycytoxanSD
SNX17insertionFrame_Shift_Insnovelc.1390_1391insACCTGATp.Gly464AspfsTer7p.G464Dfs*7Q15036protein_codingTCGA-AQ-A04J-01Breastbreast invasive carcinomaFemale<65I/IIChemotherapycytoxanSD
SNX17insertionFrame_Shift_Insnovelc.1392_1393insCACCCGGGAGTCTATGGTCAAACTCTCAGTGp.Ile465HisfsTer14p.I465Hfs*14Q15036protein_codingTCGA-AQ-A04J-01Breastbreast invasive carcinomaFemale<65I/IIChemotherapycytoxanSD
SNX17insertionNonsense_Mutationnovelc.142_143insCCAGATCTTAAACTCTATTTAACTCAp.Arg48ProfsTer4p.R48Pfs*4Q15036protein_codingTCGA-AR-A0TY-01Breastbreast invasive carcinomaFemale<65I/IIUnspecificPaclitaxelPD
Page: 1 2 3 4 5 6 

Top

Related drugs of malignant transformation related genes

check buttonIdentification of chemicals and drugs interact with genes involved in malignant transfromation
(DGIdb 4.0)
Entrez IDSymbolCategoryInteraction TypesDrug Claim NameDrug NamePMIDs
Page: 1