
|
|||||
|
 | |
| |
| |
| |
| |
| |
|
Gene: SNRNP48 |
Gene summary for SNRNP48 |
| Gene information | Species | Human | Gene symbol | SNRNP48 | Gene ID | 154007 |
| Gene name | small nuclear ribonucleoprotein U11/U12 subunit 48 | |
| Gene Alias | C6orf151 | |
| Cytomap | 6p24.3 | |
| Gene Type | protein-coding | GO ID | GO:0006139 | UniProtAcc | Q6IEG0 |
Top |
Malignant transformation analysis |
| Identification of the aberrant gene expression in precancerous and cancerous lesions by comparing the gene expression of stem-like cells in diseased tissues with normal stem cells |
| Entrez ID | Symbol | Replicates | Species | Organ | Tissue | Adj P-value | Log2FC | Malignancy |
| 154007 | SNRNP48 | P20T-E | Human | Esophagus | ESCC | 5.40e-20 | 4.38e-01 | 0.1124 |
| 154007 | SNRNP48 | P21T-E | Human | Esophagus | ESCC | 2.02e-18 | 3.00e-01 | 0.1617 |
| 154007 | SNRNP48 | P22T-E | Human | Esophagus | ESCC | 3.17e-25 | 4.53e-01 | 0.1236 |
| 154007 | SNRNP48 | P23T-E | Human | Esophagus | ESCC | 2.63e-20 | 3.49e-01 | 0.108 |
| 154007 | SNRNP48 | P24T-E | Human | Esophagus | ESCC | 1.97e-11 | 2.46e-01 | 0.1287 |
| 154007 | SNRNP48 | P26T-E | Human | Esophagus | ESCC | 1.09e-11 | 1.85e-01 | 0.1276 |
| 154007 | SNRNP48 | P27T-E | Human | Esophagus | ESCC | 1.00e-11 | 1.72e-01 | 0.1055 |
| 154007 | SNRNP48 | P28T-E | Human | Esophagus | ESCC | 2.62e-11 | 2.29e-01 | 0.1149 |
| 154007 | SNRNP48 | P30T-E | Human | Esophagus | ESCC | 5.81e-19 | 6.82e-01 | 0.137 |
| 154007 | SNRNP48 | P31T-E | Human | Esophagus | ESCC | 6.59e-18 | 3.69e-01 | 0.1251 |
| 154007 | SNRNP48 | P32T-E | Human | Esophagus | ESCC | 5.26e-11 | 2.89e-01 | 0.1666 |
| 154007 | SNRNP48 | P36T-E | Human | Esophagus | ESCC | 9.07e-08 | 2.20e-01 | 0.1187 |
| 154007 | SNRNP48 | P37T-E | Human | Esophagus | ESCC | 4.23e-10 | 1.83e-01 | 0.1371 |
| 154007 | SNRNP48 | P38T-E | Human | Esophagus | ESCC | 2.51e-03 | 1.89e-01 | 0.127 |
| 154007 | SNRNP48 | P39T-E | Human | Esophagus | ESCC | 9.84e-06 | 1.36e-01 | 0.0894 |
| 154007 | SNRNP48 | P42T-E | Human | Esophagus | ESCC | 1.89e-15 | 2.37e-01 | 0.1175 |
| 154007 | SNRNP48 | P44T-E | Human | Esophagus | ESCC | 6.82e-11 | 1.95e-01 | 0.1096 |
| 154007 | SNRNP48 | P47T-E | Human | Esophagus | ESCC | 1.05e-07 | 1.21e-01 | 0.1067 |
| 154007 | SNRNP48 | P48T-E | Human | Esophagus | ESCC | 3.14e-16 | 1.49e-01 | 0.0959 |
| 154007 | SNRNP48 | P49T-E | Human | Esophagus | ESCC | 9.25e-14 | 6.99e-01 | 0.1768 |
| Page: 1 2 3 4 |
| Tissue | Expression Dynamics | Abbreviation |
| Esophagus | 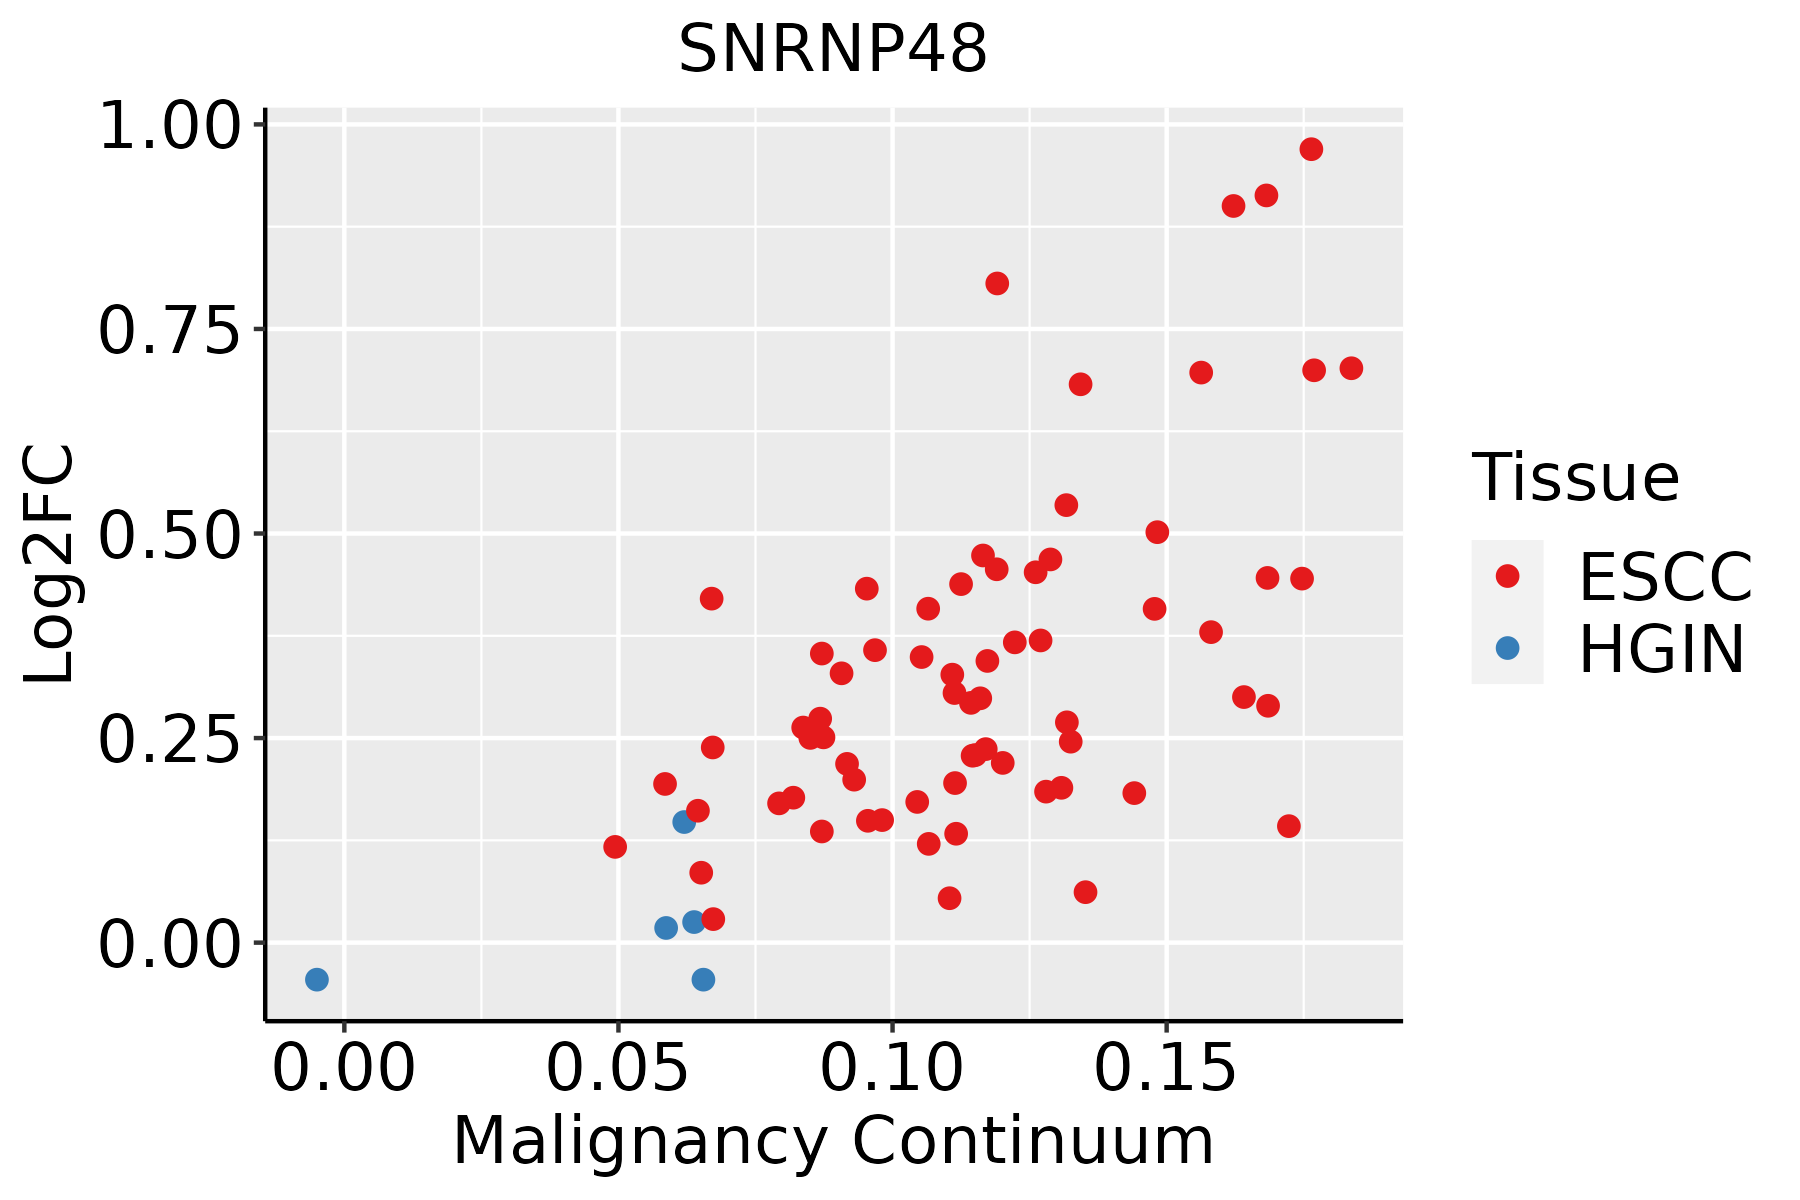 | ESCC: Esophageal squamous cell carcinoma |
| HGIN: High-grade intraepithelial neoplasias | ||
| LGIN: Low-grade intraepithelial neoplasias | ||
| Liver |  | HCC: Hepatocellular carcinoma |
| NAFLD: Non-alcoholic fatty liver disease |
| ∗log2FC in expression of this searched gene in stem-like cells from each diseased tissue sample relative to stem-like cells in normal samples in each tissue plotted against the malignancy continuum. Samples are colored based on if they are from different disease stage. |
Top |
Malignant transformation related pathway analysis |
| Find out the enriched GO biological processes and KEGG pathways involved in transition from healthy to precancer to cancer |
| Tissue | Disease Stage | Enriched GO biological Processes |
| Colorectum | AD |  |
| Colorectum | SER |  |
| Colorectum | MSS |  |
| Colorectum | MSI-H |  |
| Colorectum | FAP |  |
| ∗Top 15 enriched GO BP terms are showed in the bar plot of each disease state in each tissue. Each row represents a significant GO biological process which is colored according to the -log10(p.adjust). |
| Page: 1 2 3 4 5 6 7 8 9 |
| GO ID | Tissue | Disease Stage | Description | Gene Ratio | Bg Ratio | pvalue | p.adjust | Count |
| GO:0008380111 | Esophagus | ESCC | RNA splicing | 336/8552 | 434/18723 | 1.74e-42 | 3.67e-39 | 336 |
| GO:000838022 | Liver | HCC | RNA splicing | 313/7958 | 434/18723 | 1.36e-36 | 1.73e-33 | 313 |
| Page: 1 |
| Pathway ID | Tissue | Disease Stage | Description | Gene Ratio | Bg Ratio | pvalue | p.adjust | qvalue | Count |
| Page: 1 |
Top |
Cell-cell communication analysis |
| Identification of potential cell-cell interactions between two cell types and their ligand-receptor pairs for different disease states |
| Ligand | Receptor | LRpair | Pathway | Tissue | Disease Stage |
| Page: 1 |
Top |
Single-cell gene regulatory network inference analysis |
| Find out the significant the regulons (TFs) and the target genes of each regulon across cell types for different disease states |
| TF | Cell Type | Tissue | Disease Stage | Target Gene | RSS | Regulon Activity |
| ∗The dot plots of a searched regulon are shown for all cell subpopulations in each disease state of each tissue based on the regulon specific score inferred using pySCENIC and by calculating the average expression. |
| Page: 1 |
Top |
Somatic mutation of malignant transformation related genes |
| Annotation of somatic variants for genes involved in malignant transformation |
| Hugo Symbol | Variant Class | Variant Classification | dbSNP RS | HGVSc | HGVSp | HGVSp Short | SWISSPROT | BIOTYPE | SIFT | PolyPhen | Tumor Sample Barcode | Tissue | Histology | Sex | Age | Stage | Therapy Types | Drugs | Outcome |
| SNRNP48 | SNV | Missense_Mutation | c.466N>G | p.Leu156Val | p.L156V | Q6IEG0 | protein_coding | deleterious(0) | probably_damaging(0.991) | TCGA-AO-A0JC-01 | Breast | breast invasive carcinoma | Female | <65 | I/II | Chemotherapy | fluorouracil | SD | |
| SNRNP48 | SNV | Missense_Mutation | c.994N>T | p.His332Tyr | p.H332Y | Q6IEG0 | protein_coding | tolerated_low_confidence(0.07) | benign(0.006) | TCGA-AR-A1AR-01 | Breast | breast invasive carcinoma | Female | <65 | III/IV | Unspecific | Docetaxel | PD | |
| SNRNP48 | SNV | Missense_Mutation | c.640G>A | p.Glu214Lys | p.E214K | Q6IEG0 | protein_coding | deleterious(0) | probably_damaging(0.985) | TCGA-D8-A1JA-01 | Breast | breast invasive carcinoma | Female | <65 | III/IV | Chemotherapy | adriamycin | PD | |
| SNRNP48 | SNV | Missense_Mutation | novel | c.680N>T | p.Ala227Val | p.A227V | Q6IEG0 | protein_coding | deleterious(0) | probably_damaging(0.994) | TCGA-PL-A8LX-01 | Breast | breast invasive carcinoma | Female | <65 | III/IV | Unknown | Unknown | SD |
| SNRNP48 | SNV | Missense_Mutation | rs766355090 | c.605G>A | p.Arg202Gln | p.R202Q | Q6IEG0 | protein_coding | tolerated(1) | benign(0.003) | TCGA-EA-A410-01 | Cervix | cervical & endocervical cancer | Female | <65 | I/II | Unknown | Unknown | SD |
| SNRNP48 | SNV | Missense_Mutation | c.121N>C | p.Asp41His | p.D41H | Q6IEG0 | protein_coding | deleterious(0.01) | benign(0.28) | TCGA-FU-A3HY-01 | Cervix | cervical & endocervical cancer | Female | <65 | I/II | Chemotherapy | cisplatin | CR | |
| SNRNP48 | SNV | Missense_Mutation | rs766355090 | c.605N>A | p.Arg202Gln | p.R202Q | Q6IEG0 | protein_coding | tolerated(1) | benign(0.003) | TCGA-AA-3984-01 | Colorectum | colon adenocarcinoma | Female | <65 | I/II | Unknown | Unknown | SD |
| SNRNP48 | SNV | Missense_Mutation | rs752490463 | c.725N>A | p.Arg242Gln | p.R242Q | Q6IEG0 | protein_coding | deleterious(0) | possibly_damaging(0.886) | TCGA-CA-6717-01 | Colorectum | colon adenocarcinoma | Male | <65 | I/II | Chemotherapy | oxaliplatin | CR |
| SNRNP48 | SNV | Missense_Mutation | novel | c.1014N>C | p.Lys338Asn | p.K338N | Q6IEG0 | protein_coding | deleterious_low_confidence(0.01) | benign(0.261) | TCGA-CA-6717-01 | Colorectum | colon adenocarcinoma | Male | <65 | I/II | Chemotherapy | oxaliplatin | CR |
| SNRNP48 | SNV | Missense_Mutation | c.664C>T | p.Arg222Cys | p.R222C | Q6IEG0 | protein_coding | deleterious(0) | probably_damaging(0.996) | TCGA-CM-6674-01 | Colorectum | colon adenocarcinoma | Male | <65 | I/II | Unknown | Unknown | SD |
| Page: 1 2 3 4 |
Top |
Related drugs of malignant transformation related genes |
| Identification of chemicals and drugs interact with genes involved in malignant transfromation |
| (DGIdb 4.0) |
| Entrez ID | Symbol | Category | Interaction Types | Drug Claim Name | Drug Name | PMIDs |
| Page: 1 |

Copyright 2023-Present -The University of Texas Health Science Center at Houston |