
|
|||||
|
 | |
| |
| |
| |
| |
| |
|
Gene: SMYD2 |
Gene summary for SMYD2 |
| Gene information | Species | Human | Gene symbol | SMYD2 | Gene ID | 56950 |
| Gene name | SET and MYND domain containing 2 | |
| Gene Alias | HSKM-B | |
| Cytomap | 1q32.3 | |
| Gene Type | protein-coding | GO ID | GO:0000122 | UniProtAcc | Q9NRG4 |
Top |
Malignant transformation analysis |
| Identification of the aberrant gene expression in precancerous and cancerous lesions by comparing the gene expression of stem-like cells in diseased tissues with normal stem cells |
| Entrez ID | Symbol | Replicates | Species | Organ | Tissue | Adj P-value | Log2FC | Malignancy |
| 56950 | SMYD2 | P19T-E | Human | Esophagus | ESCC | 1.96e-07 | 9.79e-01 | 0.1662 |
| 56950 | SMYD2 | P20T-E | Human | Esophagus | ESCC | 9.69e-25 | 4.40e-01 | 0.1124 |
| 56950 | SMYD2 | P21T-E | Human | Esophagus | ESCC | 6.19e-36 | 7.94e-01 | 0.1617 |
| 56950 | SMYD2 | P22T-E | Human | Esophagus | ESCC | 3.18e-18 | 4.23e-01 | 0.1236 |
| 56950 | SMYD2 | P23T-E | Human | Esophagus | ESCC | 2.49e-30 | 7.18e-01 | 0.108 |
| 56950 | SMYD2 | P24T-E | Human | Esophagus | ESCC | 2.34e-14 | 3.92e-01 | 0.1287 |
| 56950 | SMYD2 | P26T-E | Human | Esophagus | ESCC | 2.61e-42 | 6.63e-01 | 0.1276 |
| 56950 | SMYD2 | P27T-E | Human | Esophagus | ESCC | 4.99e-22 | 3.11e-01 | 0.1055 |
| 56950 | SMYD2 | P28T-E | Human | Esophagus | ESCC | 6.84e-21 | 4.79e-01 | 0.1149 |
| 56950 | SMYD2 | P30T-E | Human | Esophagus | ESCC | 1.72e-24 | 8.71e-01 | 0.137 |
| 56950 | SMYD2 | P31T-E | Human | Esophagus | ESCC | 6.59e-29 | 4.88e-01 | 0.1251 |
| 56950 | SMYD2 | P32T-E | Human | Esophagus | ESCC | 1.41e-39 | 8.48e-01 | 0.1666 |
| 56950 | SMYD2 | P36T-E | Human | Esophagus | ESCC | 1.63e-15 | 4.15e-01 | 0.1187 |
| 56950 | SMYD2 | P37T-E | Human | Esophagus | ESCC | 6.57e-32 | 7.67e-01 | 0.1371 |
| 56950 | SMYD2 | P38T-E | Human | Esophagus | ESCC | 6.28e-09 | 4.59e-01 | 0.127 |
| 56950 | SMYD2 | P39T-E | Human | Esophagus | ESCC | 1.52e-09 | 1.55e-01 | 0.0894 |
| 56950 | SMYD2 | P40T-E | Human | Esophagus | ESCC | 7.24e-15 | 4.01e-01 | 0.109 |
| 56950 | SMYD2 | P42T-E | Human | Esophagus | ESCC | 1.49e-11 | 3.80e-01 | 0.1175 |
| 56950 | SMYD2 | P44T-E | Human | Esophagus | ESCC | 1.58e-15 | 3.27e-01 | 0.1096 |
| 56950 | SMYD2 | P47T-E | Human | Esophagus | ESCC | 4.99e-12 | 2.74e-01 | 0.1067 |
| Page: 1 2 3 4 5 6 |
| Tissue | Expression Dynamics | Abbreviation |
| Esophagus | 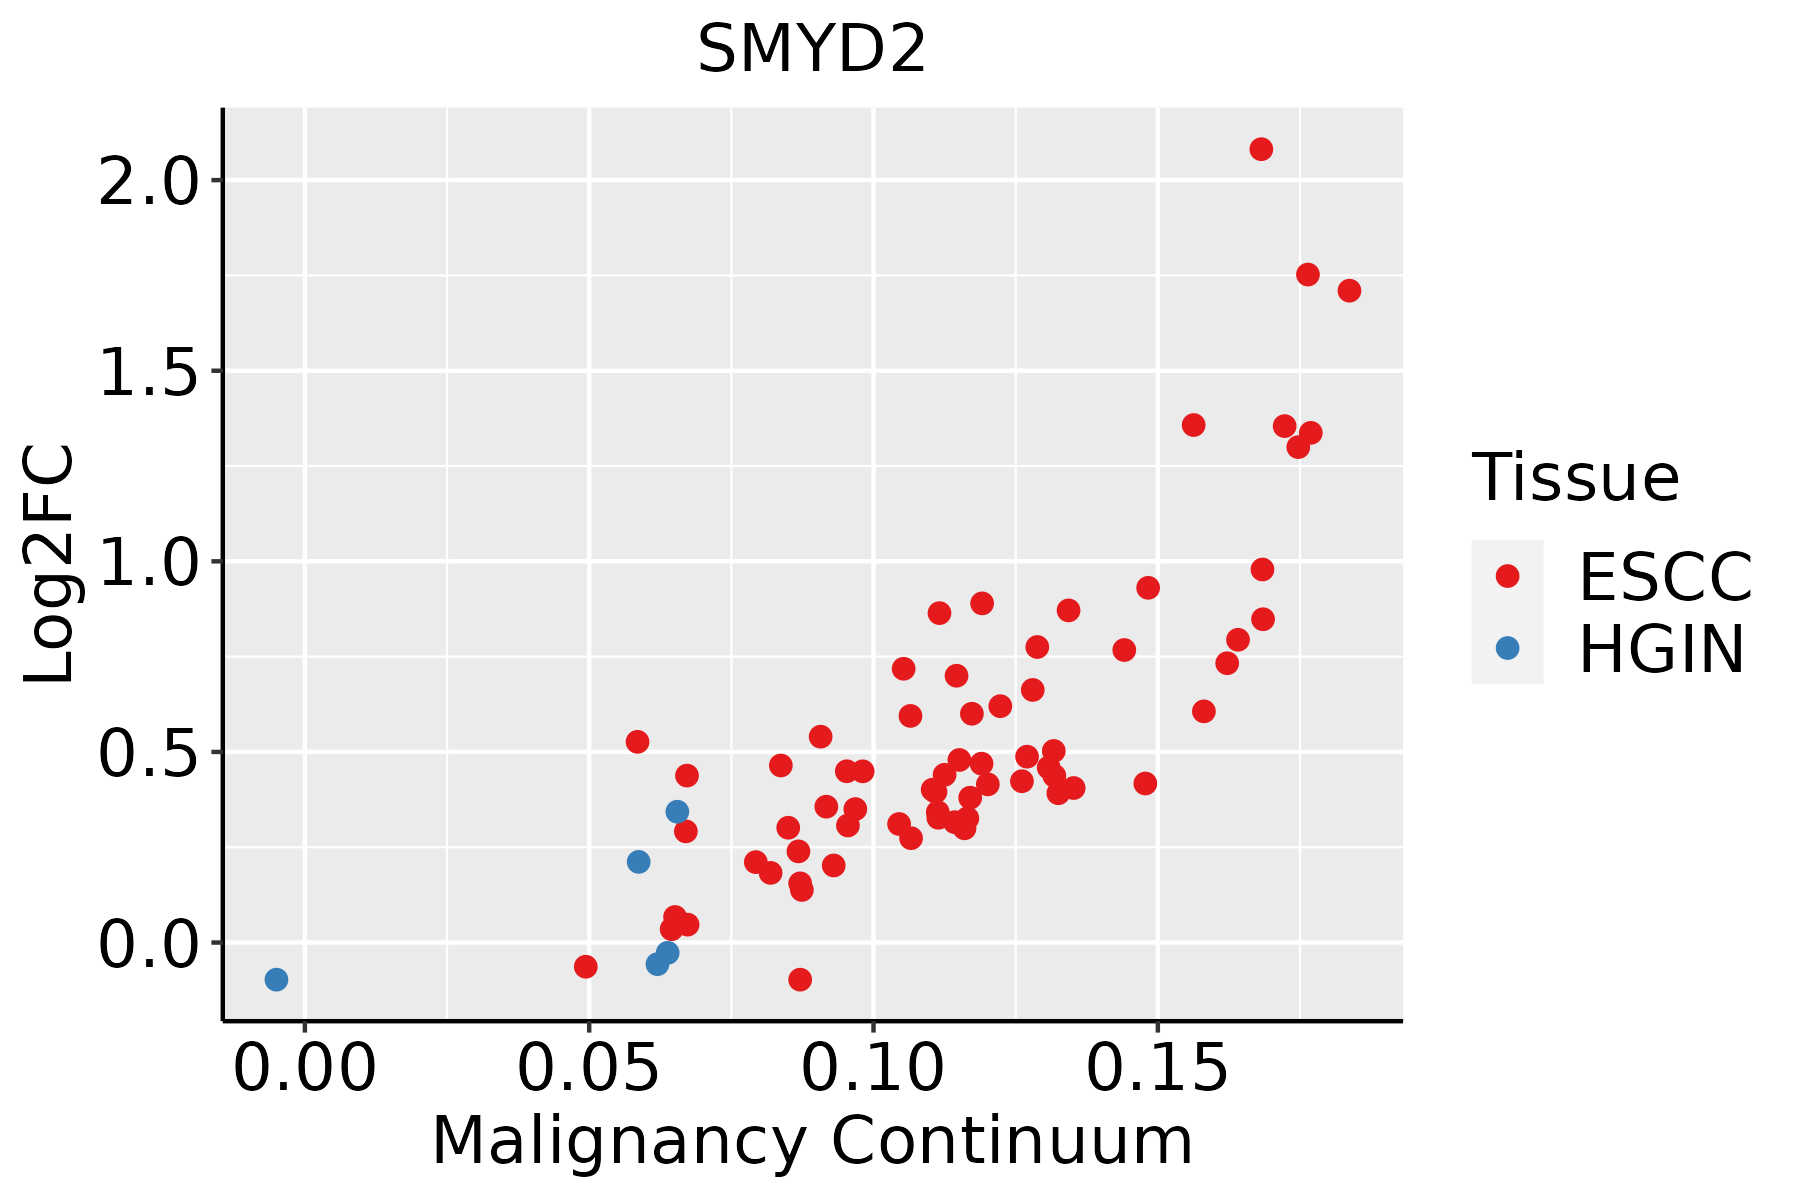 | ESCC: Esophageal squamous cell carcinoma |
| HGIN: High-grade intraepithelial neoplasias | ||
| LGIN: Low-grade intraepithelial neoplasias | ||
| Liver |  | HCC: Hepatocellular carcinoma |
| NAFLD: Non-alcoholic fatty liver disease | ||
| Oral Cavity | 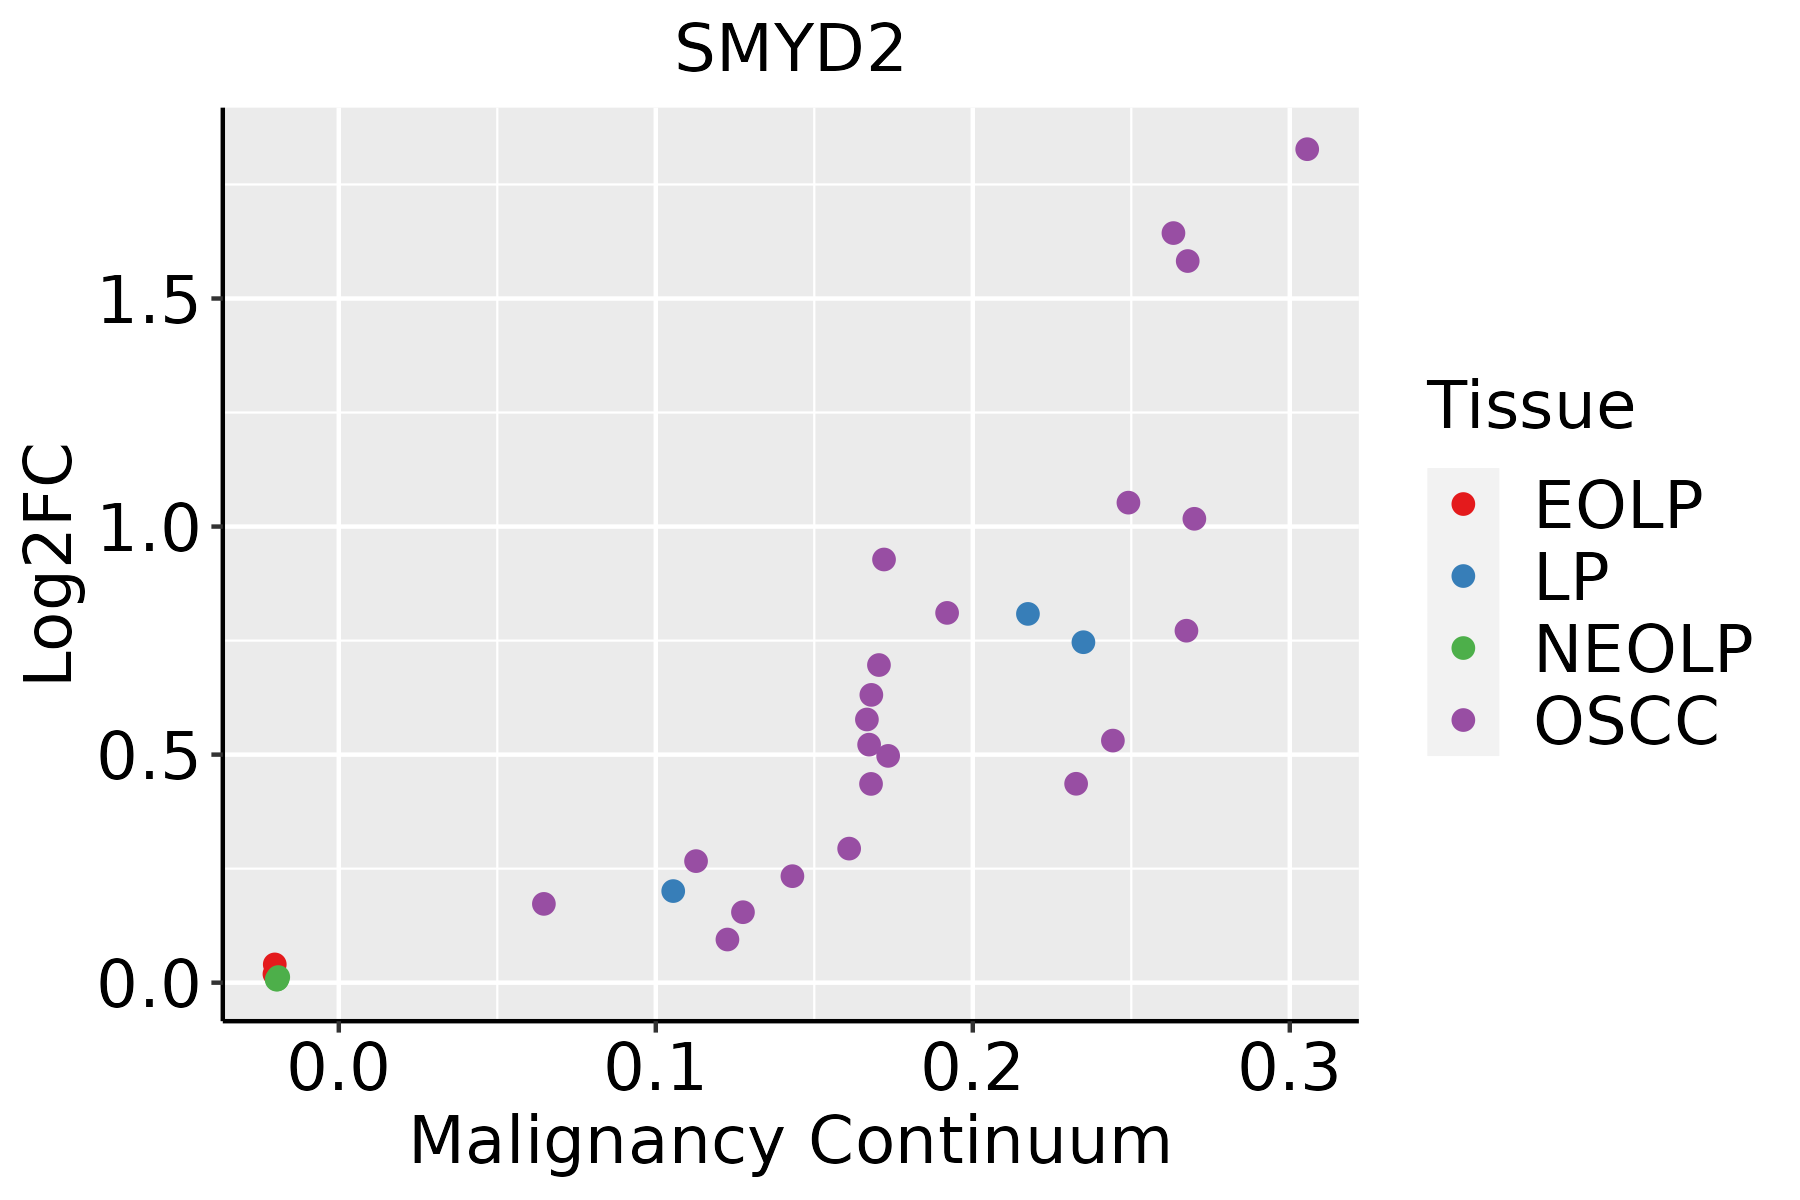 | EOLP: Erosive Oral lichen planus |
| LP: leukoplakia | ||
| NEOLP: Non-erosive oral lichen planus | ||
| OSCC: Oral squamous cell carcinoma | ||
| Skin |  | AK: Actinic keratosis |
| cSCC: Cutaneous squamous cell carcinoma | ||
| SCCIS:squamous cell carcinoma in situ |
| ∗log2FC in expression of this searched gene in stem-like cells from each diseased tissue sample relative to stem-like cells in normal samples in each tissue plotted against the malignancy continuum. Samples are colored based on if they are from different disease stage. |
Top |
Malignant transformation related pathway analysis |
| Find out the enriched GO biological processes and KEGG pathways involved in transition from healthy to precancer to cancer |
| Tissue | Disease Stage | Enriched GO biological Processes |
| Colorectum | AD |  |
| Colorectum | SER |  |
| Colorectum | MSS |  |
| Colorectum | MSI-H |  |
| Colorectum | FAP |  |
| ∗Top 15 enriched GO BP terms are showed in the bar plot of each disease state in each tissue. Each row represents a significant GO biological process which is colored according to the -log10(p.adjust). |
| Page: 1 2 3 4 5 6 7 8 9 |
| GO ID | Tissue | Disease Stage | Description | Gene Ratio | Bg Ratio | pvalue | p.adjust | Count |
| GO:007233127 | Esophagus | HGIN | signal transduction by p53 class mediator | 49/2587 | 163/18723 | 5.71e-08 | 3.06e-06 | 49 |
| GO:00182057 | Esophagus | HGIN | peptidyl-lysine modification | 88/2587 | 376/18723 | 2.99e-07 | 1.39e-05 | 88 |
| GO:003033020 | Esophagus | HGIN | DNA damage response, signal transduction by p53 class mediator | 24/2587 | 72/18723 | 2.03e-05 | 5.43e-04 | 24 |
| GO:200102019 | Esophagus | HGIN | regulation of response to DNA damage stimulus | 52/2587 | 219/18723 | 5.00e-05 | 1.19e-03 | 52 |
| GO:00165708 | Esophagus | HGIN | histone modification | 92/2587 | 463/18723 | 1.70e-04 | 3.30e-03 | 92 |
| GO:190179627 | Esophagus | HGIN | regulation of signal transduction by p53 class mediator | 26/2587 | 93/18723 | 2.60e-04 | 4.55e-03 | 26 |
| GO:00427708 | Esophagus | HGIN | signal transduction in response to DNA damage | 39/2587 | 172/18723 | 1.07e-03 | 1.32e-02 | 39 |
| GO:0018027 | Esophagus | HGIN | peptidyl-lysine dimethylation | 10/2587 | 26/18723 | 1.60e-03 | 1.79e-02 | 10 |
| GO:00349688 | Esophagus | HGIN | histone lysine methylation | 27/2587 | 115/18723 | 3.51e-03 | 3.24e-02 | 27 |
| GO:00435168 | Esophagus | HGIN | regulation of DNA damage response, signal transduction by p53 class mediator | 11/2587 | 34/18723 | 4.61e-03 | 3.96e-02 | 11 |
| GO:00064798 | Esophagus | HGIN | protein methylation | 38/2587 | 181/18723 | 5.05e-03 | 4.22e-02 | 38 |
| GO:00082138 | Esophagus | HGIN | protein alkylation | 38/2587 | 181/18723 | 5.05e-03 | 4.22e-02 | 38 |
| GO:00180227 | Esophagus | HGIN | peptidyl-lysine methylation | 29/2587 | 131/18723 | 6.22e-03 | 4.95e-02 | 29 |
| GO:001657015 | Esophagus | ESCC | histone modification | 323/8552 | 463/18723 | 2.61e-26 | 7.88e-24 | 323 |
| GO:001820514 | Esophagus | ESCC | peptidyl-lysine modification | 259/8552 | 376/18723 | 3.90e-20 | 5.26e-18 | 259 |
| GO:0072331111 | Esophagus | ESCC | signal transduction by p53 class mediator | 121/8552 | 163/18723 | 9.61e-14 | 4.69e-12 | 121 |
| GO:00434143 | Esophagus | ESCC | macromolecule methylation | 199/8552 | 316/18723 | 3.44e-10 | 9.57e-09 | 199 |
| GO:2001020110 | Esophagus | ESCC | regulation of response to DNA damage stimulus | 145/8552 | 219/18723 | 5.97e-10 | 1.50e-08 | 145 |
| GO:00322592 | Esophagus | ESCC | methylation | 222/8552 | 364/18723 | 2.26e-09 | 5.09e-08 | 222 |
| GO:004277014 | Esophagus | ESCC | signal transduction in response to DNA damage | 117/8552 | 172/18723 | 2.38e-09 | 5.32e-08 | 117 |
| Page: 1 2 3 4 5 |
| Pathway ID | Tissue | Disease Stage | Description | Gene Ratio | Bg Ratio | pvalue | p.adjust | qvalue | Count |
| hsa0031010 | Esophagus | ESCC | Lysine degradation | 41/4205 | 63/8465 | 9.63e-03 | 2.27e-02 | 1.16e-02 | 41 |
| hsa0031013 | Esophagus | ESCC | Lysine degradation | 41/4205 | 63/8465 | 9.63e-03 | 2.27e-02 | 1.16e-02 | 41 |
| hsa0031021 | Liver | Cirrhotic | Lysine degradation | 29/2530 | 63/8465 | 4.81e-03 | 1.74e-02 | 1.07e-02 | 29 |
| hsa0031031 | Liver | Cirrhotic | Lysine degradation | 29/2530 | 63/8465 | 4.81e-03 | 1.74e-02 | 1.07e-02 | 29 |
| hsa0031041 | Liver | HCC | Lysine degradation | 47/4020 | 63/8465 | 1.02e-05 | 7.58e-05 | 4.22e-05 | 47 |
| hsa0031051 | Liver | HCC | Lysine degradation | 47/4020 | 63/8465 | 1.02e-05 | 7.58e-05 | 4.22e-05 | 47 |
| Page: 1 |
Top |
Cell-cell communication analysis |
| Identification of potential cell-cell interactions between two cell types and their ligand-receptor pairs for different disease states |
| Ligand | Receptor | LRpair | Pathway | Tissue | Disease Stage |
| Page: 1 |
Top |
Single-cell gene regulatory network inference analysis |
| Find out the significant the regulons (TFs) and the target genes of each regulon across cell types for different disease states |
| TF | Cell Type | Tissue | Disease Stage | Target Gene | RSS | Regulon Activity |
| ∗The dot plots of a searched regulon are shown for all cell subpopulations in each disease state of each tissue based on the regulon specific score inferred using pySCENIC and by calculating the average expression. |
| Page: 1 |
Top |
Somatic mutation of malignant transformation related genes |
| Annotation of somatic variants for genes involved in malignant transformation |
| Hugo Symbol | Variant Class | Variant Classification | dbSNP RS | HGVSc | HGVSp | HGVSp Short | SWISSPROT | BIOTYPE | SIFT | PolyPhen | Tumor Sample Barcode | Tissue | Histology | Sex | Age | Stage | Therapy Types | Drugs | Outcome |
| SMYD2 | SNV | Missense_Mutation | novel | c.766G>A | p.Asp256Asn | p.D256N | Q9NRG4 | protein_coding | tolerated(0.09) | possibly_damaging(0.798) | TCGA-AN-A046-01 | Breast | breast invasive carcinoma | Female | >=65 | I/II | Unknown | Unknown | SD |
| SMYD2 | SNV | Missense_Mutation | c.559G>A | p.Glu187Lys | p.E187K | Q9NRG4 | protein_coding | tolerated(0.12) | probably_damaging(0.998) | TCGA-D8-A1JJ-01 | Breast | breast invasive carcinoma | Female | <65 | I/II | Chemotherapy | doxorubicine | SD | |
| SMYD2 | insertion | Nonsense_Mutation | novel | c.588_589insGAGTCAGAAGCTGTCTGTCCCTAGATCAGTTTTGAAAAGTGTT | p.Ala197GlufsTer8 | p.A197Efs*8 | Q9NRG4 | protein_coding | TCGA-A8-A09D-01 | Breast | breast invasive carcinoma | Female | <65 | I/II | Chemotherapy | doxorubicin | CR | ||
| SMYD2 | SNV | Missense_Mutation | novel | c.409C>T | p.His137Tyr | p.H137Y | Q9NRG4 | protein_coding | deleterious(0) | probably_damaging(0.986) | TCGA-2W-A8YY-01 | Cervix | cervical & endocervical cancer | Female | <65 | I/II | Chemotherapy | cisplatin | CR |
| SMYD2 | SNV | Missense_Mutation | rs369877948 | c.517N>A | p.Val173Ile | p.V173I | Q9NRG4 | protein_coding | tolerated(0.28) | benign(0.001) | TCGA-CK-6746-01 | Colorectum | colon adenocarcinoma | Female | >=65 | I/II | Unknown | Unknown | SD |
| SMYD2 | deletion | Frame_Shift_Del | c.67delG | p.Ala23LeufsTer84 | p.A23Lfs*84 | Q9NRG4 | protein_coding | TCGA-CM-5861-01 | Colorectum | colon adenocarcinoma | Female | <65 | I/II | Unknown | Unknown | PD | |||
| SMYD2 | insertion | Frame_Shift_Ins | novel | c.283_284insT | p.Gly97TrpfsTer39 | p.G97Wfs*39 | Q9NRG4 | protein_coding | TCGA-G4-6320-01 | Colorectum | colon adenocarcinoma | Male | >=65 | III/IV | Chemotherapy | oxaliplatin | SD | ||
| SMYD2 | SNV | Missense_Mutation | rs372313690 | c.740C>T | p.Thr247Met | p.T247M | Q9NRG4 | protein_coding | deleterious(0) | probably_damaging(0.998) | TCGA-A5-A1OF-01 | Endometrium | uterine corpus endometrioid carcinoma | Female | <65 | I/II | Unknown | Unknown | SD |
| SMYD2 | SNV | Missense_Mutation | rs369082796 | c.493G>A | p.Gly165Arg | p.G165R | Q9NRG4 | protein_coding | tolerated(0.19) | benign(0.038) | TCGA-AP-A051-01 | Endometrium | uterine corpus endometrioid carcinoma | Female | >=65 | I/II | Unknown | Unknown | SD |
| SMYD2 | SNV | Missense_Mutation | c.378A>T | p.Glu126Asp | p.E126D | Q9NRG4 | protein_coding | deleterious(0.01) | possibly_damaging(0.872) | TCGA-AP-A056-01 | Endometrium | uterine corpus endometrioid carcinoma | Female | <65 | I/II | Unknown | Unknown | SD |
| Page: 1 2 3 4 |
Top |
Related drugs of malignant transformation related genes |
| Identification of chemicals and drugs interact with genes involved in malignant transfromation |
| (DGIdb 4.0) |
| Entrez ID | Symbol | Category | Interaction Types | Drug Claim Name | Drug Name | PMIDs |
| 56950 | SMYD2 | ENZYME, METHYL TRANSFERASE | inhibitor | 178103600 | ||
| 56950 | SMYD2 | ENZYME, METHYL TRANSFERASE | inhibitor | 249565919 | ||
| 56950 | SMYD2 | ENZYME, METHYL TRANSFERASE | inhibitor | 310264734 |
| Page: 1 |

Copyright 2023-Present -The University of Texas Health Science Center at Houston |