
|
|||||
|
 | |
| |
| |
| |
| |
| |
|
Gene: SMARCD3 |
Gene summary for SMARCD3 |
| Gene information | Species | Human | Gene symbol | SMARCD3 | Gene ID | 6604 |
| Gene name | SWI/SNF related, matrix associated, actin dependent regulator of chromatin, subfamily d, member 3 | |
| Gene Alias | BAF60C | |
| Cytomap | 7q36.1 | |
| Gene Type | protein-coding | GO ID | GO:0000086 | UniProtAcc | Q6STE5 |
Top |
Malignant transformation analysis |
| Identification of the aberrant gene expression in precancerous and cancerous lesions by comparing the gene expression of stem-like cells in diseased tissues with normal stem cells |
| Entrez ID | Symbol | Replicates | Species | Organ | Tissue | Adj P-value | Log2FC | Malignancy |
| 6604 | SMARCD3 | P61T-E | Human | Esophagus | ESCC | 7.66e-12 | 3.25e-01 | 0.099 |
| 6604 | SMARCD3 | P65T-E | Human | Esophagus | ESCC | 5.72e-08 | 2.01e-01 | 0.0978 |
| 6604 | SMARCD3 | P74T-E | Human | Esophagus | ESCC | 1.26e-18 | 5.16e-01 | 0.1479 |
| 6604 | SMARCD3 | P79T-E | Human | Esophagus | ESCC | 3.97e-04 | 9.07e-02 | 0.1154 |
| 6604 | SMARCD3 | P83T-E | Human | Esophagus | ESCC | 2.39e-08 | 1.69e-01 | 0.1738 |
| 6604 | SMARCD3 | HCC1_Meng | Human | Liver | HCC | 8.18e-06 | -1.43e-02 | 0.0246 |
| 6604 | SMARCD3 | cirrhotic2 | Human | Liver | Cirrhotic | 4.73e-03 | 1.11e-01 | 0.0201 |
| 6604 | SMARCD3 | cirrhotic3 | Human | Liver | Cirrhotic | 7.59e-03 | 1.47e-01 | 0.0215 |
| 6604 | SMARCD3 | HCC2 | Human | Liver | HCC | 1.14e-11 | 2.91e+00 | 0.5341 |
| 6604 | SMARCD3 | S027 | Human | Liver | HCC | 4.62e-12 | 7.32e-01 | 0.2446 |
| 6604 | SMARCD3 | S028 | Human | Liver | HCC | 2.18e-22 | 7.86e-01 | 0.2503 |
| 6604 | SMARCD3 | S029 | Human | Liver | HCC | 1.74e-20 | 7.43e-01 | 0.2581 |
| 6604 | SMARCD3 | male-WTA | Human | Thyroid | PTC | 2.76e-10 | 1.19e-01 | 0.1037 |
| 6604 | SMARCD3 | PTC01 | Human | Thyroid | PTC | 2.63e-09 | 1.99e-01 | 0.1899 |
| 6604 | SMARCD3 | PTC05 | Human | Thyroid | PTC | 4.00e-06 | 2.53e-01 | 0.2065 |
| 6604 | SMARCD3 | PTC06 | Human | Thyroid | PTC | 5.09e-18 | 3.51e-01 | 0.2057 |
| 6604 | SMARCD3 | PTC07 | Human | Thyroid | PTC | 7.84e-13 | 2.30e-01 | 0.2044 |
| 6604 | SMARCD3 | ATC12 | Human | Thyroid | ATC | 2.47e-07 | 1.87e-01 | 0.34 |
| 6604 | SMARCD3 | ATC13 | Human | Thyroid | ATC | 2.51e-26 | 5.14e-01 | 0.34 |
| 6604 | SMARCD3 | ATC2 | Human | Thyroid | ATC | 5.75e-11 | 1.11e+00 | 0.34 |
| Page: 1 2 3 |
| Tissue | Expression Dynamics | Abbreviation |
| Esophagus | 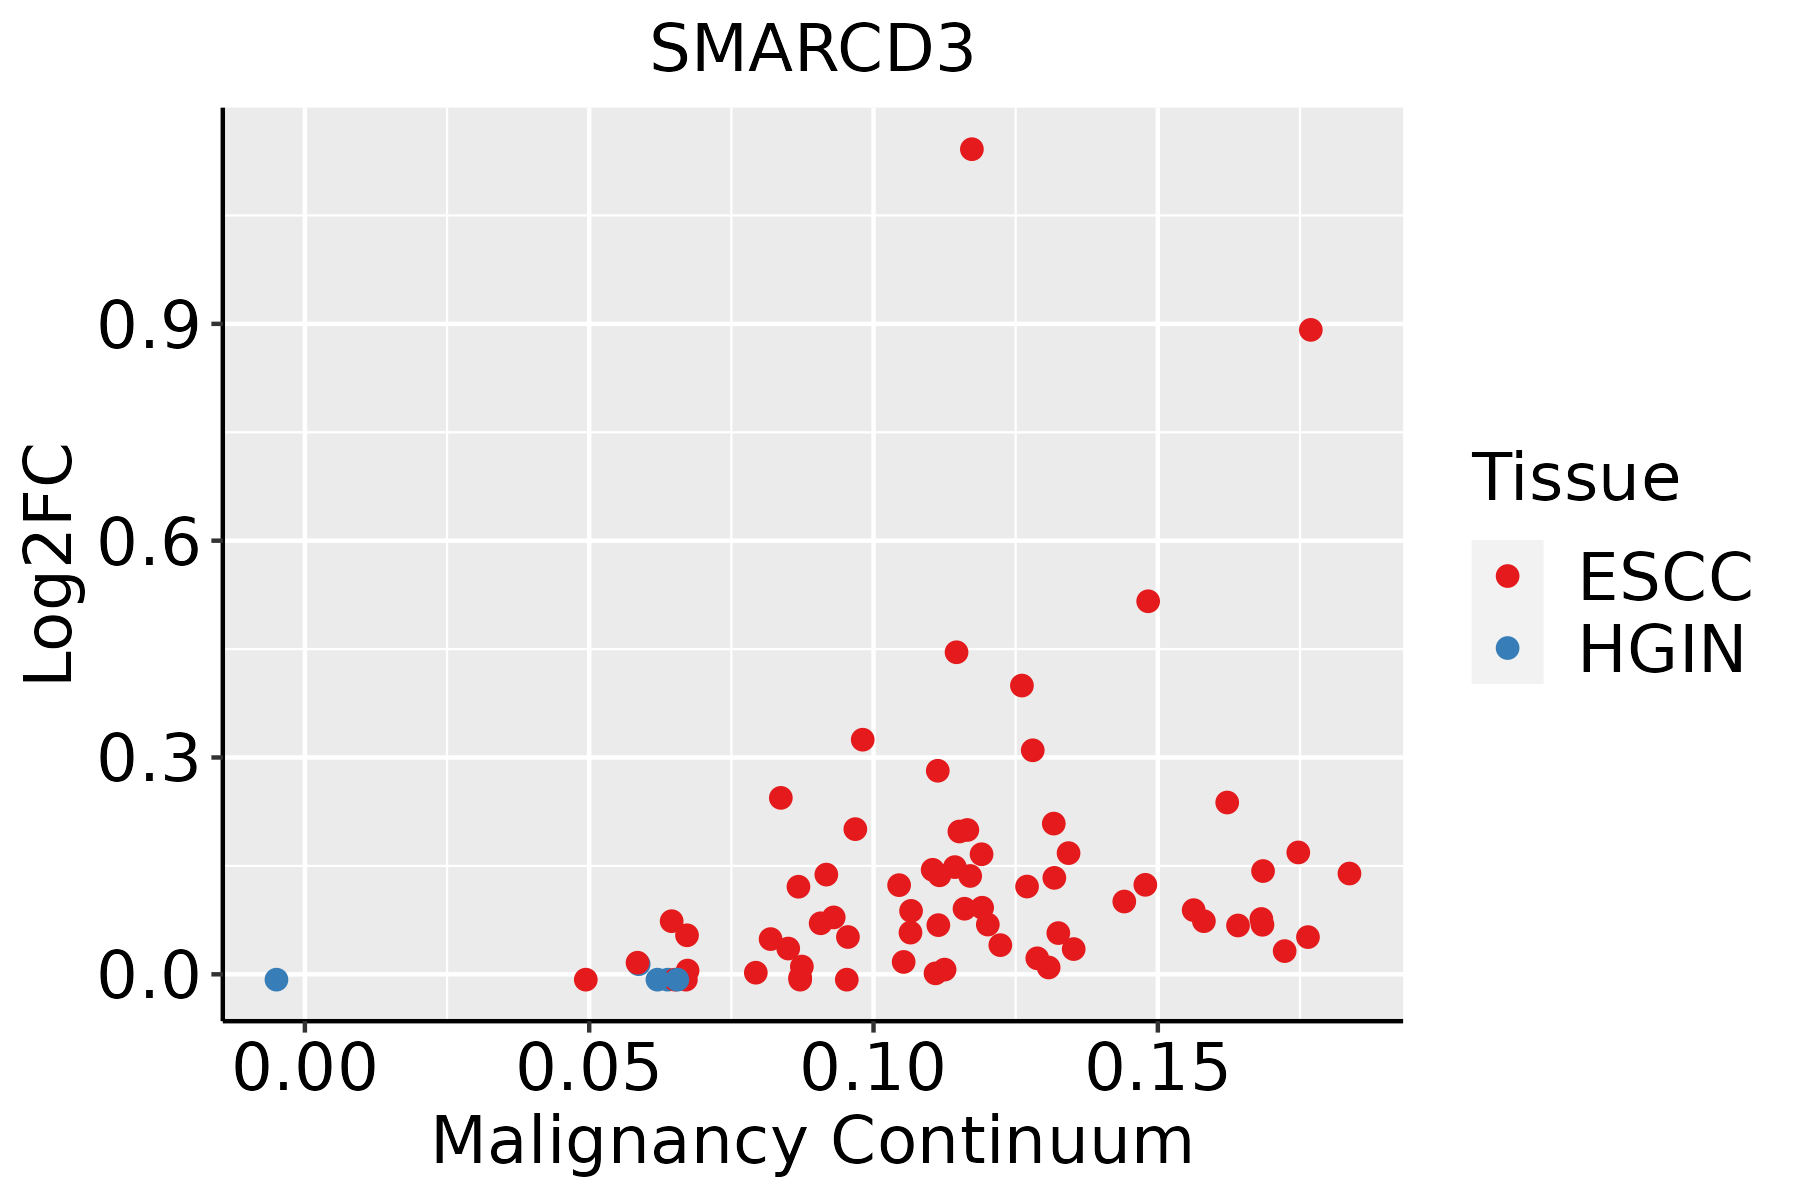 | ESCC: Esophageal squamous cell carcinoma |
| HGIN: High-grade intraepithelial neoplasias | ||
| LGIN: Low-grade intraepithelial neoplasias | ||
| Liver |  | HCC: Hepatocellular carcinoma |
| NAFLD: Non-alcoholic fatty liver disease | ||
| Thyroid | 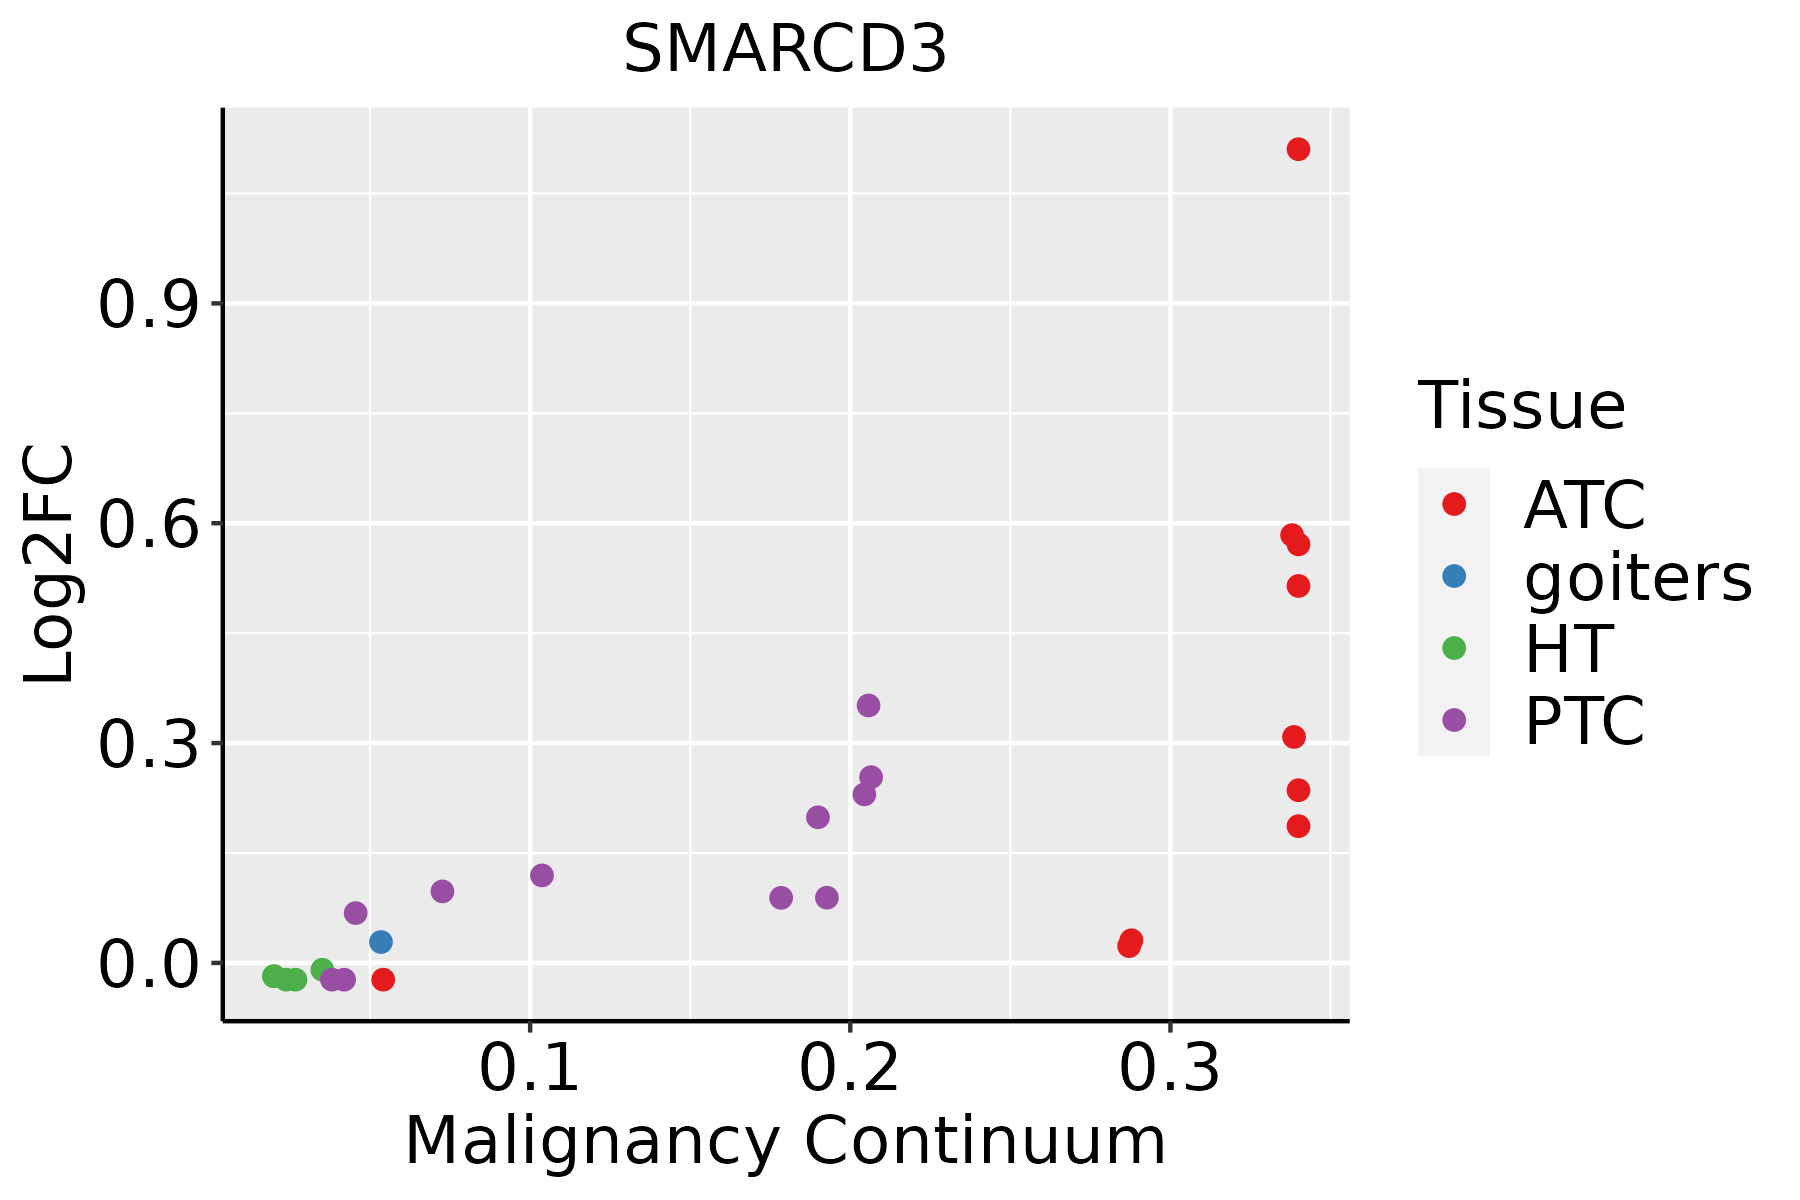 | ATC: Anaplastic thyroid cancer |
| HT: Hashimoto's thyroiditis | ||
| PTC: Papillary thyroid cancer |
| ∗log2FC in expression of this searched gene in stem-like cells from each diseased tissue sample relative to stem-like cells in normal samples in each tissue plotted against the malignancy continuum. Samples are colored based on if they are from different disease stage. |
Top |
Malignant transformation related pathway analysis |
| Find out the enriched GO biological processes and KEGG pathways involved in transition from healthy to precancer to cancer |
| Tissue | Disease Stage | Enriched GO biological Processes |
| Colorectum | AD |  |
| Colorectum | SER |  |
| Colorectum | MSS |  |
| Colorectum | MSI-H |  |
| Colorectum | FAP |  |
| ∗Top 15 enriched GO BP terms are showed in the bar plot of each disease state in each tissue. Each row represents a significant GO biological process which is colored according to the -log10(p.adjust). |
| Page: 1 2 3 4 5 6 7 8 9 |
| GO ID | Tissue | Disease Stage | Description | Gene Ratio | Bg Ratio | pvalue | p.adjust | Count |
| GO:0022411111 | Esophagus | ESCC | cellular component disassembly | 305/8552 | 443/18723 | 1.94e-23 | 4.57e-21 | 305 |
| GO:0051098111 | Esophagus | ESCC | regulation of binding | 251/8552 | 363/18723 | 6.73e-20 | 8.46e-18 | 251 |
| GO:004477216 | Esophagus | ESCC | mitotic cell cycle phase transition | 281/8552 | 424/18723 | 4.63e-18 | 4.45e-16 | 281 |
| GO:000734615 | Esophagus | ESCC | regulation of mitotic cell cycle | 293/8552 | 457/18723 | 8.00e-16 | 5.64e-14 | 293 |
| GO:003298416 | Esophagus | ESCC | protein-containing complex disassembly | 151/8552 | 224/18723 | 3.45e-11 | 1.15e-09 | 151 |
| GO:004339320 | Esophagus | ESCC | regulation of protein binding | 135/8552 | 196/18723 | 3.69e-11 | 1.22e-09 | 135 |
| GO:190198713 | Esophagus | ESCC | regulation of cell cycle phase transition | 242/8552 | 390/18723 | 3.86e-11 | 1.26e-09 | 242 |
| GO:190199013 | Esophagus | ESCC | regulation of mitotic cell cycle phase transition | 191/8552 | 299/18723 | 1.35e-10 | 3.94e-09 | 191 |
| GO:004578710 | Esophagus | ESCC | positive regulation of cell cycle | 196/8552 | 313/18723 | 9.27e-10 | 2.24e-08 | 196 |
| GO:00448394 | Esophagus | ESCC | cell cycle G2/M phase transition | 103/8552 | 148/18723 | 3.09e-09 | 6.67e-08 | 103 |
| GO:00000864 | Esophagus | ESCC | G2/M transition of mitotic cell cycle | 96/8552 | 137/18723 | 6.00e-09 | 1.23e-07 | 96 |
| GO:000632517 | Esophagus | ESCC | chromatin organization | 240/8552 | 409/18723 | 6.52e-08 | 1.14e-06 | 240 |
| GO:004593116 | Esophagus | ESCC | positive regulation of mitotic cell cycle | 83/8552 | 121/18723 | 2.78e-07 | 4.08e-06 | 83 |
| GO:19019896 | Esophagus | ESCC | positive regulation of cell cycle phase transition | 77/8552 | 115/18723 | 3.20e-06 | 3.58e-05 | 77 |
| GO:00900689 | Esophagus | ESCC | positive regulation of cell cycle process | 142/8552 | 236/18723 | 4.79e-06 | 5.08e-05 | 142 |
| GO:00103891 | Esophagus | ESCC | regulation of G2/M transition of mitotic cell cycle | 64/8552 | 94/18723 | 9.21e-06 | 8.82e-05 | 64 |
| GO:19027491 | Esophagus | ESCC | regulation of cell cycle G2/M phase transition | 68/8552 | 102/18723 | 1.48e-05 | 1.33e-04 | 68 |
| GO:001072010 | Esophagus | ESCC | positive regulation of cell development | 172/8552 | 298/18723 | 1.74e-05 | 1.55e-04 | 172 |
| GO:19019925 | Esophagus | ESCC | positive regulation of mitotic cell cycle phase transition | 62/8552 | 93/18723 | 3.47e-05 | 2.83e-04 | 62 |
| GO:005076710 | Esophagus | ESCC | regulation of neurogenesis | 203/8552 | 364/18723 | 6.10e-05 | 4.68e-04 | 203 |
| Page: 1 2 3 4 5 6 7 |
| Pathway ID | Tissue | Disease Stage | Description | Gene Ratio | Bg Ratio | pvalue | p.adjust | qvalue | Count |
| hsa0522518 | Esophagus | ESCC | Hepatocellular carcinoma | 109/4205 | 168/8465 | 4.27e-05 | 1.88e-04 | 9.64e-05 | 109 |
| hsa0522519 | Esophagus | ESCC | Hepatocellular carcinoma | 109/4205 | 168/8465 | 4.27e-05 | 1.88e-04 | 9.64e-05 | 109 |
| hsa0471414 | Liver | Cirrhotic | Thermogenesis | 121/2530 | 232/8465 | 5.70e-13 | 1.36e-11 | 8.36e-12 | 121 |
| hsa0471415 | Liver | Cirrhotic | Thermogenesis | 121/2530 | 232/8465 | 5.70e-13 | 1.36e-11 | 8.36e-12 | 121 |
| hsa0471422 | Liver | HCC | Thermogenesis | 170/4020 | 232/8465 | 5.36e-16 | 2.25e-14 | 1.25e-14 | 170 |
| hsa052258 | Liver | HCC | Hepatocellular carcinoma | 106/4020 | 168/8465 | 2.87e-05 | 1.85e-04 | 1.03e-04 | 106 |
| hsa0471432 | Liver | HCC | Thermogenesis | 170/4020 | 232/8465 | 5.36e-16 | 2.25e-14 | 1.25e-14 | 170 |
| hsa0522511 | Liver | HCC | Hepatocellular carcinoma | 106/4020 | 168/8465 | 2.87e-05 | 1.85e-04 | 1.03e-04 | 106 |
| Page: 1 |
Top |
Cell-cell communication analysis |
| Identification of potential cell-cell interactions between two cell types and their ligand-receptor pairs for different disease states |
| Ligand | Receptor | LRpair | Pathway | Tissue | Disease Stage |
| Page: 1 |
Top |
Single-cell gene regulatory network inference analysis |
| Find out the significant the regulons (TFs) and the target genes of each regulon across cell types for different disease states |
| TF | Cell Type | Tissue | Disease Stage | Target Gene | RSS | Regulon Activity |
| ∗The dot plots of a searched regulon are shown for all cell subpopulations in each disease state of each tissue based on the regulon specific score inferred using pySCENIC and by calculating the average expression. |
| Page: 1 |
Top |
Somatic mutation of malignant transformation related genes |
| Annotation of somatic variants for genes involved in malignant transformation |
| Hugo Symbol | Variant Class | Variant Classification | dbSNP RS | HGVSc | HGVSp | HGVSp Short | SWISSPROT | BIOTYPE | SIFT | PolyPhen | Tumor Sample Barcode | Tissue | Histology | Sex | Age | Stage | Therapy Types | Drugs | Outcome |
| SMARCD3 | SNV | Missense_Mutation | rs374935911 | c.746G>A | p.Arg249His | p.R249H | Q6STE5 | protein_coding | tolerated(0.11) | possibly_damaging(0.608) | TCGA-A2-A3XZ-01 | Breast | breast invasive carcinoma | Female | <65 | I/II | Chemotherapy | carboplatin | CR |
| SMARCD3 | SNV | Missense_Mutation | c.971A>G | p.Glu324Gly | p.E324G | Q6STE5 | protein_coding | deleterious(0) | possibly_damaging(0.593) | TCGA-BH-A18U-01 | Breast | breast invasive carcinoma | Female | >=65 | III/IV | Unknown | Unknown | SD | |
| SMARCD3 | SNV | Missense_Mutation | rs758051223 | c.946G>T | p.Asp316Tyr | p.D316Y | Q6STE5 | protein_coding | deleterious(0.01) | possibly_damaging(0.793) | TCGA-D8-A1J8-01 | Breast | breast invasive carcinoma | Female | >=65 | I/II | Hormone Therapy | nolvadex | SD |
| SMARCD3 | SNV | Missense_Mutation | c.1169N>A | p.Ser390Asn | p.S390N | Q6STE5 | protein_coding | tolerated(1) | benign(0) | TCGA-E2-A1B0-01 | Breast | breast invasive carcinoma | Female | <65 | III/IV | Chemotherapy | cytoxan | SD | |
| SMARCD3 | insertion | Frame_Shift_Ins | novel | c.413_414insTCCCTGTTGCTCTCCCACAGCCCAGCAAACA | p.Lys139ProfsTer38 | p.K139Pfs*38 | Q6STE5 | protein_coding | TCGA-BH-A0DS-01 | Breast | breast invasive carcinoma | Female | >=65 | III/IV | Chemotherapy | cyclophosphamide | SD | ||
| SMARCD3 | deletion | Frame_Shift_Del | novel | c.1281delN | p.Ser428AlafsTer6 | p.S428Afs*6 | Q6STE5 | protein_coding | TCGA-EW-A2FV-01 | Breast | breast invasive carcinoma | Female | <65 | III/IV | Chemotherapy | docetaxel | SD | ||
| SMARCD3 | SNV | Missense_Mutation | novel | c.397G>A | p.Asp133Asn | p.D133N | Q6STE5 | protein_coding | deleterious(0) | probably_damaging(1) | TCGA-2W-A8YY-01 | Cervix | cervical & endocervical cancer | Female | <65 | I/II | Chemotherapy | cisplatin | CR |
| SMARCD3 | SNV | Missense_Mutation | c.1035C>G | p.Ile345Met | p.I345M | Q6STE5 | protein_coding | deleterious(0.02) | probably_damaging(0.929) | TCGA-C5-A1MH-01 | Cervix | cervical & endocervical cancer | Female | >=65 | III/IV | Chemotherapy | cisplatin | PD | |
| SMARCD3 | SNV | Missense_Mutation | c.779C>T | p.Pro260Leu | p.P260L | Q6STE5 | protein_coding | deleterious(0) | probably_damaging(0.998) | TCGA-A6-6648-01 | Colorectum | colon adenocarcinoma | Male | <65 | I/II | Chemotherapy | oxaliplatin | PD | |
| SMARCD3 | SNV | Missense_Mutation | c.709G>A | p.Gly237Ser | p.G237S | Q6STE5 | protein_coding | deleterious(0) | probably_damaging(1) | TCGA-AA-3710-01 | Colorectum | colon adenocarcinoma | Female | >=65 | I/II | Unknown | Unknown | SD |
| Page: 1 2 3 4 5 6 |
Top |
Related drugs of malignant transformation related genes |
| Identification of chemicals and drugs interact with genes involved in malignant transfromation |
| (DGIdb 4.0) |
| Entrez ID | Symbol | Category | Interaction Types | Drug Claim Name | Drug Name | PMIDs |
| Page: 1 |

Copyright 2023-Present -The University of Texas Health Science Center at Houston |