
|
|||||
|
 | |
| |
| |
| |
| |
| |
|
Gene: SLIT2 |
Gene summary for SLIT2 |
| Gene information | Species | Human | Gene symbol | SLIT2 | Gene ID | 9353 |
| Gene name | slit guidance ligand 2 | |
| Gene Alias | SLIL3 | |
| Cytomap | 4p15.31 | |
| Gene Type | protein-coding | GO ID | GO:0000003 | UniProtAcc | O94813 |
Top |
Malignant transformation analysis |
| Identification of the aberrant gene expression in precancerous and cancerous lesions by comparing the gene expression of stem-like cells in diseased tissues with normal stem cells |
| Entrez ID | Symbol | Replicates | Species | Organ | Tissue | Adj P-value | Log2FC | Malignancy |
| 9353 | SLIT2 | PTC07 | Human | Thyroid | PTC | 7.01e-12 | 2.83e-01 | 0.2044 |
| 9353 | SLIT2 | ATC11 | Human | Thyroid | ATC | 3.60e-02 | 3.40e-01 | 0.3386 |
| 9353 | SLIT2 | ATC12 | Human | Thyroid | ATC | 5.99e-30 | 7.43e-01 | 0.34 |
| 9353 | SLIT2 | ATC13 | Human | Thyroid | ATC | 1.78e-16 | 2.98e-01 | 0.34 |
| 9353 | SLIT2 | ATC3 | Human | Thyroid | ATC | 3.25e-05 | 3.45e-01 | 0.338 |
| 9353 | SLIT2 | ATC4 | Human | Thyroid | ATC | 5.29e-38 | 9.11e-01 | 0.34 |
| 9353 | SLIT2 | ATC5 | Human | Thyroid | ATC | 5.73e-22 | 3.14e-01 | 0.34 |
| Page: 1 2 |
| Tissue | Expression Dynamics | Abbreviation |
| Endometrium |  | AEH: Atypical endometrial hyperplasia |
| EEC: Endometrioid Cancer | ||
| Lung | 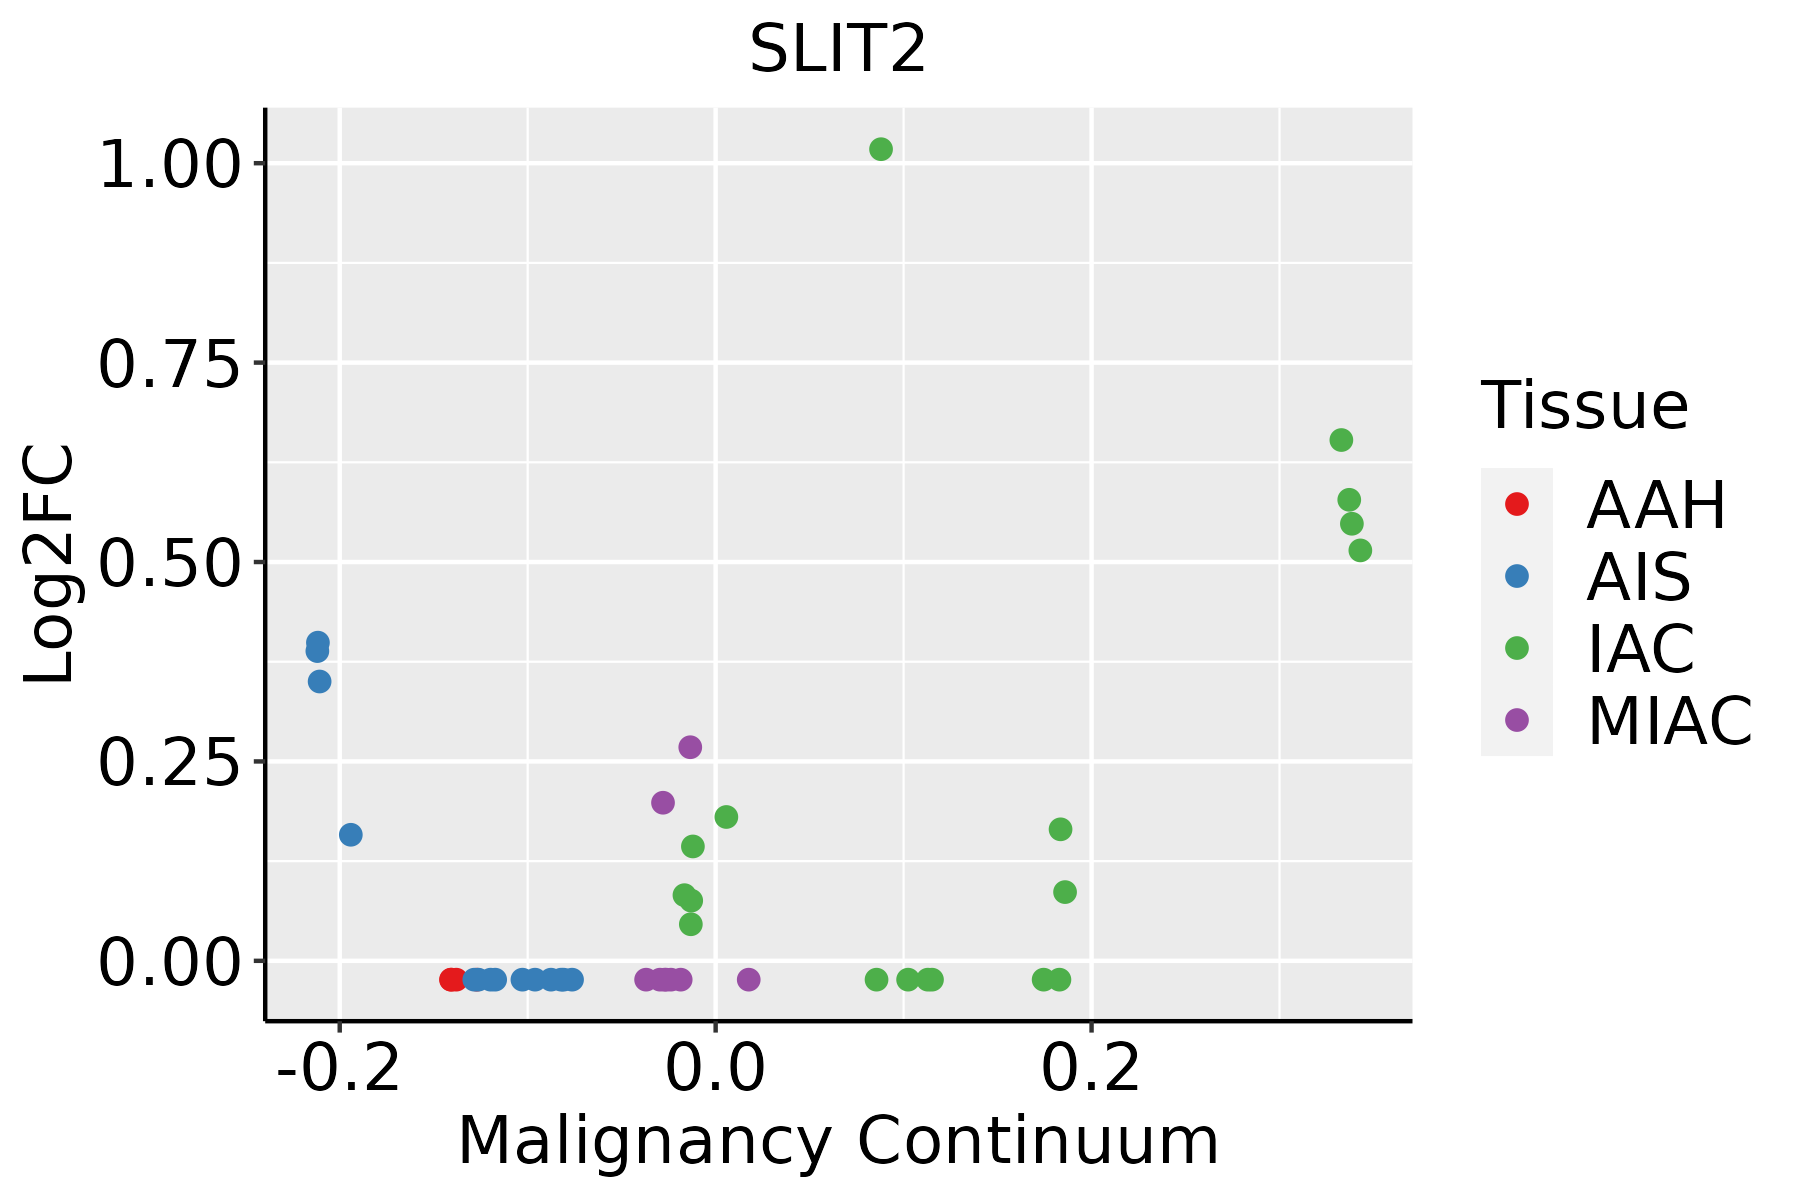 | AAH: Atypical adenomatous hyperplasia |
| AIS: Adenocarcinoma in situ | ||
| IAC: Invasive lung adenocarcinoma | ||
| MIA: Minimally invasive adenocarcinoma | ||
| Thyroid |  | ATC: Anaplastic thyroid cancer |
| HT: Hashimoto's thyroiditis | ||
| PTC: Papillary thyroid cancer |
| ∗log2FC in expression of this searched gene in stem-like cells from each diseased tissue sample relative to stem-like cells in normal samples in each tissue plotted against the malignancy continuum. Samples are colored based on if they are from different disease stage. |
Top |
Malignant transformation related pathway analysis |
| Find out the enriched GO biological processes and KEGG pathways involved in transition from healthy to precancer to cancer |
| Tissue | Disease Stage | Enriched GO biological Processes |
| Colorectum | AD |  |
| Colorectum | SER |  |
| Colorectum | MSS |  |
| Colorectum | MSI-H |  |
| Colorectum | FAP |  |
| ∗Top 15 enriched GO BP terms are showed in the bar plot of each disease state in each tissue. Each row represents a significant GO biological process which is colored according to the -log10(p.adjust). |
| Page: 1 2 3 4 5 6 7 8 9 |
| GO ID | Tissue | Disease Stage | Description | Gene Ratio | Bg Ratio | pvalue | p.adjust | Count |
| GO:000701516 | Endometrium | AEH | actin filament organization | 98/2100 | 442/18723 | 1.99e-11 | 2.98e-09 | 98 |
| GO:003297016 | Endometrium | AEH | regulation of actin filament-based process | 89/2100 | 397/18723 | 9.14e-11 | 1.10e-08 | 89 |
| GO:004854516 | Endometrium | AEH | response to steroid hormone | 76/2100 | 339/18723 | 2.15e-09 | 1.77e-07 | 76 |
| GO:190290316 | Endometrium | AEH | regulation of supramolecular fiber organization | 83/2100 | 383/18723 | 2.20e-09 | 1.78e-07 | 83 |
| GO:00614589 | Endometrium | AEH | reproductive system development | 88/2100 | 427/18723 | 9.50e-09 | 6.41e-07 | 88 |
| GO:003295616 | Endometrium | AEH | regulation of actin cytoskeleton organization | 77/2100 | 358/18723 | 1.18e-08 | 7.76e-07 | 77 |
| GO:00486089 | Endometrium | AEH | reproductive structure development | 87/2100 | 424/18723 | 1.43e-08 | 9.12e-07 | 87 |
| GO:00485119 | Endometrium | AEH | rhythmic process | 67/2100 | 298/18723 | 1.69e-08 | 1.04e-06 | 67 |
| GO:00160499 | Endometrium | AEH | cell growth | 93/2100 | 482/18723 | 1.00e-07 | 4.99e-06 | 93 |
| GO:003253510 | Endometrium | AEH | regulation of cellular component size | 78/2100 | 383/18723 | 1.10e-07 | 5.29e-06 | 78 |
| GO:011005316 | Endometrium | AEH | regulation of actin filament organization | 61/2100 | 278/18723 | 1.83e-07 | 8.11e-06 | 61 |
| GO:000166710 | Endometrium | AEH | ameboidal-type cell migration | 90/2100 | 475/18723 | 3.73e-07 | 1.57e-05 | 90 |
| GO:004325416 | Endometrium | AEH | regulation of protein-containing complex assembly | 83/2100 | 428/18723 | 3.90e-07 | 1.63e-05 | 83 |
| GO:00605607 | Endometrium | AEH | developmental growth involved in morphogenesis | 53/2100 | 234/18723 | 4.02e-07 | 1.67e-05 | 53 |
| GO:00074098 | Endometrium | AEH | axonogenesis | 81/2100 | 418/18723 | 5.54e-07 | 2.12e-05 | 81 |
| GO:009013014 | Endometrium | AEH | tissue migration | 73/2100 | 365/18723 | 5.79e-07 | 2.20e-05 | 73 |
| GO:00615648 | Endometrium | AEH | axon development | 88/2100 | 467/18723 | 6.39e-07 | 2.38e-05 | 88 |
| GO:009013214 | Endometrium | AEH | epithelium migration | 72/2100 | 360/18723 | 6.90e-07 | 2.55e-05 | 72 |
| GO:005125816 | Endometrium | AEH | protein polymerization | 62/2100 | 297/18723 | 9.04e-07 | 3.19e-05 | 62 |
| GO:001063114 | Endometrium | AEH | epithelial cell migration | 71/2100 | 357/18723 | 1.02e-06 | 3.52e-05 | 71 |
| Page: 1 2 3 4 5 6 7 8 9 10 11 12 13 14 15 16 17 18 19 20 21 22 23 24 25 26 27 28 29 |
| Pathway ID | Tissue | Disease Stage | Description | Gene Ratio | Bg Ratio | pvalue | p.adjust | qvalue | Count |
| hsa0436010 | Endometrium | AEH | Axon guidance | 39/1197 | 182/8465 | 4.47e-03 | 2.46e-02 | 1.80e-02 | 39 |
| hsa0436013 | Endometrium | AEH | Axon guidance | 39/1197 | 182/8465 | 4.47e-03 | 2.46e-02 | 1.80e-02 | 39 |
| hsa0436022 | Endometrium | EEC | Axon guidance | 39/1237 | 182/8465 | 7.78e-03 | 3.66e-02 | 2.73e-02 | 39 |
| hsa0436032 | Endometrium | EEC | Axon guidance | 39/1237 | 182/8465 | 7.78e-03 | 3.66e-02 | 2.73e-02 | 39 |
| hsa043608 | Lung | IAC | Axon guidance | 34/1053 | 182/8465 | 9.31e-03 | 3.62e-02 | 2.41e-02 | 34 |
| hsa0436011 | Lung | IAC | Axon guidance | 34/1053 | 182/8465 | 9.31e-03 | 3.62e-02 | 2.41e-02 | 34 |
| hsa0436021 | Lung | AIS | Axon guidance | 34/961 | 182/8465 | 2.22e-03 | 1.37e-02 | 8.80e-03 | 34 |
| hsa0436031 | Lung | AIS | Axon guidance | 34/961 | 182/8465 | 2.22e-03 | 1.37e-02 | 8.80e-03 | 34 |
| Page: 1 |
Top |
Cell-cell communication analysis |
| Identification of potential cell-cell interactions between two cell types and their ligand-receptor pairs for different disease states |
| Ligand | Receptor | LRpair | Pathway | Tissue | Disease Stage |
| Page: 1 |
Top |
Single-cell gene regulatory network inference analysis |
| Find out the significant the regulons (TFs) and the target genes of each regulon across cell types for different disease states |
| TF | Cell Type | Tissue | Disease Stage | Target Gene | RSS | Regulon Activity |
| ∗The dot plots of a searched regulon are shown for all cell subpopulations in each disease state of each tissue based on the regulon specific score inferred using pySCENIC and by calculating the average expression. |
| Page: 1 |
Top |
Somatic mutation of malignant transformation related genes |
| Annotation of somatic variants for genes involved in malignant transformation |
| Hugo Symbol | Variant Class | Variant Classification | dbSNP RS | HGVSc | HGVSp | HGVSp Short | SWISSPROT | BIOTYPE | SIFT | PolyPhen | Tumor Sample Barcode | Tissue | Histology | Sex | Age | Stage | Therapy Types | Drugs | Outcome |
| SLIT2 | SNV | Missense_Mutation | rs763158714 | c.1507N>T | p.Asp503Tyr | p.D503Y | O94813 | protein_coding | deleterious(0) | probably_damaging(0.947) | TCGA-A2-A4S1-01 | Breast | breast invasive carcinoma | Female | >=65 | I/II | Unknown | Unknown | SD |
| SLIT2 | SNV | Missense_Mutation | novel | c.1115T>G | p.Phe372Cys | p.F372C | O94813 | protein_coding | tolerated(0.14) | possibly_damaging(0.763) | TCGA-AN-A046-01 | Breast | breast invasive carcinoma | Female | >=65 | I/II | Unknown | Unknown | SD |
| SLIT2 | SNV | Missense_Mutation | c.4003N>T | p.Pro1335Ser | p.P1335S | O94813 | protein_coding | tolerated(0.39) | benign(0.23) | TCGA-AN-A0AK-01 | Breast | breast invasive carcinoma | Female | >=65 | I/II | Unknown | Unknown | SD | |
| SLIT2 | SNV | Missense_Mutation | novel | c.3353T>C | p.Val1118Ala | p.V1118A | O94813 | protein_coding | tolerated(0.34) | benign(0.009) | TCGA-AN-A0AL-01 | Breast | breast invasive carcinoma | Female | <65 | III/IV | Unknown | Unknown | SD |
| SLIT2 | SNV | Missense_Mutation | rs749148075 | c.566N>T | p.Arg189Ile | p.R189I | O94813 | protein_coding | tolerated(0.39) | benign(0.216) | TCGA-C8-A12T-01 | Breast | breast invasive carcinoma | Female | <65 | I/II | Unknown | Unknown | SD |
| SLIT2 | SNV | Missense_Mutation | rs767628989 | c.673N>T | p.Arg225Cys | p.R225C | O94813 | protein_coding | deleterious(0) | probably_damaging(0.931) | TCGA-C8-A26W-01 | Breast | breast invasive carcinoma | Female | <65 | I/II | Chemotherapy | doxorubicin | CR |
| SLIT2 | SNV | Missense_Mutation | c.1112N>C | p.Leu371Pro | p.L371P | O94813 | protein_coding | deleterious(0) | probably_damaging(1) | TCGA-D8-A1J8-01 | Breast | breast invasive carcinoma | Female | >=65 | I/II | Hormone Therapy | nolvadex | SD | |
| SLIT2 | SNV | Missense_Mutation | c.1859G>T | p.Cys620Phe | p.C620F | O94813 | protein_coding | deleterious(0) | probably_damaging(0.975) | TCGA-E9-A24A-01 | Breast | breast invasive carcinoma | Female | >=65 | I/II | Hormone Therapy | tamoxiphen | SD | |
| SLIT2 | SNV | Missense_Mutation | c.2668N>C | p.Gly890Arg | p.G890R | O94813 | protein_coding | tolerated(0.38) | benign(0.021) | TCGA-EW-A1IX-01 | Breast | breast invasive carcinoma | Female | <65 | I/II | Hormone Therapy | femara | SD | |
| SLIT2 | SNV | Missense_Mutation | rs752006737 | c.3412N>A | p.Val1138Ile | p.V1138I | O94813 | protein_coding | tolerated(0.25) | benign(0.014) | TCGA-EW-A423-01 | Breast | breast invasive carcinoma | Female | >=65 | I/II | Hormone Therapy | anastrozole | SD |
| Page: 1 2 3 4 5 6 7 8 9 10 11 12 13 14 15 16 17 18 19 20 21 22 23 24 25 26 27 28 29 |
Top |
Related drugs of malignant transformation related genes |
| Identification of chemicals and drugs interact with genes involved in malignant transfromation |
| (DGIdb 4.0) |
| Entrez ID | Symbol | Category | Interaction Types | Drug Claim Name | Drug Name | PMIDs |
| Page: 1 |

Copyright 2023-Present -The University of Texas Health Science Center at Houston |