
|
|||||
|
 | |
| |
| |
| |
| |
| |
|
Gene: SLC6A6 |
Gene summary for SLC6A6 |
| Gene information | Species | Human | Gene symbol | SLC6A6 | Gene ID | 6533 |
| Gene name | solute carrier family 6 member 6 | |
| Gene Alias | HTRDC | |
| Cytomap | 3p25.1 | |
| Gene Type | protein-coding | GO ID | GO:0003008 | UniProtAcc | A0A087WY96 |
Top |
Malignant transformation analysis |
| Identification of the aberrant gene expression in precancerous and cancerous lesions by comparing the gene expression of stem-like cells in diseased tissues with normal stem cells |
| Entrez ID | Symbol | Replicates | Species | Organ | Tissue | Adj P-value | Log2FC | Malignancy |
| 6533 | SLC6A6 | LZE8T | Human | Esophagus | ESCC | 3.01e-02 | -9.92e-02 | 0.067 |
| 6533 | SLC6A6 | LZE20T | Human | Esophagus | ESCC | 4.50e-04 | -6.59e-02 | 0.0662 |
| 6533 | SLC6A6 | LZE24T | Human | Esophagus | ESCC | 2.12e-05 | 2.30e-01 | 0.0596 |
| 6533 | SLC6A6 | LZE6T | Human | Esophagus | ESCC | 6.32e-03 | 2.89e-03 | 0.0845 |
| 6533 | SLC6A6 | P2T-E | Human | Esophagus | ESCC | 1.98e-06 | 1.15e-02 | 0.1177 |
| 6533 | SLC6A6 | P4T-E | Human | Esophagus | ESCC | 1.20e-02 | 1.49e-01 | 0.1323 |
| 6533 | SLC6A6 | P5T-E | Human | Esophagus | ESCC | 3.22e-12 | 2.05e-01 | 0.1327 |
| 6533 | SLC6A6 | P8T-E | Human | Esophagus | ESCC | 1.74e-14 | 2.81e-02 | 0.0889 |
| 6533 | SLC6A6 | P9T-E | Human | Esophagus | ESCC | 8.34e-06 | 2.78e-01 | 0.1131 |
| 6533 | SLC6A6 | P11T-E | Human | Esophagus | ESCC | 6.80e-07 | 1.91e-01 | 0.1426 |
| 6533 | SLC6A6 | P12T-E | Human | Esophagus | ESCC | 3.25e-14 | 4.09e-01 | 0.1122 |
| 6533 | SLC6A6 | P15T-E | Human | Esophagus | ESCC | 1.91e-09 | 4.54e-02 | 0.1149 |
| 6533 | SLC6A6 | P16T-E | Human | Esophagus | ESCC | 3.00e-07 | -7.32e-02 | 0.1153 |
| 6533 | SLC6A6 | P21T-E | Human | Esophagus | ESCC | 1.14e-14 | 1.03e-01 | 0.1617 |
| 6533 | SLC6A6 | P22T-E | Human | Esophagus | ESCC | 7.30e-06 | 9.84e-02 | 0.1236 |
| 6533 | SLC6A6 | P23T-E | Human | Esophagus | ESCC | 5.70e-09 | 5.53e-01 | 0.108 |
| 6533 | SLC6A6 | P24T-E | Human | Esophagus | ESCC | 6.59e-07 | -4.90e-02 | 0.1287 |
| 6533 | SLC6A6 | P26T-E | Human | Esophagus | ESCC | 1.47e-26 | 7.67e-01 | 0.1276 |
| 6533 | SLC6A6 | P27T-E | Human | Esophagus | ESCC | 4.68e-11 | 3.21e-01 | 0.1055 |
| 6533 | SLC6A6 | P28T-E | Human | Esophagus | ESCC | 7.67e-19 | 5.96e-01 | 0.1149 |
| Page: 1 2 3 4 |
| Tissue | Expression Dynamics | Abbreviation |
| Colorectum (GSE201348) |  | FAP: Familial adenomatous polyposis |
| CRC: Colorectal cancer | ||
| Colorectum (HTA11) | 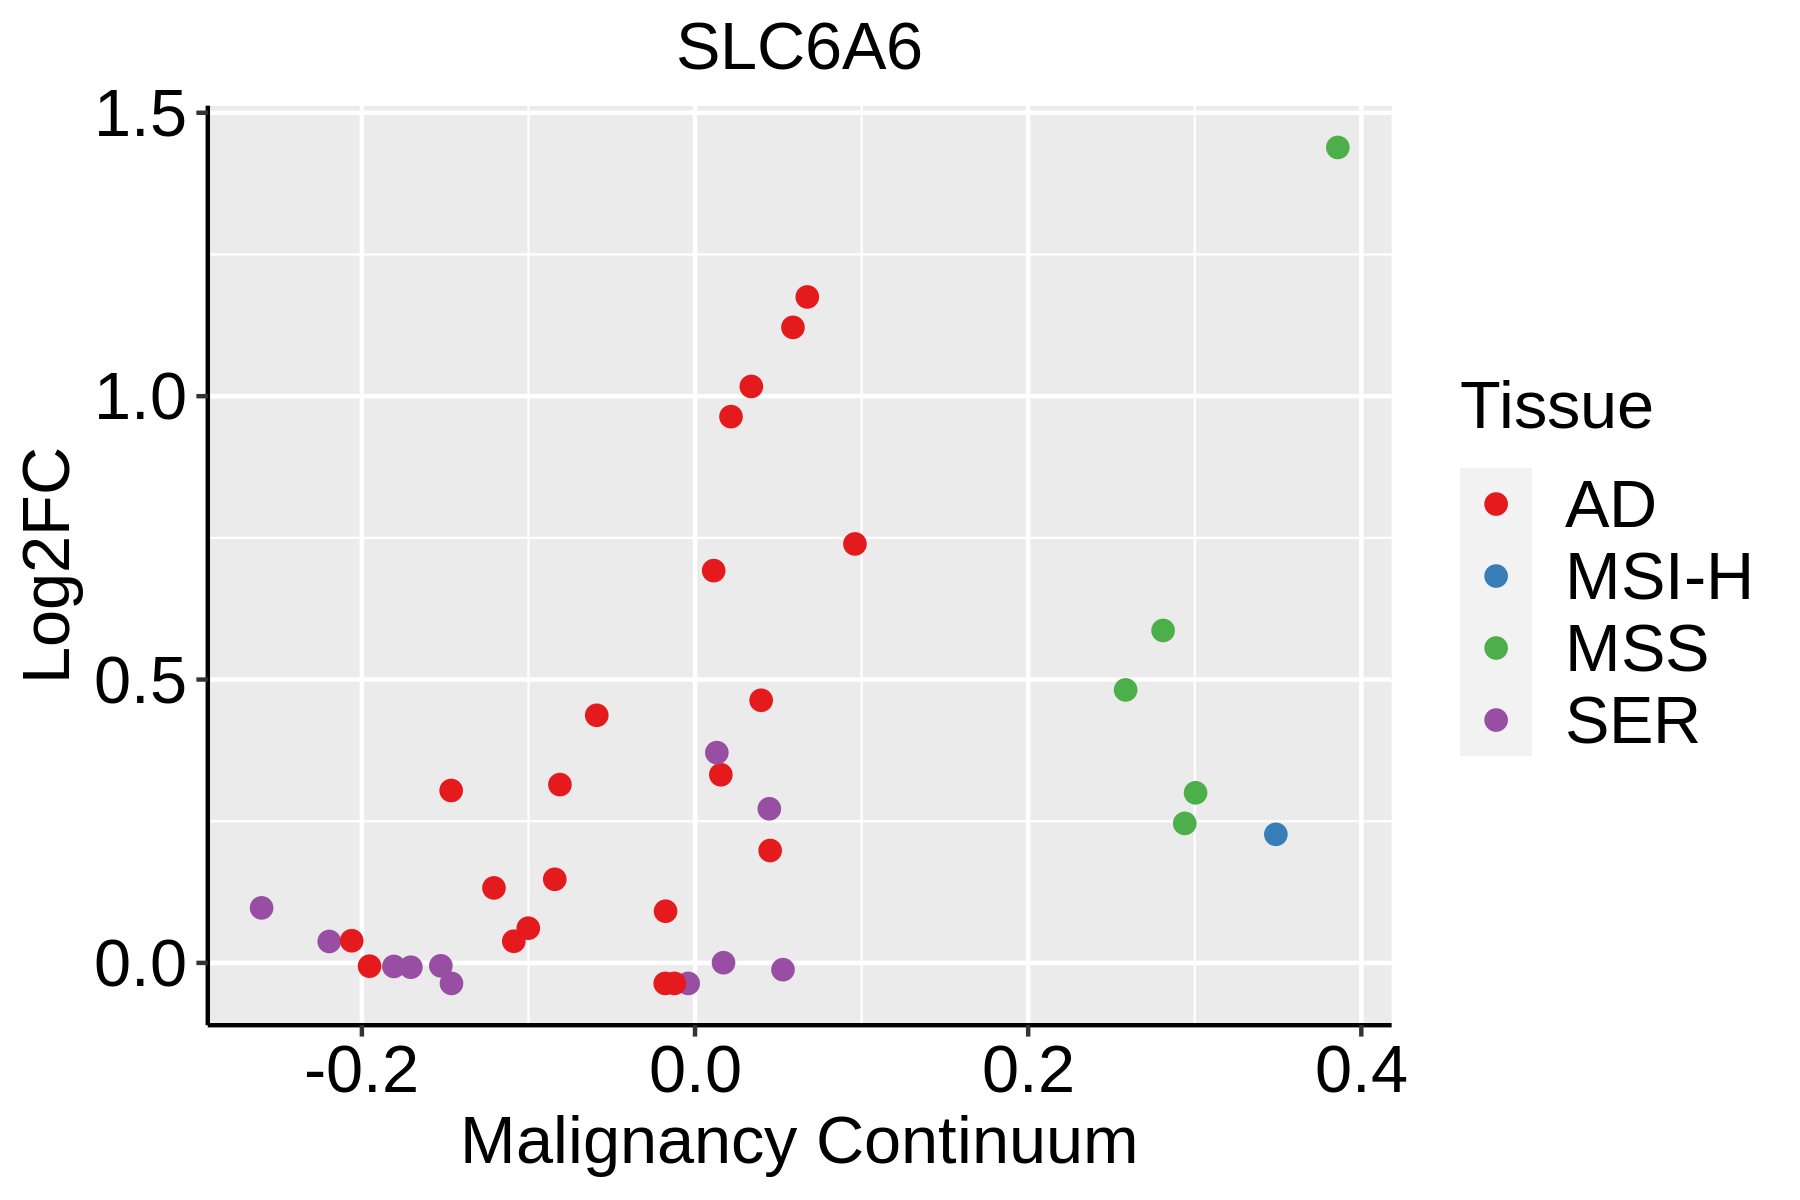 | AD: Adenomas |
| SER: Sessile serrated lesions | ||
| MSI-H: Microsatellite-high colorectal cancer | ||
| MSS: Microsatellite stable colorectal cancer | ||
| Esophagus | 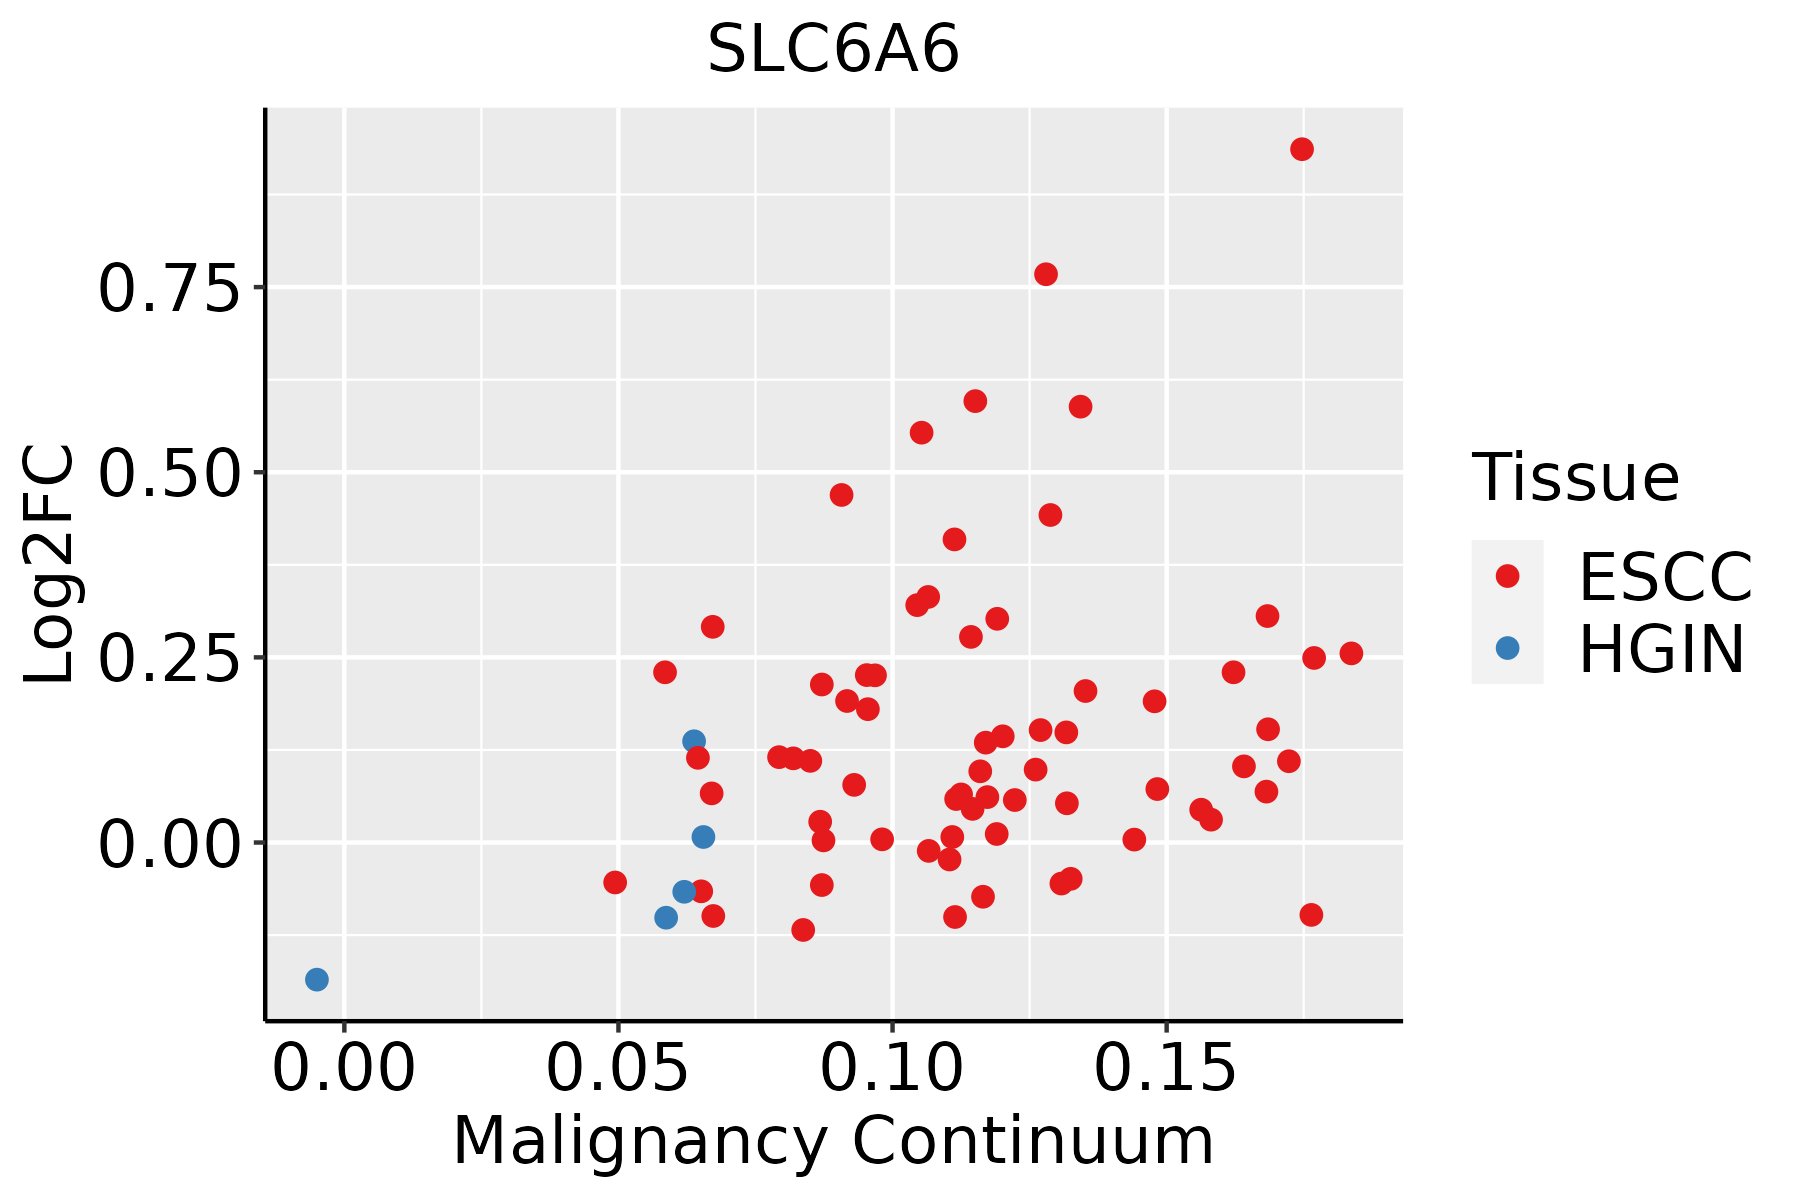 | ESCC: Esophageal squamous cell carcinoma |
| HGIN: High-grade intraepithelial neoplasias | ||
| LGIN: Low-grade intraepithelial neoplasias | ||
| Thyroid | 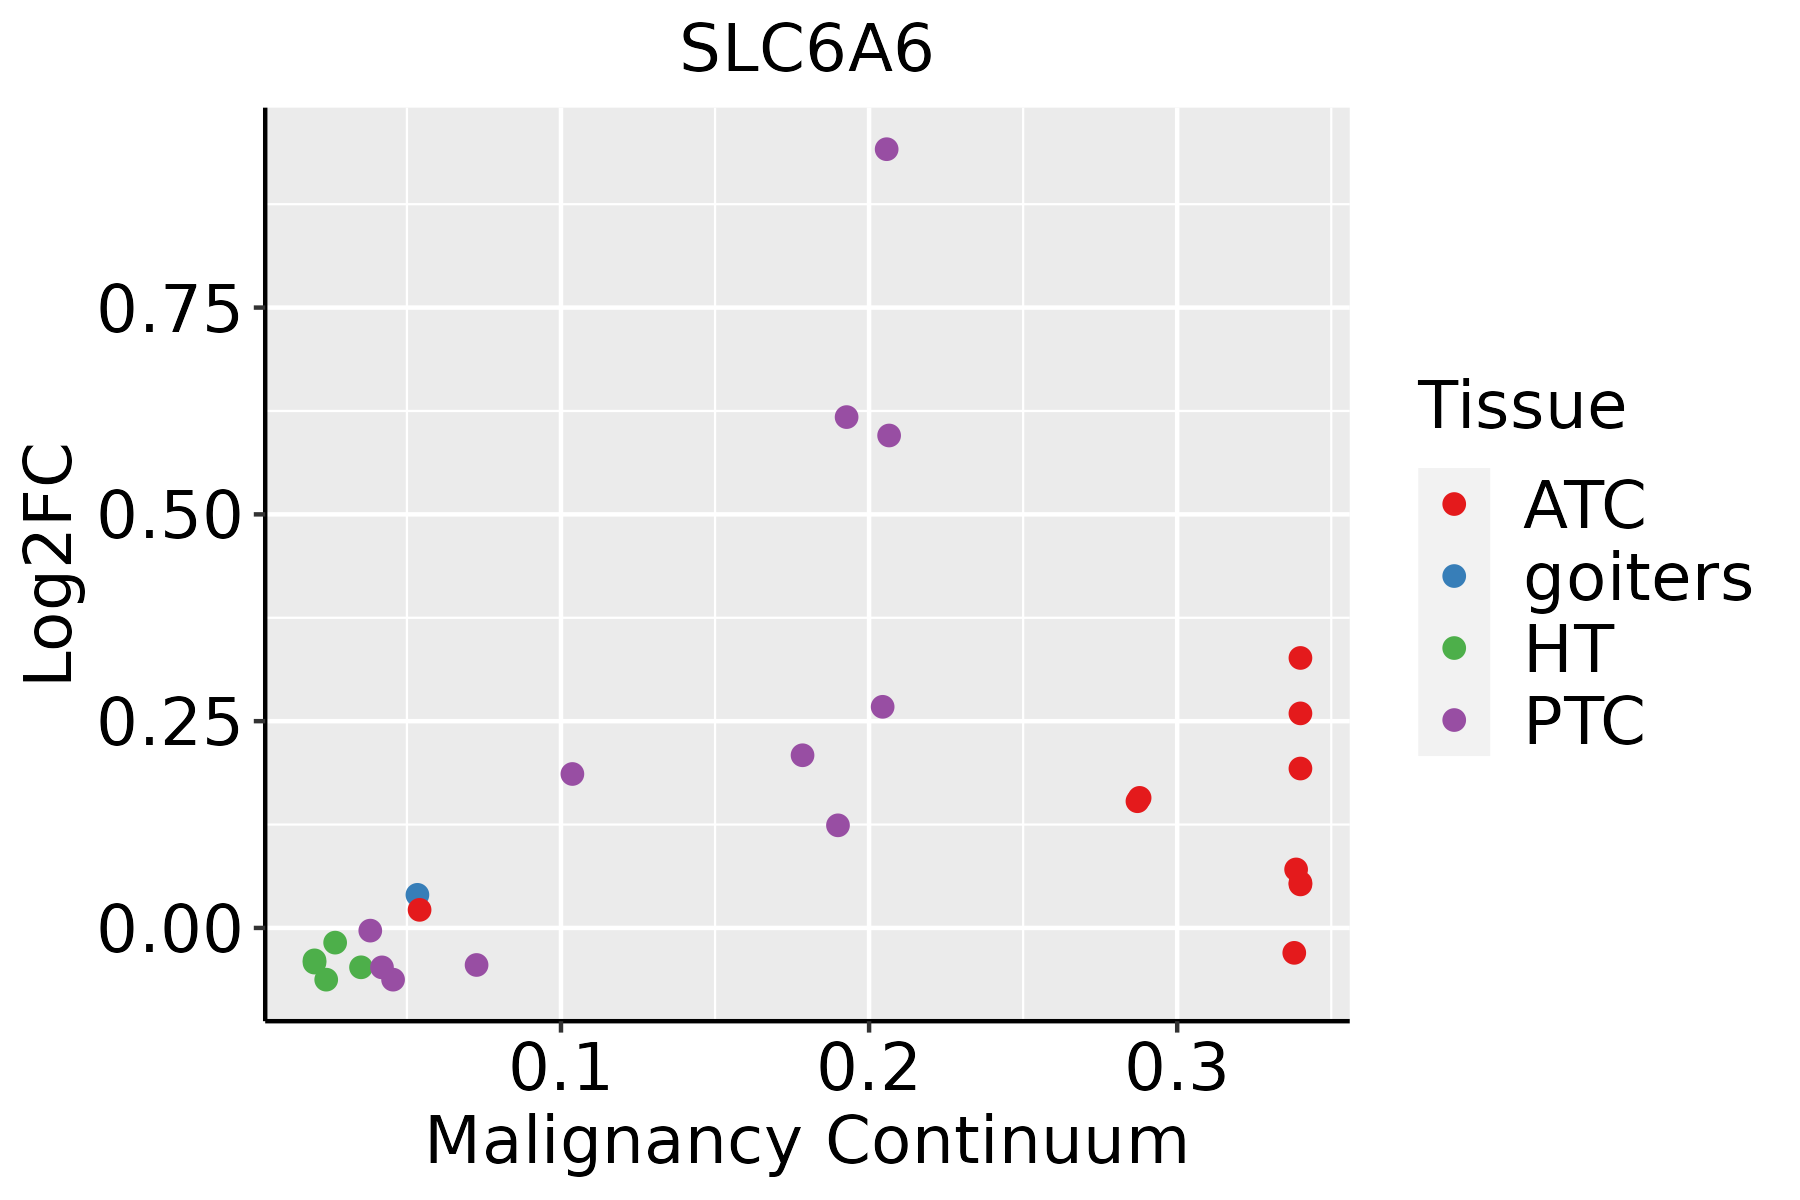 | ATC: Anaplastic thyroid cancer |
| HT: Hashimoto's thyroiditis | ||
| PTC: Papillary thyroid cancer |
| ∗log2FC in expression of this searched gene in stem-like cells from each diseased tissue sample relative to stem-like cells in normal samples in each tissue plotted against the malignancy continuum. Samples are colored based on if they are from different disease stage. |
Top |
Malignant transformation related pathway analysis |
| Find out the enriched GO biological processes and KEGG pathways involved in transition from healthy to precancer to cancer |
| Tissue | Disease Stage | Enriched GO biological Processes |
| Colorectum | AD |  |
| Colorectum | SER |  |
| Colorectum | MSS |  |
| Colorectum | MSI-H |  |
| Colorectum | FAP |  |
| ∗Top 15 enriched GO BP terms are showed in the bar plot of each disease state in each tissue. Each row represents a significant GO biological process which is colored according to the -log10(p.adjust). |
| Page: 1 2 3 4 5 6 7 8 9 |
| GO ID | Tissue | Disease Stage | Description | Gene Ratio | Bg Ratio | pvalue | p.adjust | Count |
| GO:0150104 | Colorectum | MSS | transport across blood-brain barrier | 28/3467 | 87/18723 | 1.54e-03 | 1.41e-02 | 28 |
| GO:0010232 | Colorectum | MSS | vascular transport | 28/3467 | 88/18723 | 1.87e-03 | 1.64e-02 | 28 |
| GO:0035725 | Colorectum | FAP | sodium ion transmembrane transport | 44/2622 | 178/18723 | 9.31e-05 | 1.60e-03 | 44 |
| GO:01501041 | Colorectum | FAP | transport across blood-brain barrier | 25/2622 | 87/18723 | 2.63e-04 | 3.59e-03 | 25 |
| GO:00102321 | Colorectum | FAP | vascular transport | 25/2622 | 88/18723 | 3.19e-04 | 4.12e-03 | 25 |
| GO:0006814 | Colorectum | FAP | sodium ion transport | 54/2622 | 245/18723 | 3.98e-04 | 4.85e-03 | 54 |
| GO:0003018 | Colorectum | FAP | vascular process in circulatory system | 56/2622 | 263/18723 | 7.67e-04 | 8.12e-03 | 56 |
| GO:00357251 | Colorectum | CRC | sodium ion transmembrane transport | 39/2078 | 178/18723 | 2.30e-05 | 6.60e-04 | 39 |
| GO:00068141 | Colorectum | CRC | sodium ion transport | 49/2078 | 245/18723 | 3.01e-05 | 7.86e-04 | 49 |
| GO:0050804 | Colorectum | CRC | modulation of chemical synaptic transmission | 70/2078 | 439/18723 | 1.15e-03 | 1.33e-02 | 70 |
| GO:0099177 | Colorectum | CRC | regulation of trans-synaptic signaling | 70/2078 | 440/18723 | 1.23e-03 | 1.38e-02 | 70 |
| GO:00030181 | Colorectum | CRC | vascular process in circulatory system | 45/2078 | 263/18723 | 2.10e-03 | 2.08e-02 | 45 |
| GO:01501042 | Colorectum | CRC | transport across blood-brain barrier | 18/2078 | 87/18723 | 6.50e-03 | 4.69e-02 | 18 |
| GO:00702654 | Esophagus | ESCC | necrotic cell death | 39/8552 | 62/18723 | 4.68e-03 | 1.82e-02 | 39 |
| GO:00702656 | Thyroid | PTC | necrotic cell death | 29/5968 | 62/18723 | 9.96e-03 | 4.07e-02 | 29 |
| GO:007026512 | Thyroid | ATC | necrotic cell death | 30/6293 | 62/18723 | 1.12e-02 | 4.00e-02 | 30 |
| Page: 1 |
| Pathway ID | Tissue | Disease Stage | Description | Gene Ratio | Bg Ratio | pvalue | p.adjust | qvalue | Count |
| Page: 1 |
Top |
Cell-cell communication analysis |
| Identification of potential cell-cell interactions between two cell types and their ligand-receptor pairs for different disease states |
| Ligand | Receptor | LRpair | Pathway | Tissue | Disease Stage |
| Page: 1 |
Top |
Single-cell gene regulatory network inference analysis |
| Find out the significant the regulons (TFs) and the target genes of each regulon across cell types for different disease states |
| TF | Cell Type | Tissue | Disease Stage | Target Gene | RSS | Regulon Activity |
| ∗The dot plots of a searched regulon are shown for all cell subpopulations in each disease state of each tissue based on the regulon specific score inferred using pySCENIC and by calculating the average expression. |
| Page: 1 |
Top |
Somatic mutation of malignant transformation related genes |
| Annotation of somatic variants for genes involved in malignant transformation |
| Hugo Symbol | Variant Class | Variant Classification | dbSNP RS | HGVSc | HGVSp | HGVSp Short | SWISSPROT | BIOTYPE | SIFT | PolyPhen | Tumor Sample Barcode | Tissue | Histology | Sex | Age | Stage | Therapy Types | Drugs | Outcome |
| SLC6A6 | SNV | Missense_Mutation | rs776981870 | c.2125N>T | p.Leu709Phe | p.L709F | protein_coding | tolerated_low_confidence(0.05) | possibly_damaging(0.877) | TCGA-3C-AALI-01 | Breast | breast invasive carcinoma | Female | <65 | I/II | Unspecific | Poly E | Complete Response | |
| SLC6A6 | SNV | Missense_Mutation | novel | c.444N>T | p.Lys148Asn | p.K148N | protein_coding | deleterious(0.02) | possibly_damaging(0.798) | TCGA-AN-A046-01 | Breast | breast invasive carcinoma | Female | >=65 | I/II | Unknown | Unknown | SD | |
| SLC6A6 | SNV | Missense_Mutation | c.1348N>A | p.Gly450Ser | p.G450S | protein_coding | deleterious(0) | probably_damaging(1) | TCGA-AO-A128-01 | Breast | breast invasive carcinoma | Female | <65 | I/II | Chemotherapy | doxorubicin | SD | ||
| SLC6A6 | SNV | Missense_Mutation | novel | c.1147N>T | p.Ile383Phe | p.I383F | protein_coding | tolerated(0.44) | possibly_damaging(0.492) | TCGA-B6-A0I1-01 | Breast | breast invasive carcinoma | Female | >=65 | I/II | Unknown | Unknown | PD | |
| SLC6A6 | SNV | Missense_Mutation | c.1472N>G | p.Leu491Arg | p.L491R | protein_coding | deleterious(0) | probably_damaging(0.999) | TCGA-D8-A1XK-01 | Breast | breast invasive carcinoma | Female | <65 | I/II | Chemotherapy | doxorubicine+cyclophosphamide | SD | ||
| SLC6A6 | SNV | Missense_Mutation | c.1732T>C | p.Phe578Leu | p.F578L | protein_coding | tolerated(0.34) | benign(0.06) | TCGA-EW-A1P4-01 | Breast | breast invasive carcinoma | Female | <65 | I/II | Chemotherapy | docetaxel | SD | ||
| SLC6A6 | insertion | Nonsense_Mutation | novel | c.533_534insCTCTGAGGCTTGAAGTCCCTGGTAGAT | p.Gly178_Ala179insSerGluAlaTerSerProTrpTerIle | p.G178_A179insSEA*SPW*I | protein_coding | TCGA-A8-A099-01 | Breast | breast invasive carcinoma | Female | >=65 | III/IV | Hormone Therapy | exemestane | SD | |||
| SLC6A6 | insertion | In_Frame_Ins | novel | c.1255_1256insCTC | p.Tyr419delinsSerHis | p.Y419delinsSH | protein_coding | TCGA-AO-A0J5-01 | Breast | breast invasive carcinoma | Female | <65 | III/IV | Other, specify in notesBisphosphonate | zoledronic | PD | |||
| SLC6A6 | insertion | Nonsense_Mutation | novel | c.1256_1257insGTAAATCTGTGAGGTGGGCTGGCGCTGTGGCT | p.Tyr419Ter | p.Y419* | protein_coding | TCGA-AO-A0J5-01 | Breast | breast invasive carcinoma | Female | <65 | III/IV | Other, specify in notesBisphosphonate | zoledronic | PD | |||
| SLC6A6 | insertion | In_Frame_Ins | novel | c.991_992insGGGTTGGTGACTGTCCCGTGCCAATTATCCTTAAAACCGTTTACC | p.Val331delinsGlyValGlyAspCysProValProIleIleLeuLysThrValTyrLeu | p.V331delinsGVGDCPVPIILKTVYL | protein_coding | TCGA-BH-A0HY-01 | Breast | breast invasive carcinoma | Female | <65 | I/II | Hormone Therapy | taxotere | CR |
| Page: 1 2 3 4 5 6 7 8 |
Top |
Related drugs of malignant transformation related genes |
| Identification of chemicals and drugs interact with genes involved in malignant transfromation |
| (DGIdb 4.0) |
| Entrez ID | Symbol | Category | Interaction Types | Drug Claim Name | Drug Name | PMIDs |
| Page: 1 |

Copyright 2023-Present -The University of Texas Health Science Center at Houston |