
|
|||||
|
 | |
| |
| |
| |
| |
| |
|
Gene: SLC44A3 |
Gene summary for SLC44A3 |
| Gene information | Species | Human | Gene symbol | SLC44A3 | Gene ID | 126969 |
| Gene name | solute carrier family 44 member 3 | |
| Gene Alias | CTL3 | |
| Cytomap | 1p21.3 | |
| Gene Type | protein-coding | GO ID | GO:0006629 | UniProtAcc | Q8N4M1 |
Top |
Malignant transformation analysis |
| Identification of the aberrant gene expression in precancerous and cancerous lesions by comparing the gene expression of stem-like cells in diseased tissues with normal stem cells |
| Entrez ID | Symbol | Replicates | Species | Organ | Tissue | Adj P-value | Log2FC | Malignancy |
| 126969 | SLC44A3 | A001-C-014 | Human | Colorectum | FAP | 6.21e-12 | -2.33e-01 | 0.0135 |
| 126969 | SLC44A3 | A002-C-016 | Human | Colorectum | FAP | 4.99e-22 | -3.26e-01 | 0.0521 |
| 126969 | SLC44A3 | A015-C-002 | Human | Colorectum | FAP | 2.83e-16 | -5.68e-01 | -0.0763 |
| 126969 | SLC44A3 | A001-C-203 | Human | Colorectum | FAP | 1.68e-10 | -7.32e-02 | -0.0481 |
| 126969 | SLC44A3 | A002-C-116 | Human | Colorectum | FAP | 2.40e-36 | -6.55e-01 | -0.0452 |
| 126969 | SLC44A3 | A014-C-008 | Human | Colorectum | FAP | 2.75e-17 | -2.91e-01 | -0.191 |
| 126969 | SLC44A3 | A018-E-020 | Human | Colorectum | FAP | 5.50e-23 | -3.00e-01 | -0.2034 |
| 126969 | SLC44A3 | F034 | Human | Colorectum | FAP | 9.44e-18 | -2.58e-01 | -0.0665 |
| 126969 | SLC44A3 | F072B | Human | Colorectum | FAP | 5.37e-04 | -9.20e-02 | 0.257 |
| 126969 | SLC44A3 | CRC-1-8810 | Human | Colorectum | CRC | 1.60e-08 | -5.03e-01 | 0.6257 |
| 126969 | SLC44A3 | CRC-3-11773 | Human | Colorectum | CRC | 2.04e-15 | -5.62e-01 | 0.2564 |
| 126969 | SLC44A3 | P2T-E | Human | Esophagus | ESCC | 4.16e-02 | -1.49e-02 | 0.1177 |
| 126969 | SLC44A3 | P5T-E | Human | Esophagus | ESCC | 5.47e-05 | 2.97e-02 | 0.1327 |
| 126969 | SLC44A3 | P8T-E | Human | Esophagus | ESCC | 1.44e-13 | 1.78e-01 | 0.0889 |
| 126969 | SLC44A3 | P12T-E | Human | Esophagus | ESCC | 1.31e-03 | 9.62e-02 | 0.1122 |
| 126969 | SLC44A3 | P23T-E | Human | Esophagus | ESCC | 3.62e-11 | 3.30e-01 | 0.108 |
| 126969 | SLC44A3 | P27T-E | Human | Esophagus | ESCC | 6.05e-03 | 3.99e-02 | 0.1055 |
| 126969 | SLC44A3 | P32T-E | Human | Esophagus | ESCC | 1.29e-03 | 4.50e-03 | 0.1666 |
| 126969 | SLC44A3 | P39T-E | Human | Esophagus | ESCC | 5.54e-05 | 4.90e-02 | 0.0894 |
| 126969 | SLC44A3 | P47T-E | Human | Esophagus | ESCC | 5.78e-03 | -6.44e-03 | 0.1067 |
| Page: 1 2 3 4 |
| Tissue | Expression Dynamics | Abbreviation |
| Colorectum (GSE201348) |  | FAP: Familial adenomatous polyposis |
| CRC: Colorectal cancer | ||
| Colorectum (HTA11) | 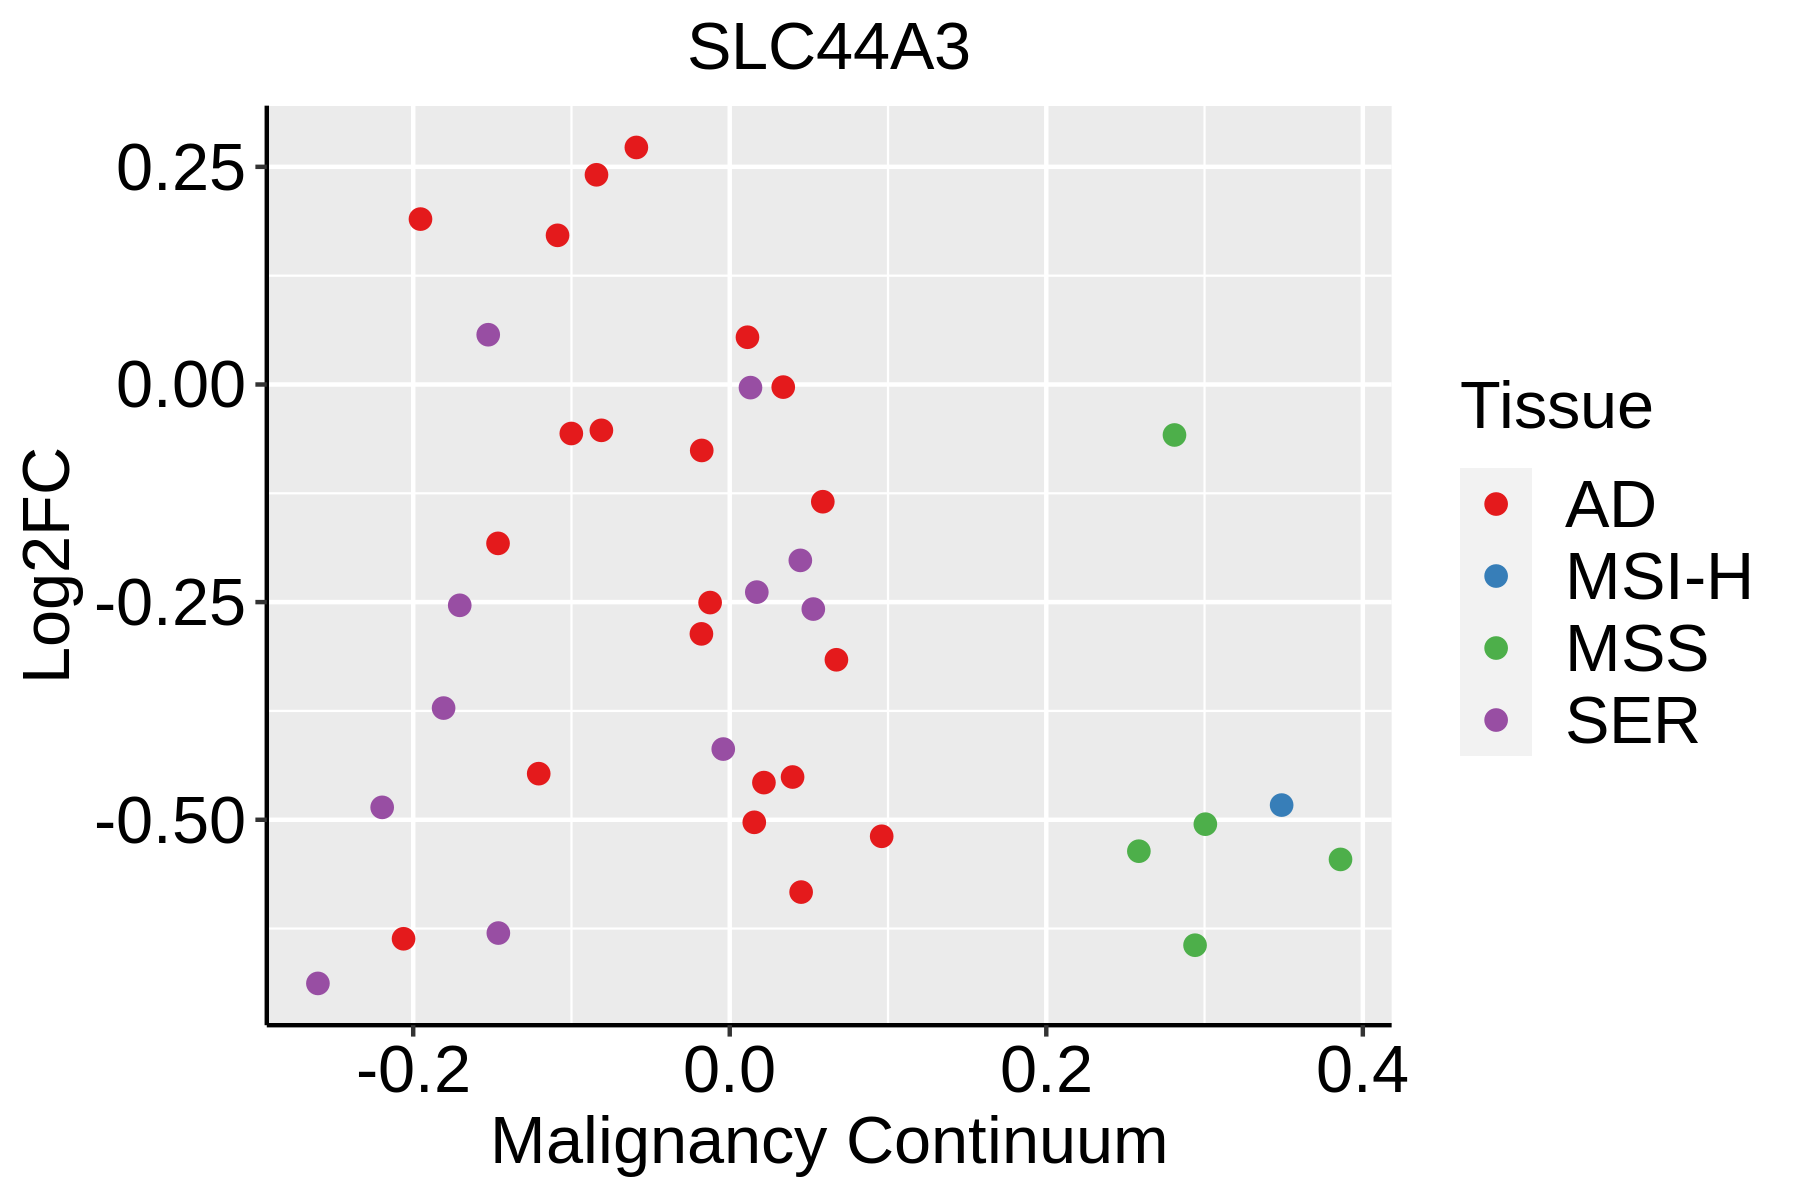 | AD: Adenomas |
| SER: Sessile serrated lesions | ||
| MSI-H: Microsatellite-high colorectal cancer | ||
| MSS: Microsatellite stable colorectal cancer | ||
| Esophagus |  | ESCC: Esophageal squamous cell carcinoma |
| HGIN: High-grade intraepithelial neoplasias | ||
| LGIN: Low-grade intraepithelial neoplasias | ||
| Liver |  | HCC: Hepatocellular carcinoma |
| NAFLD: Non-alcoholic fatty liver disease | ||
| Lung | 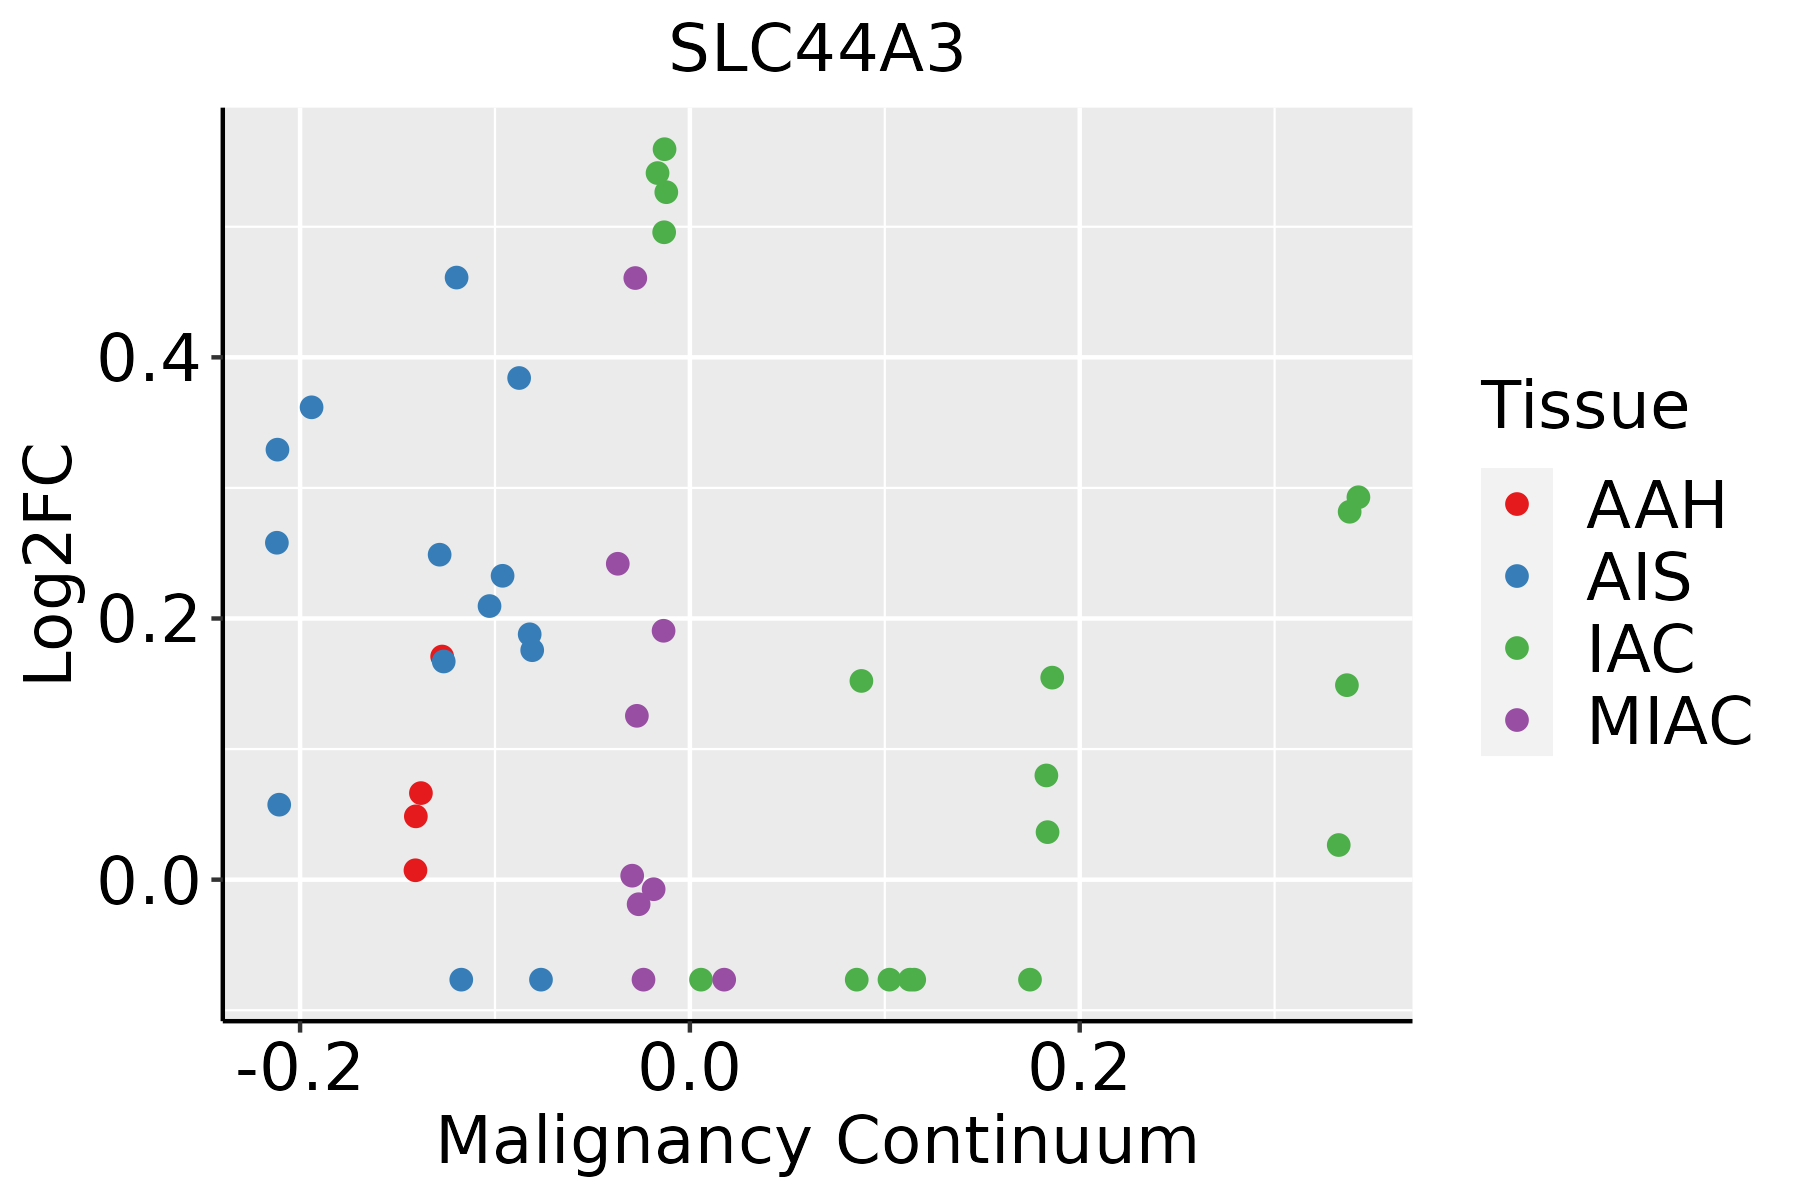 | AAH: Atypical adenomatous hyperplasia |
| AIS: Adenocarcinoma in situ | ||
| IAC: Invasive lung adenocarcinoma | ||
| MIA: Minimally invasive adenocarcinoma |
| ∗log2FC in expression of this searched gene in stem-like cells from each diseased tissue sample relative to stem-like cells in normal samples in each tissue plotted against the malignancy continuum. Samples are colored based on if they are from different disease stage. |
Top |
Malignant transformation related pathway analysis |
| Find out the enriched GO biological processes and KEGG pathways involved in transition from healthy to precancer to cancer |
| Tissue | Disease Stage | Enriched GO biological Processes |
| Colorectum | AD |  |
| Colorectum | SER |  |
| Colorectum | MSS |  |
| Colorectum | MSI-H |  |
| Colorectum | FAP |  |
| ∗Top 15 enriched GO BP terms are showed in the bar plot of each disease state in each tissue. Each row represents a significant GO biological process which is colored according to the -log10(p.adjust). |
| Page: 1 2 3 4 5 6 7 8 9 |
| GO ID | Tissue | Disease Stage | Description | Gene Ratio | Bg Ratio | pvalue | p.adjust | Count |
| GO:0006650 | Colorectum | AD | glycerophospholipid metabolic process | 83/3918 | 306/18723 | 5.40e-03 | 3.55e-02 | 83 |
| GO:0006644 | Colorectum | AD | phospholipid metabolic process | 101/3918 | 383/18723 | 5.80e-03 | 3.67e-02 | 101 |
| GO:0045017 | Colorectum | AD | glycerolipid biosynthetic process | 69/3918 | 252/18723 | 8.33e-03 | 4.88e-02 | 69 |
| GO:0046486 | Colorectum | SER | glycerolipid metabolic process | 82/2897 | 392/18723 | 2.26e-03 | 2.17e-02 | 82 |
| GO:00066441 | Colorectum | SER | phospholipid metabolic process | 79/2897 | 383/18723 | 3.94e-03 | 3.24e-02 | 79 |
| GO:00450171 | Colorectum | SER | glycerolipid biosynthetic process | 55/2897 | 252/18723 | 4.47e-03 | 3.56e-02 | 55 |
| GO:00066501 | Colorectum | SER | glycerophospholipid metabolic process | 64/2897 | 306/18723 | 6.41e-03 | 4.60e-02 | 64 |
| GO:0008654 | Colorectum | FAP | phospholipid biosynthetic process | 54/2622 | 253/18723 | 8.88e-04 | 9.08e-03 | 54 |
| GO:00066502 | Colorectum | FAP | glycerophospholipid metabolic process | 62/2622 | 306/18723 | 1.54e-03 | 1.38e-02 | 62 |
| GO:00066442 | Colorectum | FAP | phospholipid metabolic process | 74/2622 | 383/18723 | 2.24e-03 | 1.83e-02 | 74 |
| GO:0046474 | Colorectum | FAP | glycerophospholipid biosynthetic process | 44/2622 | 211/18723 | 3.98e-03 | 2.76e-02 | 44 |
| GO:00450172 | Colorectum | FAP | glycerolipid biosynthetic process | 50/2622 | 252/18723 | 6.32e-03 | 3.95e-02 | 50 |
| GO:00086541 | Colorectum | CRC | phospholipid biosynthetic process | 49/2078 | 253/18723 | 7.07e-05 | 1.51e-03 | 49 |
| GO:00066503 | Colorectum | CRC | glycerophospholipid metabolic process | 55/2078 | 306/18723 | 2.10e-04 | 3.55e-03 | 55 |
| GO:00450173 | Colorectum | CRC | glycerolipid biosynthetic process | 47/2078 | 252/18723 | 2.47e-04 | 4.06e-03 | 47 |
| GO:00066443 | Colorectum | CRC | phospholipid metabolic process | 65/2078 | 383/18723 | 3.21e-04 | 4.95e-03 | 65 |
| GO:00464741 | Colorectum | CRC | glycerophospholipid biosynthetic process | 40/2078 | 211/18723 | 4.91e-04 | 7.02e-03 | 40 |
| GO:00464861 | Colorectum | CRC | glycerolipid metabolic process | 64/2078 | 392/18723 | 1.01e-03 | 1.19e-02 | 64 |
| GO:00086544 | Esophagus | ESCC | phospholipid biosynthetic process | 162/8552 | 253/18723 | 2.59e-09 | 5.73e-08 | 162 |
| GO:00464744 | Esophagus | ESCC | glycerophospholipid biosynthetic process | 135/8552 | 211/18723 | 5.75e-08 | 1.02e-06 | 135 |
| Page: 1 2 |
| Pathway ID | Tissue | Disease Stage | Description | Gene Ratio | Bg Ratio | pvalue | p.adjust | qvalue | Count |
| hsa05231 | Colorectum | MSS | Choline metabolism in cancer | 34/1875 | 98/8465 | 2.90e-03 | 1.39e-02 | 8.50e-03 | 34 |
| hsa052311 | Colorectum | MSS | Choline metabolism in cancer | 34/1875 | 98/8465 | 2.90e-03 | 1.39e-02 | 8.50e-03 | 34 |
| hsa052312 | Colorectum | FAP | Choline metabolism in cancer | 29/1404 | 98/8465 | 9.03e-04 | 5.20e-03 | 3.16e-03 | 29 |
| hsa052313 | Colorectum | FAP | Choline metabolism in cancer | 29/1404 | 98/8465 | 9.03e-04 | 5.20e-03 | 3.16e-03 | 29 |
| hsa052314 | Colorectum | CRC | Choline metabolism in cancer | 24/1091 | 98/8465 | 1.21e-03 | 9.84e-03 | 6.67e-03 | 24 |
| hsa052315 | Colorectum | CRC | Choline metabolism in cancer | 24/1091 | 98/8465 | 1.21e-03 | 9.84e-03 | 6.67e-03 | 24 |
| hsa052319 | Esophagus | ESCC | Choline metabolism in cancer | 61/4205 | 98/8465 | 7.97e-03 | 1.92e-02 | 9.84e-03 | 61 |
| hsa0523114 | Esophagus | ESCC | Choline metabolism in cancer | 61/4205 | 98/8465 | 7.97e-03 | 1.92e-02 | 9.84e-03 | 61 |
| hsa052316 | Liver | HCC | Choline metabolism in cancer | 57/4020 | 98/8465 | 2.14e-02 | 4.90e-02 | 2.72e-02 | 57 |
| hsa0523111 | Liver | HCC | Choline metabolism in cancer | 57/4020 | 98/8465 | 2.14e-02 | 4.90e-02 | 2.72e-02 | 57 |
| hsa052317 | Lung | IAC | Choline metabolism in cancer | 23/1053 | 98/8465 | 1.72e-03 | 9.66e-03 | 6.41e-03 | 23 |
| hsa0523112 | Lung | IAC | Choline metabolism in cancer | 23/1053 | 98/8465 | 1.72e-03 | 9.66e-03 | 6.41e-03 | 23 |
| hsa0523121 | Lung | AIS | Choline metabolism in cancer | 23/961 | 98/8465 | 4.87e-04 | 4.39e-03 | 2.81e-03 | 23 |
| hsa0523131 | Lung | AIS | Choline metabolism in cancer | 23/961 | 98/8465 | 4.87e-04 | 4.39e-03 | 2.81e-03 | 23 |
| Page: 1 |
Top |
Cell-cell communication analysis |
| Identification of potential cell-cell interactions between two cell types and their ligand-receptor pairs for different disease states |
| Ligand | Receptor | LRpair | Pathway | Tissue | Disease Stage |
| Page: 1 |
Top |
Single-cell gene regulatory network inference analysis |
| Find out the significant the regulons (TFs) and the target genes of each regulon across cell types for different disease states |
| TF | Cell Type | Tissue | Disease Stage | Target Gene | RSS | Regulon Activity |
| ∗The dot plots of a searched regulon are shown for all cell subpopulations in each disease state of each tissue based on the regulon specific score inferred using pySCENIC and by calculating the average expression. |
| Page: 1 |
Top |
Somatic mutation of malignant transformation related genes |
| Annotation of somatic variants for genes involved in malignant transformation |
| Hugo Symbol | Variant Class | Variant Classification | dbSNP RS | HGVSc | HGVSp | HGVSp Short | SWISSPROT | BIOTYPE | SIFT | PolyPhen | Tumor Sample Barcode | Tissue | Histology | Sex | Age | Stage | Therapy Types | Drugs | Outcome |
| SLC44A3 | SNV | Missense_Mutation | c.364G>A | p.Glu122Lys | p.E122K | Q8N4M1 | protein_coding | tolerated(0.28) | benign(0.388) | TCGA-A1-A0SD-01 | Breast | breast invasive carcinoma | Female | <65 | I/II | Unknown | Unknown | SD | |
| SLC44A3 | insertion | In_Frame_Ins | rs753844278 | c.1805_1806insAACAAC | p.Thr603_Asn604insThrThr | p.T603_N604insTT | Q8N4M1 | protein_coding | TCGA-A8-A08C-01 | Breast | breast invasive carcinoma | Female | >=65 | I/II | Chemotherapy | 5-fluorouracil | CR | ||
| SLC44A3 | SNV | Missense_Mutation | c.1451N>A | p.Cys484Tyr | p.C484Y | Q8N4M1 | protein_coding | deleterious(0.02) | benign(0.012) | TCGA-EK-A2R8-01 | Cervix | cervical & endocervical cancer | Female | <65 | I/II | Unknown | Unknown | SD | |
| SLC44A3 | SNV | Missense_Mutation | rs779346651 | c.334C>T | p.Arg112Cys | p.R112C | Q8N4M1 | protein_coding | deleterious(0.01) | benign(0.249) | TCGA-IR-A3LL-01 | Cervix | cervical & endocervical cancer | Female | <65 | I/II | Chemotherapy | cisplatin | CR |
| SLC44A3 | SNV | Missense_Mutation | c.556N>G | p.Cys186Gly | p.C186G | Q8N4M1 | protein_coding | deleterious(0) | probably_damaging(0.997) | TCGA-VS-A9V1-01 | Cervix | cervical & endocervical cancer | Female | <65 | I/II | Chemotherapy | cisplatin | PD | |
| SLC44A3 | SNV | Missense_Mutation | c.371N>G | p.Gln124Arg | p.Q124R | Q8N4M1 | protein_coding | deleterious(0) | probably_damaging(0.968) | TCGA-AA-3715-01 | Colorectum | colon adenocarcinoma | Male | >=65 | I/II | Unknown | Unknown | PD | |
| SLC44A3 | SNV | Missense_Mutation | c.1277N>T | p.Ser426Phe | p.S426F | Q8N4M1 | protein_coding | deleterious(0) | probably_damaging(0.999) | TCGA-AA-A010-01 | Colorectum | colon adenocarcinoma | Female | <65 | I/II | Chemotherapy | folinic | CR | |
| SLC44A3 | SNV | Missense_Mutation | c.1655T>G | p.Leu552Arg | p.L552R | Q8N4M1 | protein_coding | deleterious(0) | probably_damaging(1) | TCGA-AA-A022-01 | Colorectum | colon adenocarcinoma | Female | >=65 | I/II | Unknown | Unknown | SD | |
| SLC44A3 | SNV | Missense_Mutation | c.1332A>C | p.Leu444Phe | p.L444F | Q8N4M1 | protein_coding | tolerated(0.06) | benign(0.067) | TCGA-AD-6890-01 | Colorectum | colon adenocarcinoma | Male | >=65 | I/II | Unknown | Unknown | SD | |
| SLC44A3 | SNV | Missense_Mutation | novel | c.1112N>C | p.Lys371Thr | p.K371T | Q8N4M1 | protein_coding | tolerated(0.15) | benign(0.007) | TCGA-CA-6717-01 | Colorectum | colon adenocarcinoma | Male | <65 | I/II | Chemotherapy | oxaliplatin | CR |
| Page: 1 2 3 4 5 6 |
Top |
Related drugs of malignant transformation related genes |
| Identification of chemicals and drugs interact with genes involved in malignant transfromation |
| (DGIdb 4.0) |
| Entrez ID | Symbol | Category | Interaction Types | Drug Claim Name | Drug Name | PMIDs |
| Page: 1 |

Copyright 2023-Present -The University of Texas Health Science Center at Houston |