
|
|||||
|
 | |
| |
| |
| |
| |
| |
|
Gene: SLC30A5 |
Gene summary for SLC30A5 |
| Gene information | Species | Human | Gene symbol | SLC30A5 | Gene ID | 64924 |
| Gene name | solute carrier family 30 member 5 | |
| Gene Alias | ZNT5 | |
| Cytomap | 5q13.1-q13.2 | |
| Gene Type | protein-coding | GO ID | GO:0000041 | UniProtAcc | Q8TAD4 |
Top |
Malignant transformation analysis |
| Identification of the aberrant gene expression in precancerous and cancerous lesions by comparing the gene expression of stem-like cells in diseased tissues with normal stem cells |
| Entrez ID | Symbol | Replicates | Species | Organ | Tissue | Adj P-value | Log2FC | Malignancy |
| 64924 | SLC30A5 | P21T-E | Human | Esophagus | ESCC | 8.59e-24 | 3.84e-01 | 0.1617 |
| 64924 | SLC30A5 | P22T-E | Human | Esophagus | ESCC | 8.69e-27 | 4.96e-01 | 0.1236 |
| 64924 | SLC30A5 | P23T-E | Human | Esophagus | ESCC | 6.59e-25 | 5.47e-01 | 0.108 |
| 64924 | SLC30A5 | P24T-E | Human | Esophagus | ESCC | 3.54e-14 | 2.03e-01 | 0.1287 |
| 64924 | SLC30A5 | P26T-E | Human | Esophagus | ESCC | 8.51e-25 | 3.59e-01 | 0.1276 |
| 64924 | SLC30A5 | P27T-E | Human | Esophagus | ESCC | 3.61e-26 | 4.44e-01 | 0.1055 |
| 64924 | SLC30A5 | P28T-E | Human | Esophagus | ESCC | 4.37e-16 | 2.20e-01 | 0.1149 |
| 64924 | SLC30A5 | P30T-E | Human | Esophagus | ESCC | 2.48e-27 | 9.25e-01 | 0.137 |
| 64924 | SLC30A5 | P31T-E | Human | Esophagus | ESCC | 6.68e-18 | 2.12e-01 | 0.1251 |
| 64924 | SLC30A5 | P32T-E | Human | Esophagus | ESCC | 2.55e-24 | 4.02e-01 | 0.1666 |
| 64924 | SLC30A5 | P36T-E | Human | Esophagus | ESCC | 4.18e-24 | 7.20e-01 | 0.1187 |
| 64924 | SLC30A5 | P37T-E | Human | Esophagus | ESCC | 1.32e-15 | 2.96e-01 | 0.1371 |
| 64924 | SLC30A5 | P38T-E | Human | Esophagus | ESCC | 6.18e-06 | 1.42e-01 | 0.127 |
| 64924 | SLC30A5 | P39T-E | Human | Esophagus | ESCC | 2.13e-07 | 1.98e-01 | 0.0894 |
| 64924 | SLC30A5 | P40T-E | Human | Esophagus | ESCC | 8.86e-04 | 1.97e-01 | 0.109 |
| 64924 | SLC30A5 | P42T-E | Human | Esophagus | ESCC | 4.96e-10 | 2.51e-01 | 0.1175 |
| 64924 | SLC30A5 | P44T-E | Human | Esophagus | ESCC | 7.43e-12 | 2.45e-01 | 0.1096 |
| 64924 | SLC30A5 | P47T-E | Human | Esophagus | ESCC | 5.58e-16 | 2.67e-01 | 0.1067 |
| 64924 | SLC30A5 | P48T-E | Human | Esophagus | ESCC | 3.43e-20 | 2.35e-01 | 0.0959 |
| 64924 | SLC30A5 | P49T-E | Human | Esophagus | ESCC | 7.99e-09 | 6.70e-01 | 0.1768 |
| Page: 1 2 3 4 5 6 |
| Tissue | Expression Dynamics | Abbreviation |
| Esophagus |  | ESCC: Esophageal squamous cell carcinoma |
| HGIN: High-grade intraepithelial neoplasias | ||
| LGIN: Low-grade intraepithelial neoplasias | ||
| Liver |  | HCC: Hepatocellular carcinoma |
| NAFLD: Non-alcoholic fatty liver disease | ||
| Oral Cavity | 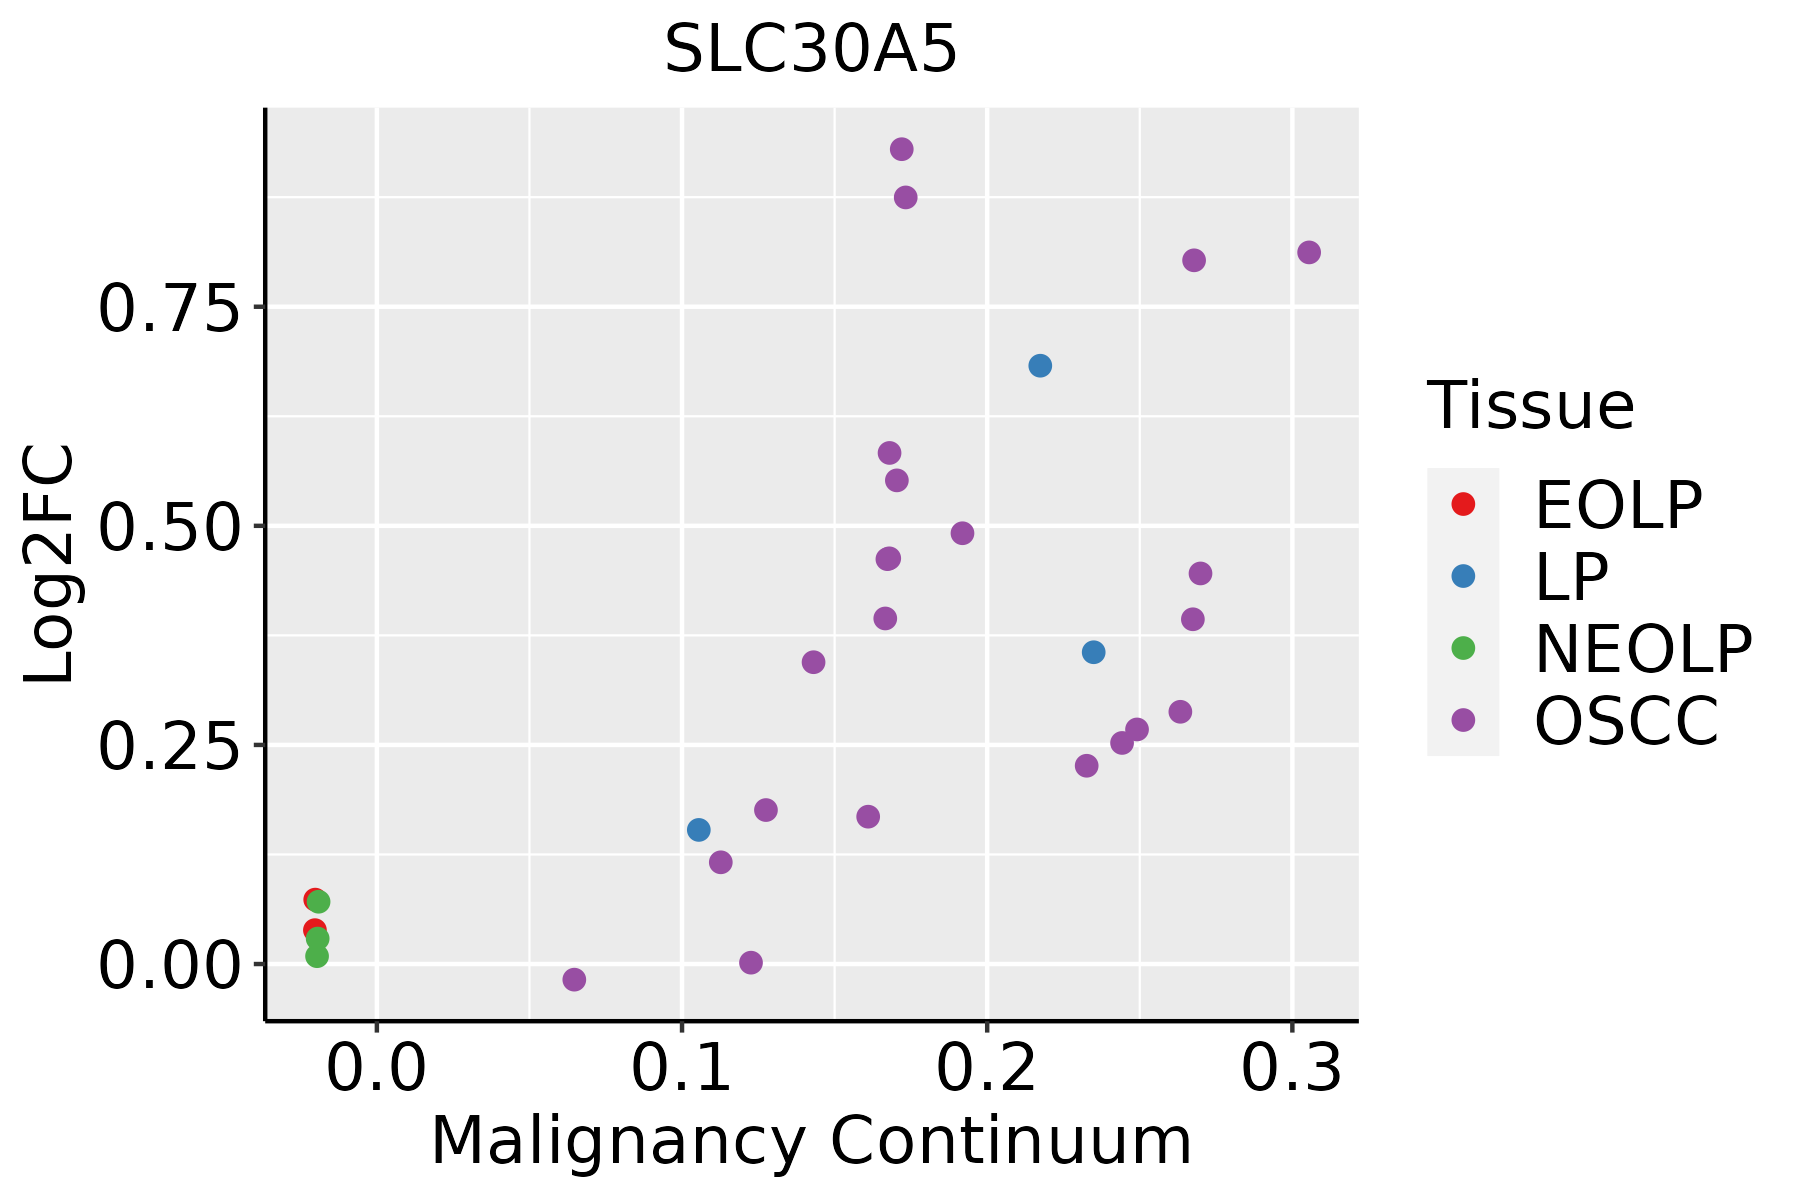 | EOLP: Erosive Oral lichen planus |
| LP: leukoplakia | ||
| NEOLP: Non-erosive oral lichen planus | ||
| OSCC: Oral squamous cell carcinoma | ||
| Skin | 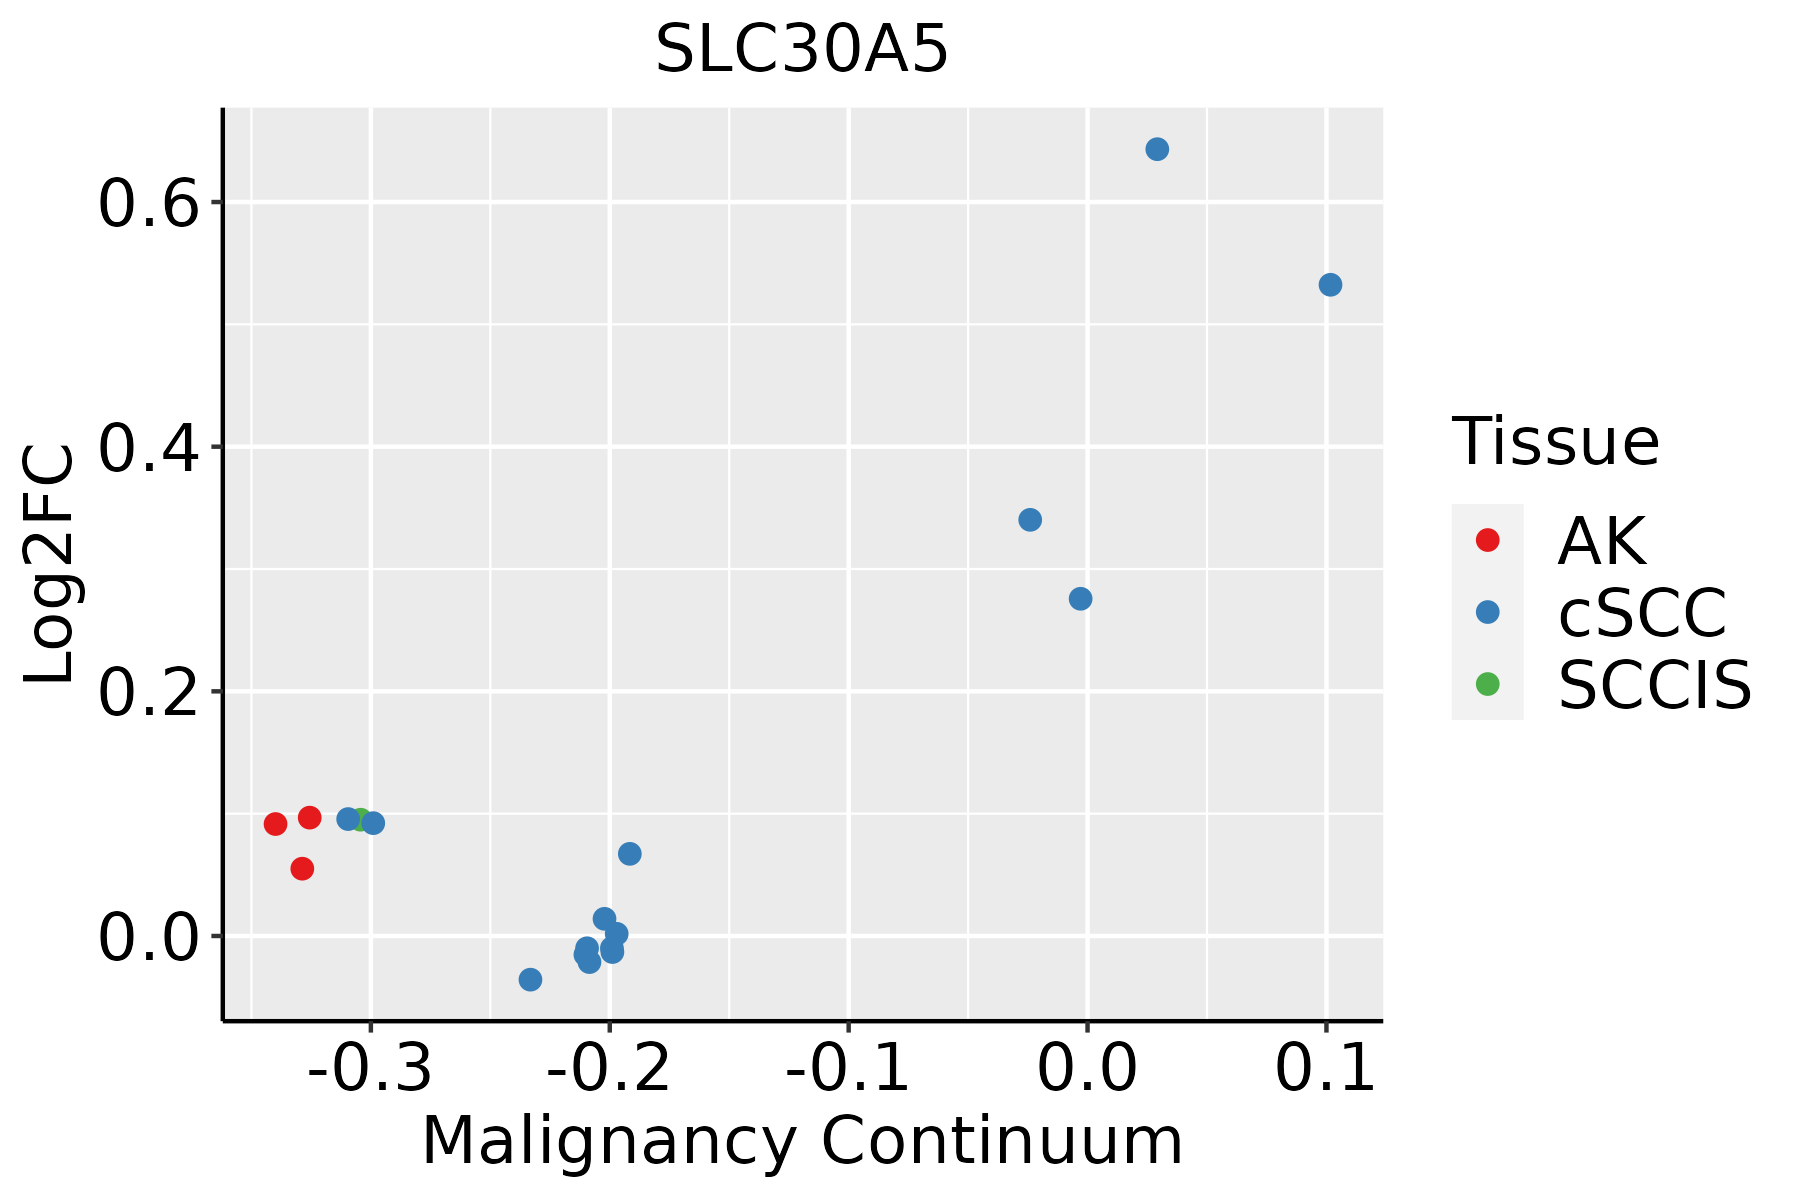 | AK: Actinic keratosis |
| cSCC: Cutaneous squamous cell carcinoma | ||
| SCCIS:squamous cell carcinoma in situ | ||
| Thyroid | 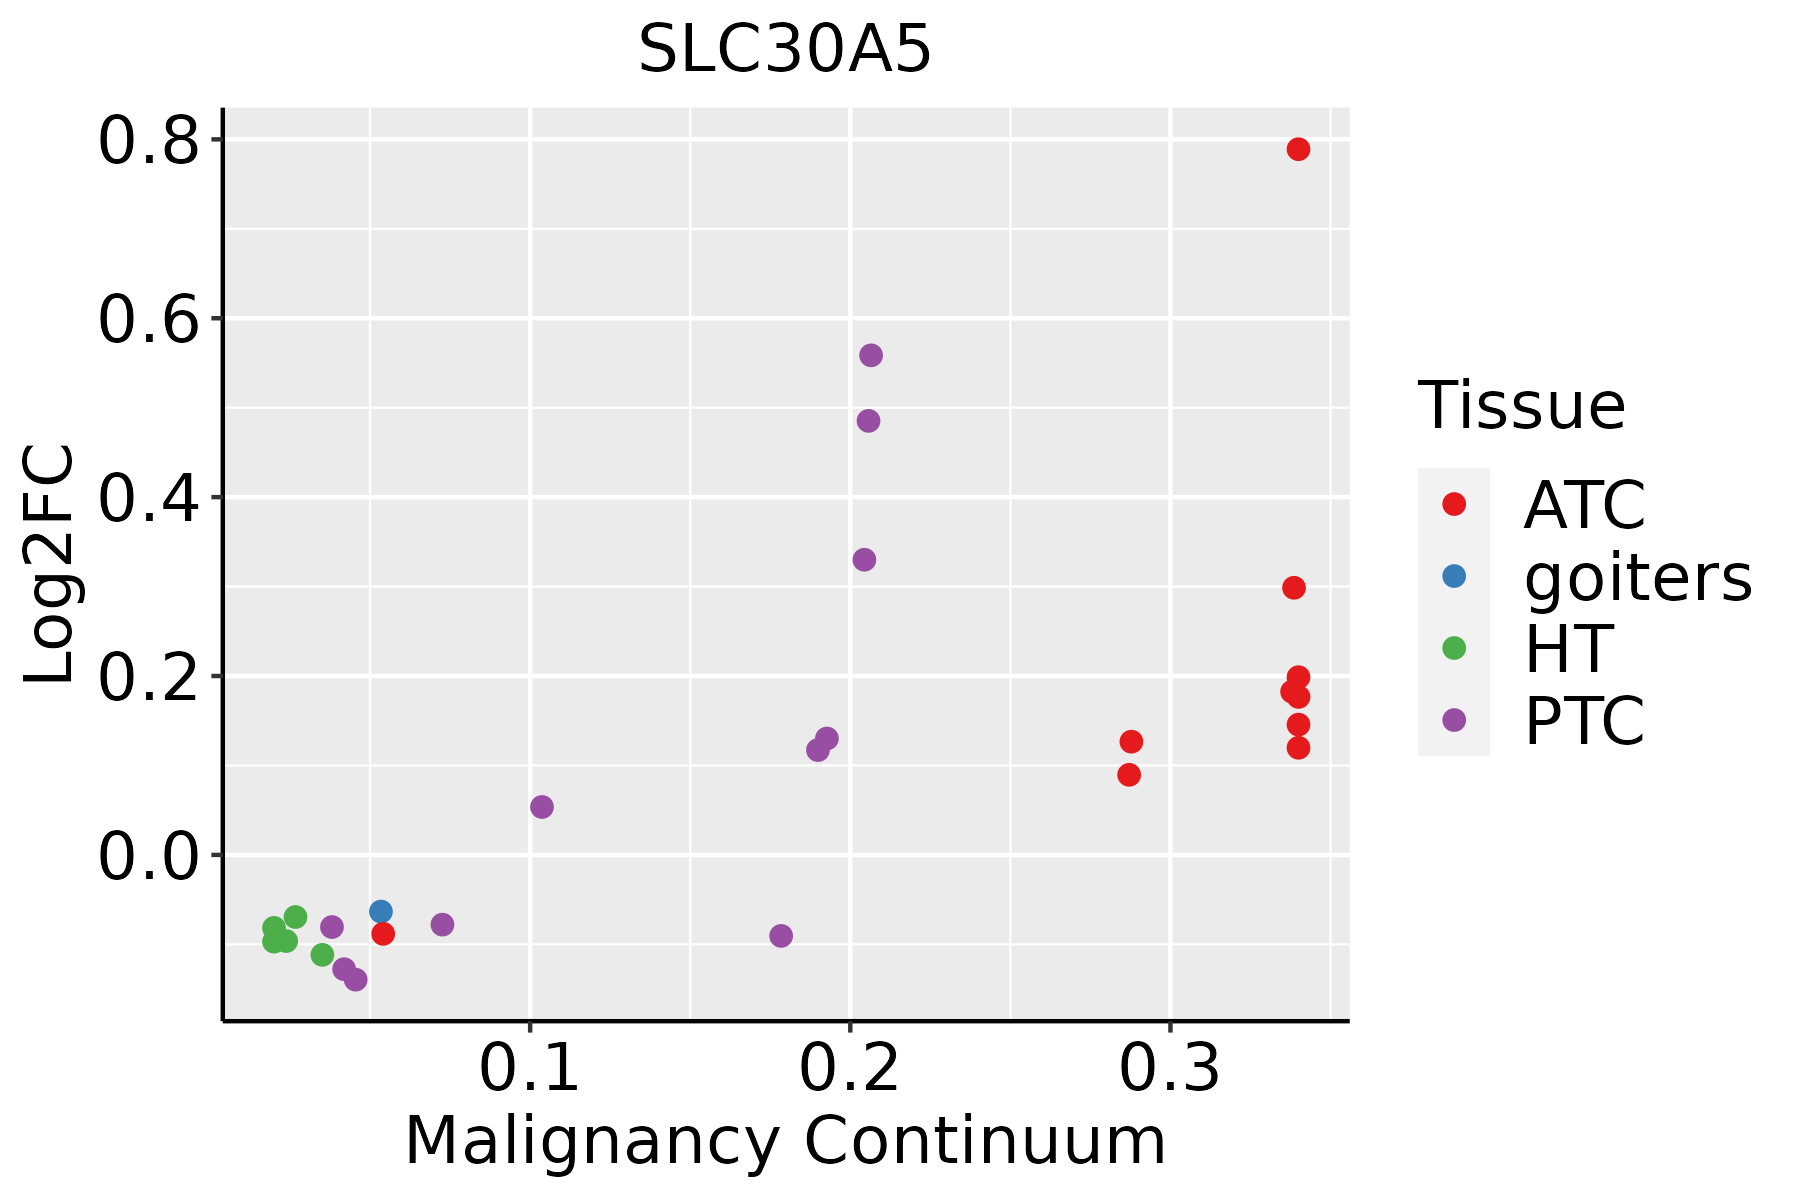 | ATC: Anaplastic thyroid cancer |
| HT: Hashimoto's thyroiditis | ||
| PTC: Papillary thyroid cancer |
| ∗log2FC in expression of this searched gene in stem-like cells from each diseased tissue sample relative to stem-like cells in normal samples in each tissue plotted against the malignancy continuum. Samples are colored based on if they are from different disease stage. |
Top |
Malignant transformation related pathway analysis |
| Find out the enriched GO biological processes and KEGG pathways involved in transition from healthy to precancer to cancer |
| Tissue | Disease Stage | Enriched GO biological Processes |
| Colorectum | AD |  |
| Colorectum | SER |  |
| Colorectum | MSS |  |
| Colorectum | MSI-H |  |
| Colorectum | FAP |  |
| ∗Top 15 enriched GO BP terms are showed in the bar plot of each disease state in each tissue. Each row represents a significant GO biological process which is colored according to the -log10(p.adjust). |
| Page: 1 2 3 4 5 6 7 8 9 |
| GO ID | Tissue | Disease Stage | Description | Gene Ratio | Bg Ratio | pvalue | p.adjust | Count |
| GO:005507617 | Esophagus | ESCC | transition metal ion homeostasis | 87/8552 | 138/18723 | 2.85e-05 | 2.37e-04 | 87 |
| GO:001003827 | Esophagus | ESCC | response to metal ion | 208/8552 | 373/18723 | 5.02e-05 | 3.90e-04 | 208 |
| GO:00469169 | Esophagus | ESCC | cellular transition metal ion homeostasis | 70/8552 | 115/18723 | 7.28e-04 | 3.79e-03 | 70 |
| GO:190260018 | Esophagus | ESCC | proton transmembrane transport | 88/8552 | 157/18723 | 5.62e-03 | 2.10e-02 | 88 |
| GO:001003822 | Liver | HCC | response to metal ion | 208/7958 | 373/18723 | 1.35e-07 | 2.56e-06 | 208 |
| GO:005507612 | Liver | HCC | transition metal ion homeostasis | 81/7958 | 138/18723 | 8.87e-05 | 7.72e-04 | 81 |
| GO:004691611 | Liver | HCC | cellular transition metal ion homeostasis | 67/7958 | 115/18723 | 4.64e-04 | 3.08e-03 | 67 |
| GO:19026007 | Liver | HCC | proton transmembrane transport | 87/7958 | 157/18723 | 7.27e-04 | 4.42e-03 | 87 |
| GO:00000411 | Liver | HCC | transition metal ion transport | 59/7958 | 105/18723 | 3.18e-03 | 1.47e-02 | 59 |
| GO:000688212 | Liver | HCC | cellular zinc ion homeostasis | 24/7958 | 38/18723 | 8.20e-03 | 3.22e-02 | 24 |
| GO:005507610 | Oral cavity | OSCC | transition metal ion homeostasis | 81/7305 | 138/18723 | 2.13e-06 | 2.72e-05 | 81 |
| GO:001003820 | Oral cavity | OSCC | response to metal ion | 188/7305 | 373/18723 | 4.34e-06 | 5.00e-05 | 188 |
| GO:00469168 | Oral cavity | OSCC | cellular transition metal ion homeostasis | 64/7305 | 115/18723 | 2.13e-04 | 1.40e-03 | 64 |
| GO:00550695 | Oral cavity | OSCC | zinc ion homeostasis | 24/7305 | 40/18723 | 5.76e-03 | 2.22e-02 | 24 |
| GO:00068825 | Oral cavity | OSCC | cellular zinc ion homeostasis | 23/7305 | 38/18723 | 5.87e-03 | 2.24e-02 | 23 |
| GO:0010038110 | Oral cavity | LP | response to metal ion | 124/4623 | 373/18723 | 1.09e-04 | 1.31e-03 | 124 |
| GO:005507616 | Oral cavity | LP | transition metal ion homeostasis | 54/4623 | 138/18723 | 1.19e-04 | 1.40e-03 | 54 |
| GO:004691615 | Oral cavity | LP | cellular transition metal ion homeostasis | 46/4623 | 115/18723 | 2.02e-04 | 2.20e-03 | 46 |
| GO:001003829 | Skin | cSCC | response to metal ion | 132/4864 | 373/18723 | 3.11e-05 | 3.42e-04 | 132 |
| GO:005507618 | Skin | cSCC | transition metal ion homeostasis | 57/4864 | 138/18723 | 5.96e-05 | 5.86e-04 | 57 |
| Page: 1 2 |
| Pathway ID | Tissue | Disease Stage | Description | Gene Ratio | Bg Ratio | pvalue | p.adjust | qvalue | Count |
| Page: 1 |
Top |
Cell-cell communication analysis |
| Identification of potential cell-cell interactions between two cell types and their ligand-receptor pairs for different disease states |
| Ligand | Receptor | LRpair | Pathway | Tissue | Disease Stage |
| Page: 1 |
Top |
Single-cell gene regulatory network inference analysis |
| Find out the significant the regulons (TFs) and the target genes of each regulon across cell types for different disease states |
| TF | Cell Type | Tissue | Disease Stage | Target Gene | RSS | Regulon Activity |
| ∗The dot plots of a searched regulon are shown for all cell subpopulations in each disease state of each tissue based on the regulon specific score inferred using pySCENIC and by calculating the average expression. |
| Page: 1 |
Top |
Somatic mutation of malignant transformation related genes |
| Annotation of somatic variants for genes involved in malignant transformation |
| Hugo Symbol | Variant Class | Variant Classification | dbSNP RS | HGVSc | HGVSp | HGVSp Short | SWISSPROT | BIOTYPE | SIFT | PolyPhen | Tumor Sample Barcode | Tissue | Histology | Sex | Age | Stage | Therapy Types | Drugs | Outcome |
| SLC30A5 | SNV | Missense_Mutation | c.1376N>C | p.Leu459Ser | p.L459S | Q8TAD4 | protein_coding | tolerated(0.06) | probably_damaging(0.952) | TCGA-A8-A06Z-01 | Breast | breast invasive carcinoma | Female | >=65 | I/II | Unknown | Unknown | SD | |
| SLC30A5 | SNV | Missense_Mutation | c.1453N>C | p.Glu485Gln | p.E485Q | Q8TAD4 | protein_coding | deleterious(0) | probably_damaging(0.965) | TCGA-AC-A23H-01 | Breast | breast invasive carcinoma | Female | >=65 | I/II | Unknown | Unknown | PD | |
| SLC30A5 | SNV | Missense_Mutation | rs374636012 | c.908N>A | p.Arg303His | p.R303H | Q8TAD4 | protein_coding | deleterious(0.01) | possibly_damaging(0.854) | TCGA-AN-A046-01 | Breast | breast invasive carcinoma | Female | >=65 | I/II | Unknown | Unknown | SD |
| SLC30A5 | SNV | Missense_Mutation | c.2203A>G | p.Met735Val | p.M735V | Q8TAD4 | protein_coding | tolerated(0.24) | possibly_damaging(0.761) | TCGA-AN-A0AK-01 | Breast | breast invasive carcinoma | Female | >=65 | I/II | Unknown | Unknown | SD | |
| SLC30A5 | SNV | Missense_Mutation | c.1363N>C | p.Asp455His | p.D455H | Q8TAD4 | protein_coding | deleterious(0) | probably_damaging(1) | TCGA-AO-A0JC-01 | Breast | breast invasive carcinoma | Female | <65 | I/II | Chemotherapy | fluorouracil | SD | |
| SLC30A5 | SNV | Missense_Mutation | c.1157N>G | p.Asn386Ser | p.N386S | Q8TAD4 | protein_coding | tolerated(0.55) | benign(0.011) | TCGA-BH-A0BJ-01 | Breast | breast invasive carcinoma | Female | <65 | I/II | Chemotherapy | doxorubicin | SD | |
| SLC30A5 | SNV | Missense_Mutation | novel | c.1540N>T | p.Pro514Ser | p.P514S | Q8TAD4 | protein_coding | deleterious(0) | probably_damaging(0.996) | TCGA-BH-A0W7-01 | Breast | breast invasive carcinoma | Female | <65 | I/II | Chemotherapy | taxotere | CR |
| SLC30A5 | SNV | Missense_Mutation | c.604N>A | p.Asp202Asn | p.D202N | Q8TAD4 | protein_coding | deleterious(0) | benign(0.028) | TCGA-BH-A18P-01 | Breast | breast invasive carcinoma | Female | <65 | I/II | Unknown | Unknown | PD | |
| SLC30A5 | SNV | Missense_Mutation | c.604G>A | p.Asp202Asn | p.D202N | Q8TAD4 | protein_coding | deleterious(0) | benign(0.028) | TCGA-C8-A8HP-01 | Breast | breast invasive carcinoma | Female | <65 | III/IV | Chemotherapy | 5-fluorouracil | CR | |
| SLC30A5 | SNV | Missense_Mutation | novel | c.1546N>A | p.Glu516Lys | p.E516K | Q8TAD4 | protein_coding | tolerated(0.26) | benign(0.062) | TCGA-D8-A27G-01 | Breast | breast invasive carcinoma | Female | >=65 | I/II | Unknown | Unknown | SD |
| Page: 1 2 3 4 5 6 |
Top |
Related drugs of malignant transformation related genes |
| Identification of chemicals and drugs interact with genes involved in malignant transfromation |
| (DGIdb 4.0) |
| Entrez ID | Symbol | Category | Interaction Types | Drug Claim Name | Drug Name | PMIDs |
| Page: 1 |

Copyright 2023-Present -The University of Texas Health Science Center at Houston |