
|
|||||
|
 | |
| |
| |
| |
| |
| |
|
Gene: SHC1 |
Gene summary for SHC1 |
| Gene information | Species | Human | Gene symbol | SHC1 | Gene ID | 6464 |
| Gene name | SHC adaptor protein 1 | |
| Gene Alias | SHC | |
| Cytomap | 1q21.3 | |
| Gene Type | protein-coding | GO ID | GO:0000165 | UniProtAcc | P29353 |
Top |
Malignant transformation analysis |
| Identification of the aberrant gene expression in precancerous and cancerous lesions by comparing the gene expression of stem-like cells in diseased tissues with normal stem cells |
| Entrez ID | Symbol | Replicates | Species | Organ | Tissue | Adj P-value | Log2FC | Malignancy |
| 6464 | SHC1 | P19T-E | Human | Esophagus | ESCC | 1.28e-09 | 1.13e+00 | 0.1662 |
| 6464 | SHC1 | P20T-E | Human | Esophagus | ESCC | 1.99e-25 | 6.27e-01 | 0.1124 |
| 6464 | SHC1 | P21T-E | Human | Esophagus | ESCC | 2.27e-57 | 1.57e+00 | 0.1617 |
| 6464 | SHC1 | P22T-E | Human | Esophagus | ESCC | 1.01e-18 | 4.30e-01 | 0.1236 |
| 6464 | SHC1 | P23T-E | Human | Esophagus | ESCC | 1.46e-19 | 5.40e-01 | 0.108 |
| 6464 | SHC1 | P24T-E | Human | Esophagus | ESCC | 1.48e-29 | 8.80e-01 | 0.1287 |
| 6464 | SHC1 | P26T-E | Human | Esophagus | ESCC | 6.39e-34 | 9.38e-01 | 0.1276 |
| 6464 | SHC1 | P27T-E | Human | Esophagus | ESCC | 1.56e-09 | 1.91e-01 | 0.1055 |
| 6464 | SHC1 | P28T-E | Human | Esophagus | ESCC | 1.56e-26 | 5.30e-01 | 0.1149 |
| 6464 | SHC1 | P30T-E | Human | Esophagus | ESCC | 1.20e-44 | 1.79e+00 | 0.137 |
| 6464 | SHC1 | P31T-E | Human | Esophagus | ESCC | 5.88e-22 | 4.92e-01 | 0.1251 |
| 6464 | SHC1 | P32T-E | Human | Esophagus | ESCC | 4.02e-46 | 1.12e+00 | 0.1666 |
| 6464 | SHC1 | P36T-E | Human | Esophagus | ESCC | 4.83e-32 | 1.07e+00 | 0.1187 |
| 6464 | SHC1 | P37T-E | Human | Esophagus | ESCC | 2.28e-27 | 7.70e-01 | 0.1371 |
| 6464 | SHC1 | P38T-E | Human | Esophagus | ESCC | 7.31e-09 | 6.14e-01 | 0.127 |
| 6464 | SHC1 | P39T-E | Human | Esophagus | ESCC | 3.81e-15 | 1.68e-01 | 0.0894 |
| 6464 | SHC1 | P40T-E | Human | Esophagus | ESCC | 4.77e-15 | 6.16e-01 | 0.109 |
| 6464 | SHC1 | P42T-E | Human | Esophagus | ESCC | 1.78e-32 | 8.98e-01 | 0.1175 |
| 6464 | SHC1 | P44T-E | Human | Esophagus | ESCC | 2.60e-14 | 3.74e-01 | 0.1096 |
| 6464 | SHC1 | P47T-E | Human | Esophagus | ESCC | 2.43e-31 | 7.18e-01 | 0.1067 |
| Page: 1 2 3 4 5 6 |
| Tissue | Expression Dynamics | Abbreviation |
| Esophagus | 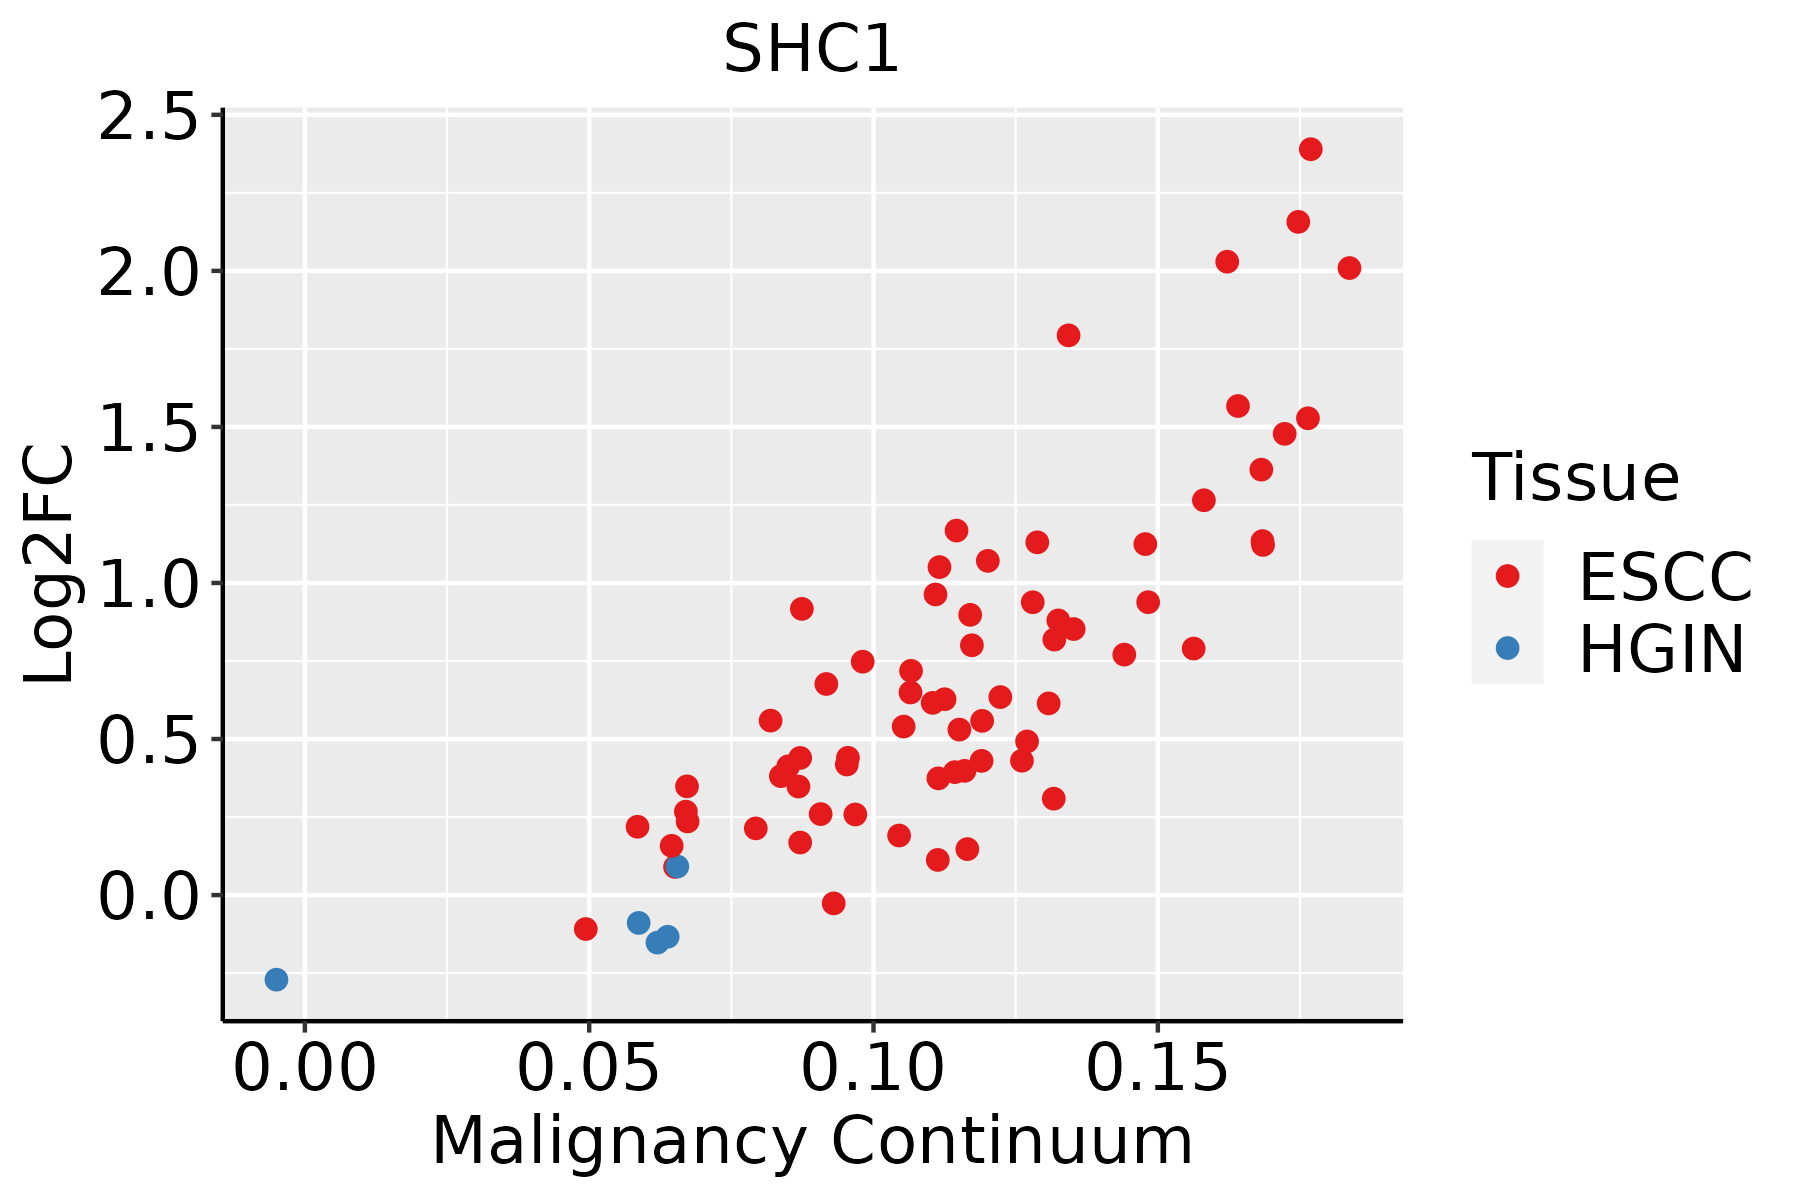 | ESCC: Esophageal squamous cell carcinoma |
| HGIN: High-grade intraepithelial neoplasias | ||
| LGIN: Low-grade intraepithelial neoplasias | ||
| Liver | 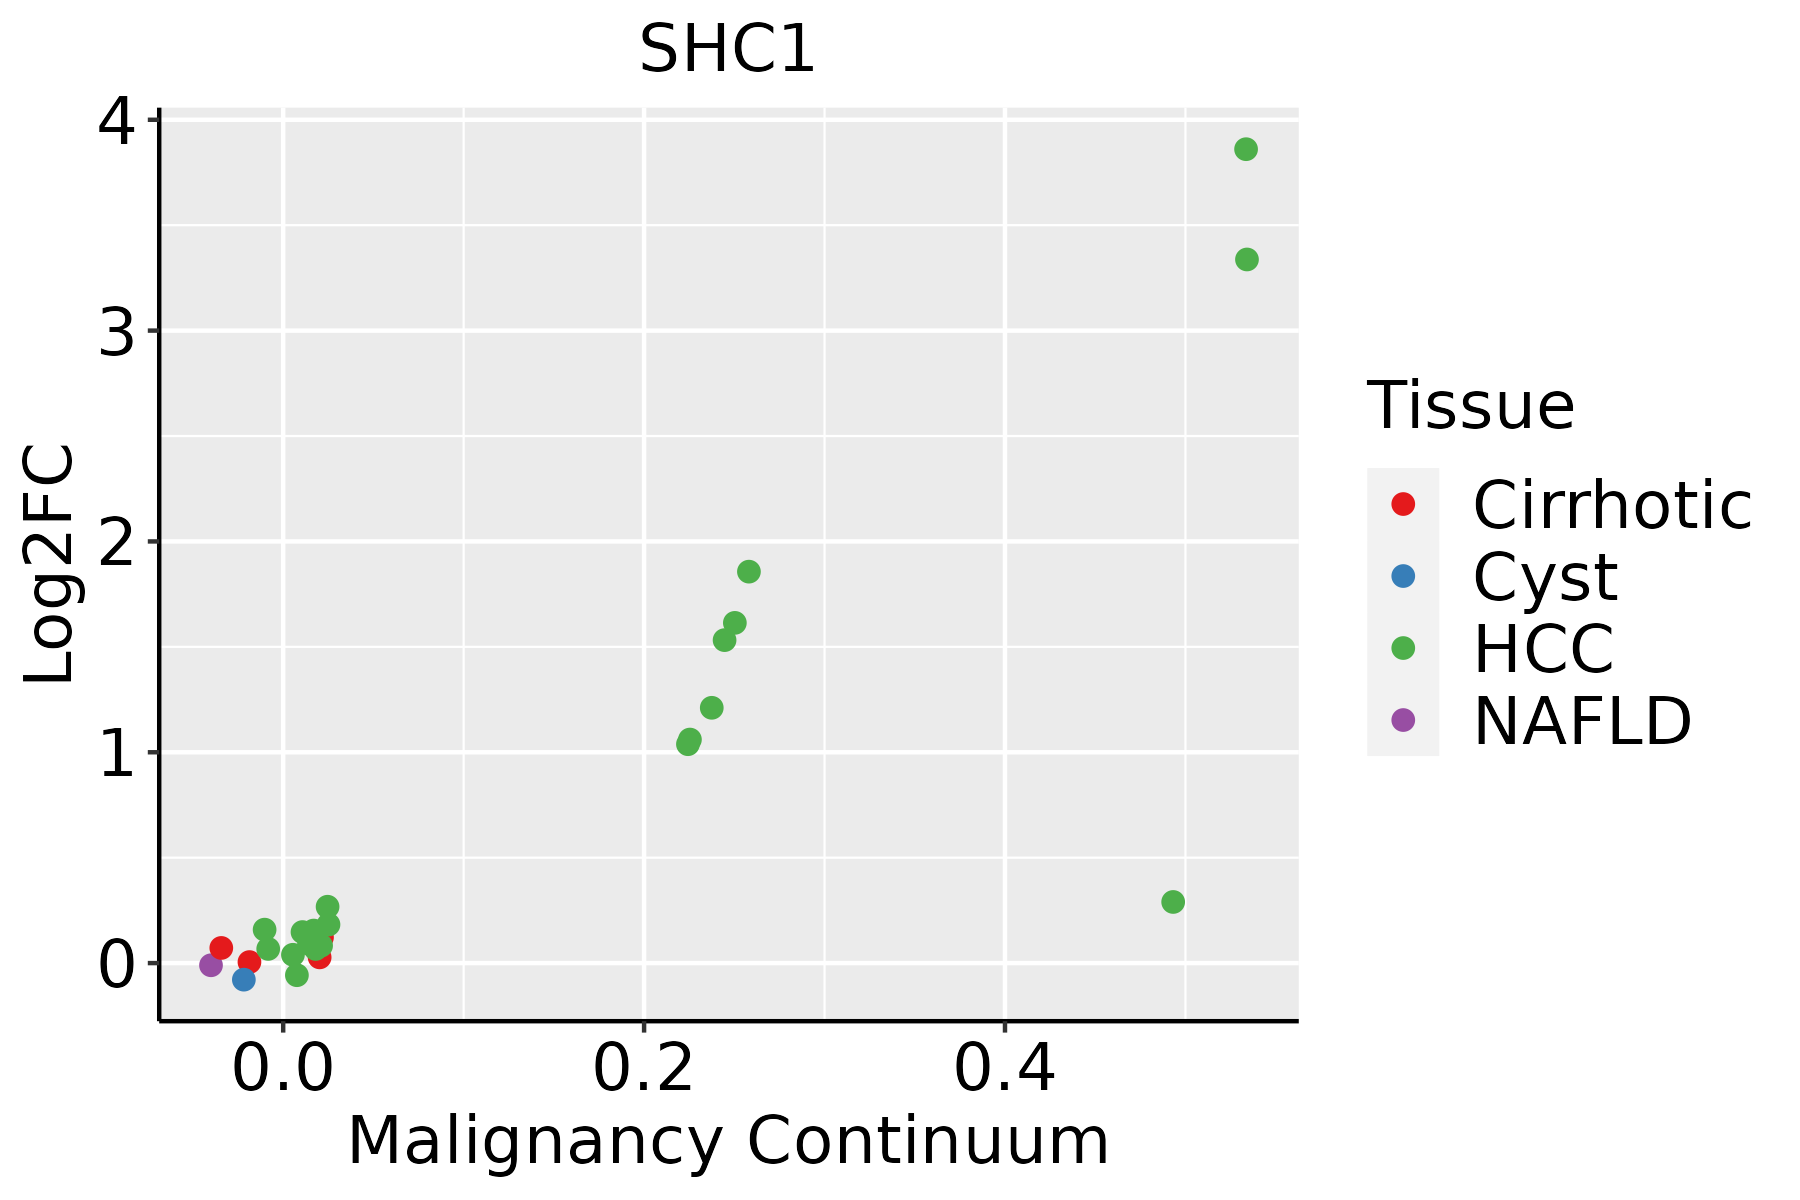 | HCC: Hepatocellular carcinoma |
| NAFLD: Non-alcoholic fatty liver disease | ||
| Oral Cavity |  | EOLP: Erosive Oral lichen planus |
| LP: leukoplakia | ||
| NEOLP: Non-erosive oral lichen planus | ||
| OSCC: Oral squamous cell carcinoma | ||
| Skin | 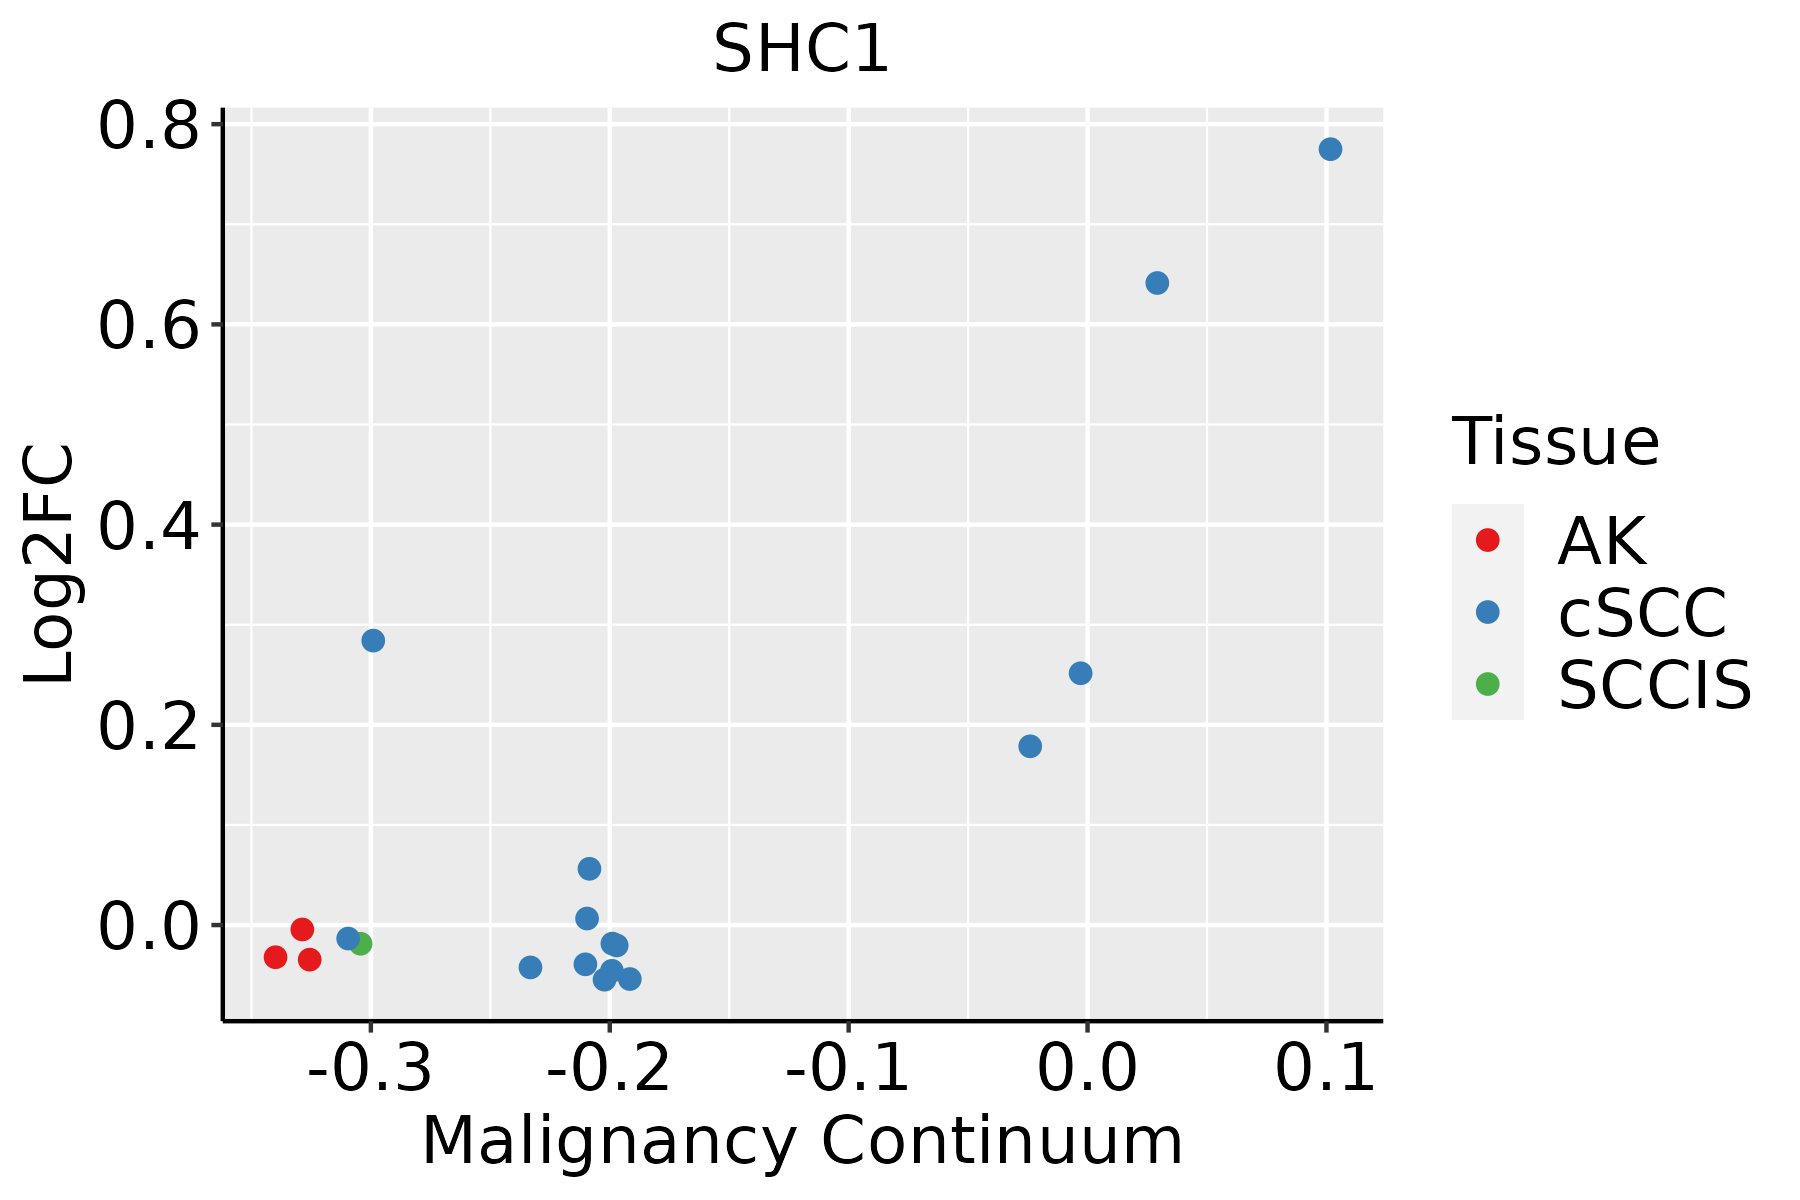 | AK: Actinic keratosis |
| cSCC: Cutaneous squamous cell carcinoma | ||
| SCCIS:squamous cell carcinoma in situ | ||
| Thyroid |  | ATC: Anaplastic thyroid cancer |
| HT: Hashimoto's thyroiditis | ||
| PTC: Papillary thyroid cancer |
| ∗log2FC in expression of this searched gene in stem-like cells from each diseased tissue sample relative to stem-like cells in normal samples in each tissue plotted against the malignancy continuum. Samples are colored based on if they are from different disease stage. |
Top |
Malignant transformation related pathway analysis |
| Find out the enriched GO biological processes and KEGG pathways involved in transition from healthy to precancer to cancer |
| Tissue | Disease Stage | Enriched GO biological Processes |
| Colorectum | AD |  |
| Colorectum | SER |  |
| Colorectum | MSS |  |
| Colorectum | MSI-H |  |
| Colorectum | FAP |  |
| ∗Top 15 enriched GO BP terms are showed in the bar plot of each disease state in each tissue. Each row represents a significant GO biological process which is colored according to the -log10(p.adjust). |
| Page: 1 2 3 4 5 6 7 8 9 |
| GO ID | Tissue | Disease Stage | Description | Gene Ratio | Bg Ratio | pvalue | p.adjust | Count |
| GO:000701510 | Cervix | CC | actin filament organization | 109/2311 | 442/18723 | 4.92e-13 | 2.45e-10 | 109 |
| GO:003297010 | Cervix | CC | regulation of actin filament-based process | 96/2311 | 397/18723 | 4.00e-11 | 8.54e-09 | 96 |
| GO:190290310 | Cervix | CC | regulation of supramolecular fiber organization | 92/2311 | 383/18723 | 1.49e-10 | 2.48e-08 | 92 |
| GO:190332010 | Cervix | CC | regulation of protein modification by small protein conjugation or removal | 66/2311 | 242/18723 | 2.31e-10 | 3.46e-08 | 66 |
| GO:003295610 | Cervix | CC | regulation of actin cytoskeleton organization | 86/2311 | 358/18723 | 5.90e-10 | 7.51e-08 | 86 |
| GO:003139610 | Cervix | CC | regulation of protein ubiquitination | 59/2311 | 210/18723 | 5.90e-10 | 7.51e-08 | 59 |
| GO:004325410 | Cervix | CC | regulation of protein-containing complex assembly | 96/2311 | 428/18723 | 2.91e-09 | 3.05e-07 | 96 |
| GO:011005310 | Cervix | CC | regulation of actin filament organization | 67/2311 | 278/18723 | 4.01e-08 | 2.54e-06 | 67 |
| GO:005125810 | Cervix | CC | protein polymerization | 70/2311 | 297/18723 | 5.20e-08 | 3.11e-06 | 70 |
| GO:003133010 | Cervix | CC | negative regulation of cellular catabolic process | 63/2311 | 262/18723 | 1.10e-07 | 5.68e-06 | 63 |
| GO:003227110 | Cervix | CC | regulation of protein polymerization | 57/2311 | 233/18723 | 2.37e-07 | 1.03e-05 | 57 |
| GO:000989510 | Cervix | CC | negative regulation of catabolic process | 69/2311 | 320/18723 | 2.15e-06 | 6.55e-05 | 69 |
| GO:003133410 | Cervix | CC | positive regulation of protein-containing complex assembly | 55/2311 | 237/18723 | 2.25e-06 | 6.73e-05 | 55 |
| GO:190290510 | Cervix | CC | positive regulation of supramolecular fiber organization | 50/2311 | 209/18723 | 2.55e-06 | 7.54e-05 | 50 |
| GO:005134810 | Cervix | CC | negative regulation of transferase activity | 60/2311 | 268/18723 | 2.77e-06 | 8.02e-05 | 60 |
| GO:004593610 | Cervix | CC | negative regulation of phosphate metabolic process | 88/2311 | 441/18723 | 2.92e-06 | 8.27e-05 | 88 |
| GO:001056310 | Cervix | CC | negative regulation of phosphorus metabolic process | 88/2311 | 442/18723 | 3.21e-06 | 8.77e-05 | 88 |
| GO:00081549 | Cervix | CC | actin polymerization or depolymerization | 51/2311 | 218/18723 | 4.05e-06 | 1.05e-04 | 51 |
| GO:00313467 | Cervix | CC | positive regulation of cell projection organization | 72/2311 | 353/18723 | 1.04e-05 | 2.32e-04 | 72 |
| GO:004232610 | Cervix | CC | negative regulation of phosphorylation | 77/2311 | 385/18723 | 1.09e-05 | 2.38e-04 | 77 |
| Page: 1 2 3 4 5 6 7 8 9 10 11 12 13 14 15 16 17 18 19 |
| Pathway ID | Tissue | Disease Stage | Description | Gene Ratio | Bg Ratio | pvalue | p.adjust | qvalue | Count |
| hsa0522020 | Esophagus | ESCC | Chronic myeloid leukemia | 61/4205 | 76/8465 | 3.20e-08 | 2.68e-07 | 1.37e-07 | 61 |
| hsa05100211 | Esophagus | ESCC | Bacterial invasion of epithelial cells | 59/4205 | 77/8465 | 1.05e-06 | 6.76e-06 | 3.46e-06 | 59 |
| hsa0522518 | Esophagus | ESCC | Hepatocellular carcinoma | 109/4205 | 168/8465 | 4.27e-05 | 1.88e-04 | 9.64e-05 | 109 |
| hsa0472225 | Esophagus | ESCC | Neurotrophin signaling pathway | 80/4205 | 119/8465 | 7.33e-05 | 3.07e-04 | 1.57e-04 | 80 |
| hsa0451020 | Esophagus | ESCC | Focal adhesion | 127/4205 | 203/8465 | 1.25e-04 | 4.99e-04 | 2.56e-04 | 127 |
| hsa049109 | Esophagus | ESCC | Insulin signaling pathway | 89/4205 | 137/8465 | 1.97e-04 | 7.32e-04 | 3.75e-04 | 89 |
| hsa0152110 | Esophagus | ESCC | EGFR tyrosine kinase inhibitor resistance | 55/4205 | 79/8465 | 2.44e-04 | 8.78e-04 | 4.50e-04 | 55 |
| hsa0521417 | Esophagus | ESCC | Glioma | 52/4205 | 75/8465 | 4.20e-04 | 1.45e-03 | 7.43e-04 | 52 |
| hsa049268 | Esophagus | ESCC | Relaxin signaling pathway | 81/4205 | 129/8465 | 1.72e-03 | 5.09e-03 | 2.61e-03 | 81 |
| hsa0401218 | Esophagus | ESCC | ErbB signaling pathway | 56/4205 | 85/8465 | 1.78e-03 | 5.24e-03 | 2.68e-03 | 56 |
| hsa015227 | Esophagus | ESCC | Endocrine resistance | 63/4205 | 98/8465 | 2.38e-03 | 6.58e-03 | 3.37e-03 | 63 |
| hsa05220110 | Esophagus | ESCC | Chronic myeloid leukemia | 61/4205 | 76/8465 | 3.20e-08 | 2.68e-07 | 1.37e-07 | 61 |
| hsa05100310 | Esophagus | ESCC | Bacterial invasion of epithelial cells | 59/4205 | 77/8465 | 1.05e-06 | 6.76e-06 | 3.46e-06 | 59 |
| hsa0522519 | Esophagus | ESCC | Hepatocellular carcinoma | 109/4205 | 168/8465 | 4.27e-05 | 1.88e-04 | 9.64e-05 | 109 |
| hsa04722111 | Esophagus | ESCC | Neurotrophin signaling pathway | 80/4205 | 119/8465 | 7.33e-05 | 3.07e-04 | 1.57e-04 | 80 |
| hsa04510111 | Esophagus | ESCC | Focal adhesion | 127/4205 | 203/8465 | 1.25e-04 | 4.99e-04 | 2.56e-04 | 127 |
| hsa0491014 | Esophagus | ESCC | Insulin signaling pathway | 89/4205 | 137/8465 | 1.97e-04 | 7.32e-04 | 3.75e-04 | 89 |
| hsa0152115 | Esophagus | ESCC | EGFR tyrosine kinase inhibitor resistance | 55/4205 | 79/8465 | 2.44e-04 | 8.78e-04 | 4.50e-04 | 55 |
| hsa0521418 | Esophagus | ESCC | Glioma | 52/4205 | 75/8465 | 4.20e-04 | 1.45e-03 | 7.43e-04 | 52 |
| hsa0492616 | Esophagus | ESCC | Relaxin signaling pathway | 81/4205 | 129/8465 | 1.72e-03 | 5.09e-03 | 2.61e-03 | 81 |
| Page: 1 2 3 4 |
Top |
Cell-cell communication analysis |
| Identification of potential cell-cell interactions between two cell types and their ligand-receptor pairs for different disease states |
| Ligand | Receptor | LRpair | Pathway | Tissue | Disease Stage |
| Page: 1 |
Top |
Single-cell gene regulatory network inference analysis |
| Find out the significant the regulons (TFs) and the target genes of each regulon across cell types for different disease states |
| TF | Cell Type | Tissue | Disease Stage | Target Gene | RSS | Regulon Activity |
| ∗The dot plots of a searched regulon are shown for all cell subpopulations in each disease state of each tissue based on the regulon specific score inferred using pySCENIC and by calculating the average expression. |
| Page: 1 |
Top |
Somatic mutation of malignant transformation related genes |
| Annotation of somatic variants for genes involved in malignant transformation |
| Hugo Symbol | Variant Class | Variant Classification | dbSNP RS | HGVSc | HGVSp | HGVSp Short | SWISSPROT | BIOTYPE | SIFT | PolyPhen | Tumor Sample Barcode | Tissue | Histology | Sex | Age | Stage | Therapy Types | Drugs | Outcome |
| SHC1 | SNV | Missense_Mutation | c.556N>G | p.Gln186Glu | p.Q186E | P29353 | protein_coding | deleterious(0) | probably_damaging(0.932) | TCGA-AN-A0XW-01 | Breast | breast invasive carcinoma | Female | <65 | III/IV | Unknown | Unknown | SD | |
| SHC1 | SNV | Missense_Mutation | c.1280N>G | p.Ser427Cys | p.S427C | P29353 | protein_coding | tolerated(0.31) | benign(0.01) | TCGA-BH-A18U-01 | Breast | breast invasive carcinoma | Female | >=65 | III/IV | Unknown | Unknown | SD | |
| SHC1 | SNV | Missense_Mutation | rs780262070 | c.1133G>A | p.Arg378Gln | p.R378Q | P29353 | protein_coding | tolerated(0.61) | benign(0.09) | TCGA-GM-A2DD-01 | Breast | breast invasive carcinoma | Female | <65 | I/II | Chemotherapy | fluorouracil | CR |
| SHC1 | SNV | Missense_Mutation | novel | c.1069N>A | p.Glu357Lys | p.E357K | P29353 | protein_coding | tolerated(0.17) | benign(0.408) | TCGA-C5-A8XK-01 | Cervix | cervical & endocervical cancer | Female | <65 | I/II | Chemotherapy | cisplatin | SD |
| SHC1 | SNV | Missense_Mutation | novel | c.880N>C | p.Glu294Gln | p.E294Q | P29353 | protein_coding | deleterious(0) | possibly_damaging(0.9) | TCGA-C5-A8XK-01 | Cervix | cervical & endocervical cancer | Female | <65 | I/II | Chemotherapy | cisplatin | SD |
| SHC1 | SNV | Missense_Mutation | c.456C>A | p.Asn152Lys | p.N152K | P29353 | protein_coding | tolerated(0.08) | benign(0.31) | TCGA-FU-A2QG-01 | Cervix | cervical & endocervical cancer | Female | <65 | I/II | Unknown | Unknown | SD | |
| SHC1 | SNV | Missense_Mutation | c.430N>T | p.Pro144Ser | p.P144S | P29353 | protein_coding | deleterious(0.03) | benign(0.143) | TCGA-AA-3811-01 | Colorectum | colon adenocarcinoma | Female | >=65 | III/IV | Unknown | Unknown | PD | |
| SHC1 | SNV | Missense_Mutation | rs780518716 | c.1745G>A | p.Arg582Gln | p.R582Q | P29353 | protein_coding | deleterious(0.02) | benign(0.422) | TCGA-CM-6162-01 | Colorectum | colon adenocarcinoma | Female | <65 | III/IV | Chemotherapy | oxaliplatin | SD |
| SHC1 | SNV | Missense_Mutation | c.1485C>G | p.Ser495Arg | p.S495R | P29353 | protein_coding | deleterious(0) | possibly_damaging(0.773) | TCGA-D5-6533-01 | Colorectum | colon adenocarcinoma | Female | >=65 | I/II | Chemotherapy | oxaliplatin | CR | |
| SHC1 | SNV | Missense_Mutation | rs116278635 | c.1396N>A | p.Glu466Lys | p.E466K | P29353 | protein_coding | deleterious(0.01) | possibly_damaging(0.766) | TCGA-EI-6917-01 | Colorectum | rectum adenocarcinoma | Male | <65 | III/IV | Chemotherapy | 5fluorouracil+oxaciplatina+l-folinian | SD |
| Page: 1 2 3 4 5 6 7 8 |
Top |
Related drugs of malignant transformation related genes |
| Identification of chemicals and drugs interact with genes involved in malignant transfromation |
| (DGIdb 4.0) |
| Entrez ID | Symbol | Category | Interaction Types | Drug Claim Name | Drug Name | PMIDs |
| Page: 1 |

Copyright 2023-Present -The University of Texas Health Science Center at Houston |