
|
|||||
|
 | |
| |
| |
| |
| |
| |
|
Gene: SEZ6L2 |
Gene summary for SEZ6L2 |
| Gene information | Species | Human | Gene symbol | SEZ6L2 | Gene ID | 26470 |
| Gene name | seizure related 6 homolog like 2 | |
| Gene Alias | BSRPA | |
| Cytomap | 16p11.2 | |
| Gene Type | protein-coding | GO ID | GO:0005575 | UniProtAcc | Q6UXD5 |
Top |
Malignant transformation analysis |
| Identification of the aberrant gene expression in precancerous and cancerous lesions by comparing the gene expression of stem-like cells in diseased tissues with normal stem cells |
| Entrez ID | Symbol | Replicates | Species | Organ | Tissue | Adj P-value | Log2FC | Malignancy |
| 26470 | SEZ6L2 | P24T-E | Human | Esophagus | ESCC | 5.59e-11 | 1.06e-01 | 0.1287 |
| 26470 | SEZ6L2 | P26T-E | Human | Esophagus | ESCC | 3.70e-17 | 3.53e-01 | 0.1276 |
| 26470 | SEZ6L2 | P27T-E | Human | Esophagus | ESCC | 5.48e-03 | 9.05e-02 | 0.1055 |
| 26470 | SEZ6L2 | P28T-E | Human | Esophagus | ESCC | 1.46e-06 | 2.02e-01 | 0.1149 |
| 26470 | SEZ6L2 | P32T-E | Human | Esophagus | ESCC | 1.14e-21 | 4.98e-01 | 0.1666 |
| 26470 | SEZ6L2 | P36T-E | Human | Esophagus | ESCC | 2.21e-03 | 2.46e-01 | 0.1187 |
| 26470 | SEZ6L2 | P37T-E | Human | Esophagus | ESCC | 2.98e-20 | 4.35e-01 | 0.1371 |
| 26470 | SEZ6L2 | P39T-E | Human | Esophagus | ESCC | 9.35e-08 | 9.31e-02 | 0.0894 |
| 26470 | SEZ6L2 | P40T-E | Human | Esophagus | ESCC | 4.84e-09 | 1.78e-01 | 0.109 |
| 26470 | SEZ6L2 | P42T-E | Human | Esophagus | ESCC | 3.45e-10 | 2.67e-01 | 0.1175 |
| 26470 | SEZ6L2 | P44T-E | Human | Esophagus | ESCC | 1.71e-07 | 1.66e-01 | 0.1096 |
| 26470 | SEZ6L2 | P47T-E | Human | Esophagus | ESCC | 1.14e-20 | 4.88e-01 | 0.1067 |
| 26470 | SEZ6L2 | P48T-E | Human | Esophagus | ESCC | 3.07e-10 | 2.49e-01 | 0.0959 |
| 26470 | SEZ6L2 | P49T-E | Human | Esophagus | ESCC | 1.65e-08 | 9.17e-01 | 0.1768 |
| 26470 | SEZ6L2 | P52T-E | Human | Esophagus | ESCC | 1.33e-09 | 1.94e-01 | 0.1555 |
| 26470 | SEZ6L2 | P54T-E | Human | Esophagus | ESCC | 8.37e-11 | 2.53e-01 | 0.0975 |
| 26470 | SEZ6L2 | P56T-E | Human | Esophagus | ESCC | 1.06e-07 | 1.14e+00 | 0.1613 |
| 26470 | SEZ6L2 | P57T-E | Human | Esophagus | ESCC | 8.35e-26 | 6.72e-01 | 0.0926 |
| 26470 | SEZ6L2 | P61T-E | Human | Esophagus | ESCC | 1.42e-13 | 2.89e-01 | 0.099 |
| 26470 | SEZ6L2 | P62T-E | Human | Esophagus | ESCC | 5.42e-44 | 8.54e-01 | 0.1302 |
| Page: 1 2 3 4 5 6 |
| Tissue | Expression Dynamics | Abbreviation |
| Esophagus | 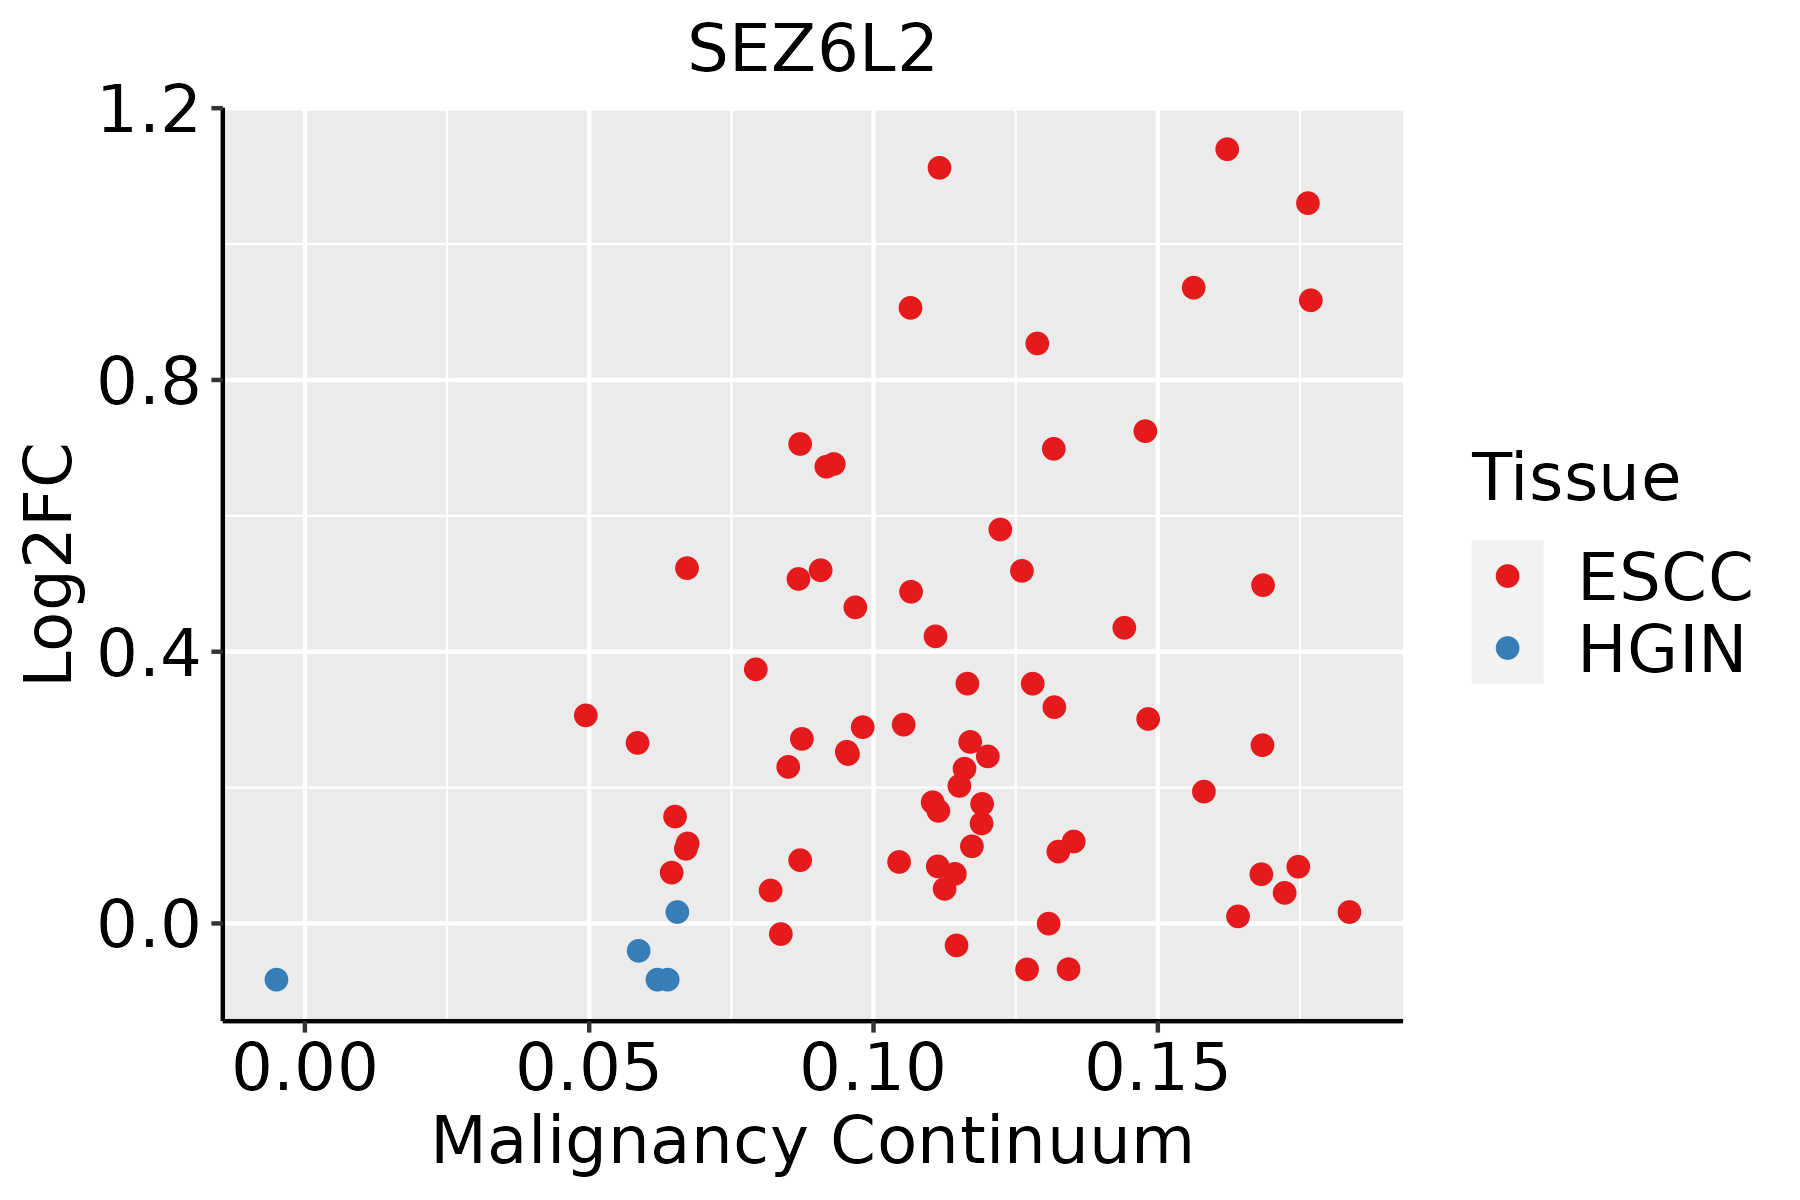 | ESCC: Esophageal squamous cell carcinoma |
| HGIN: High-grade intraepithelial neoplasias | ||
| LGIN: Low-grade intraepithelial neoplasias | ||
| Liver | 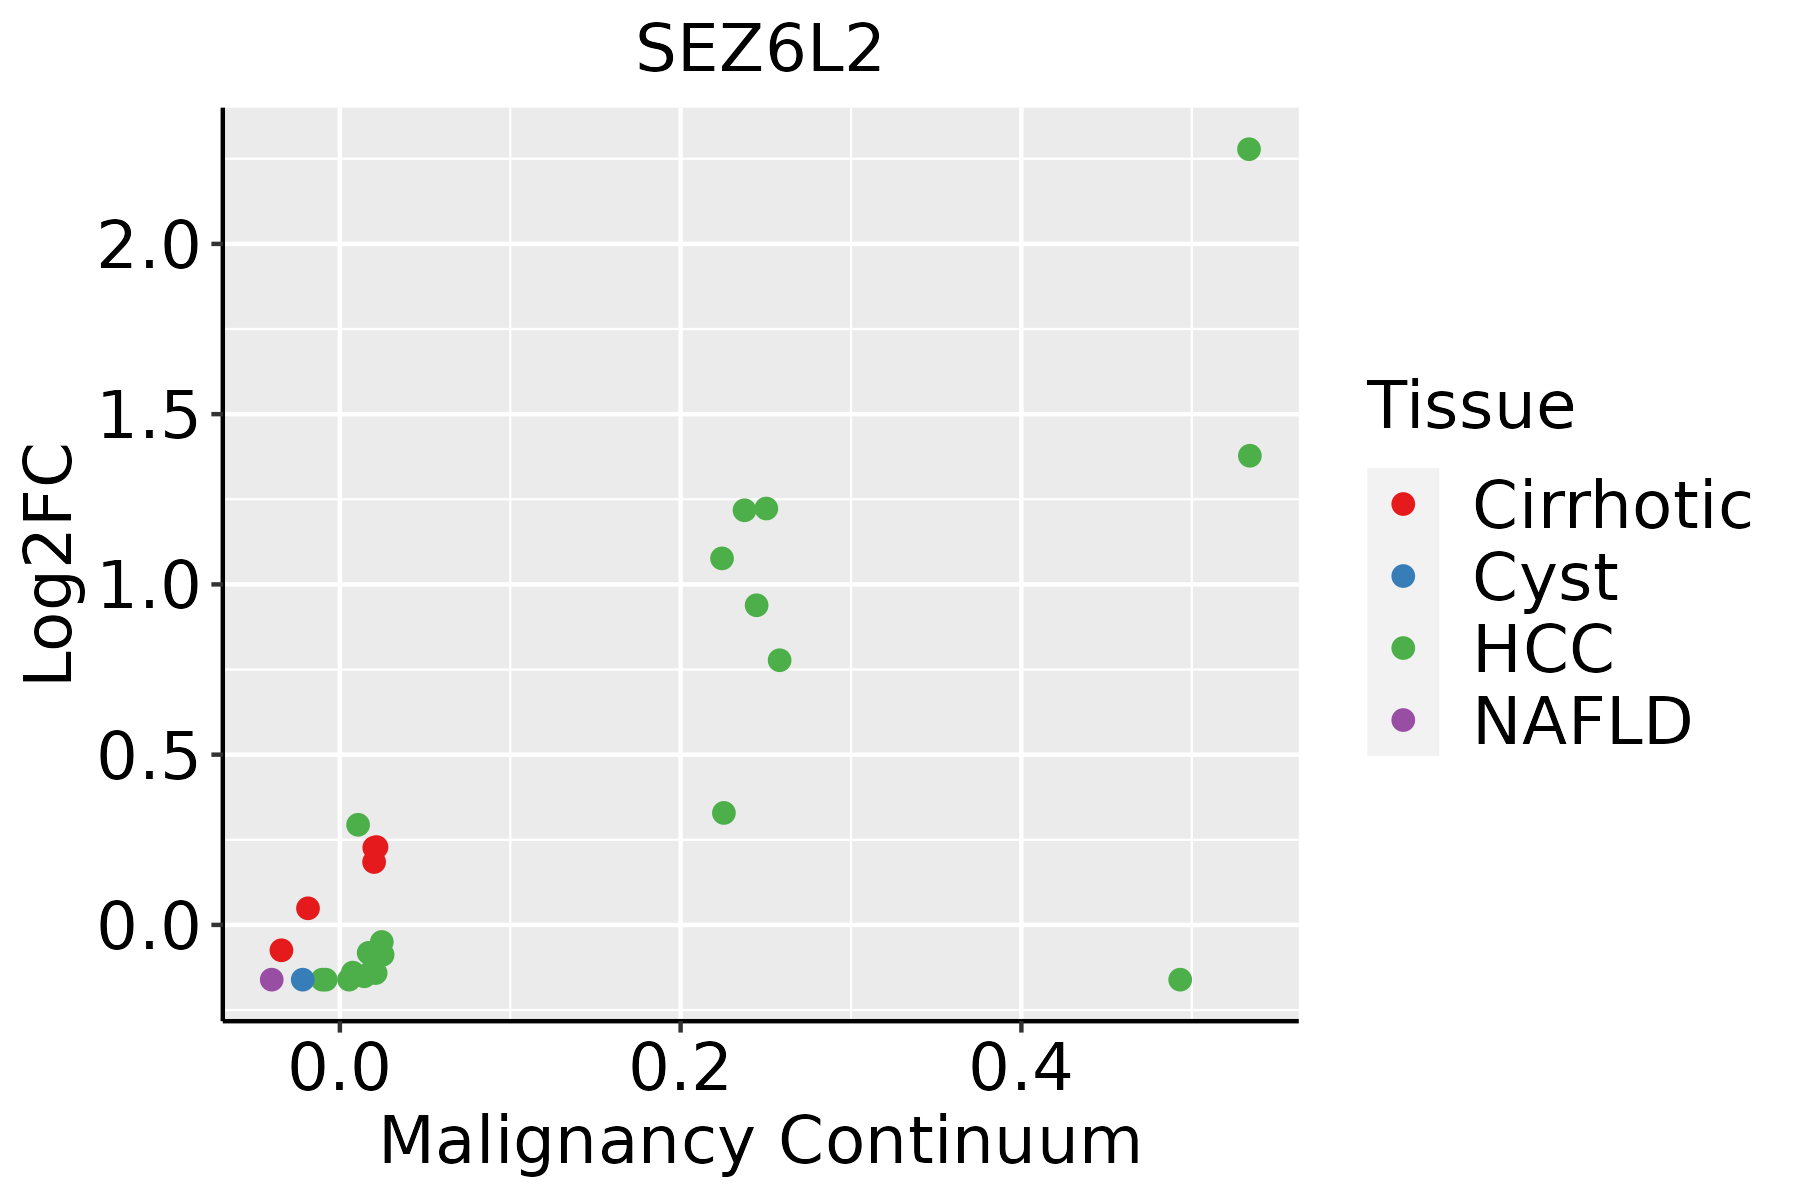 | HCC: Hepatocellular carcinoma |
| NAFLD: Non-alcoholic fatty liver disease | ||
| Oral Cavity | 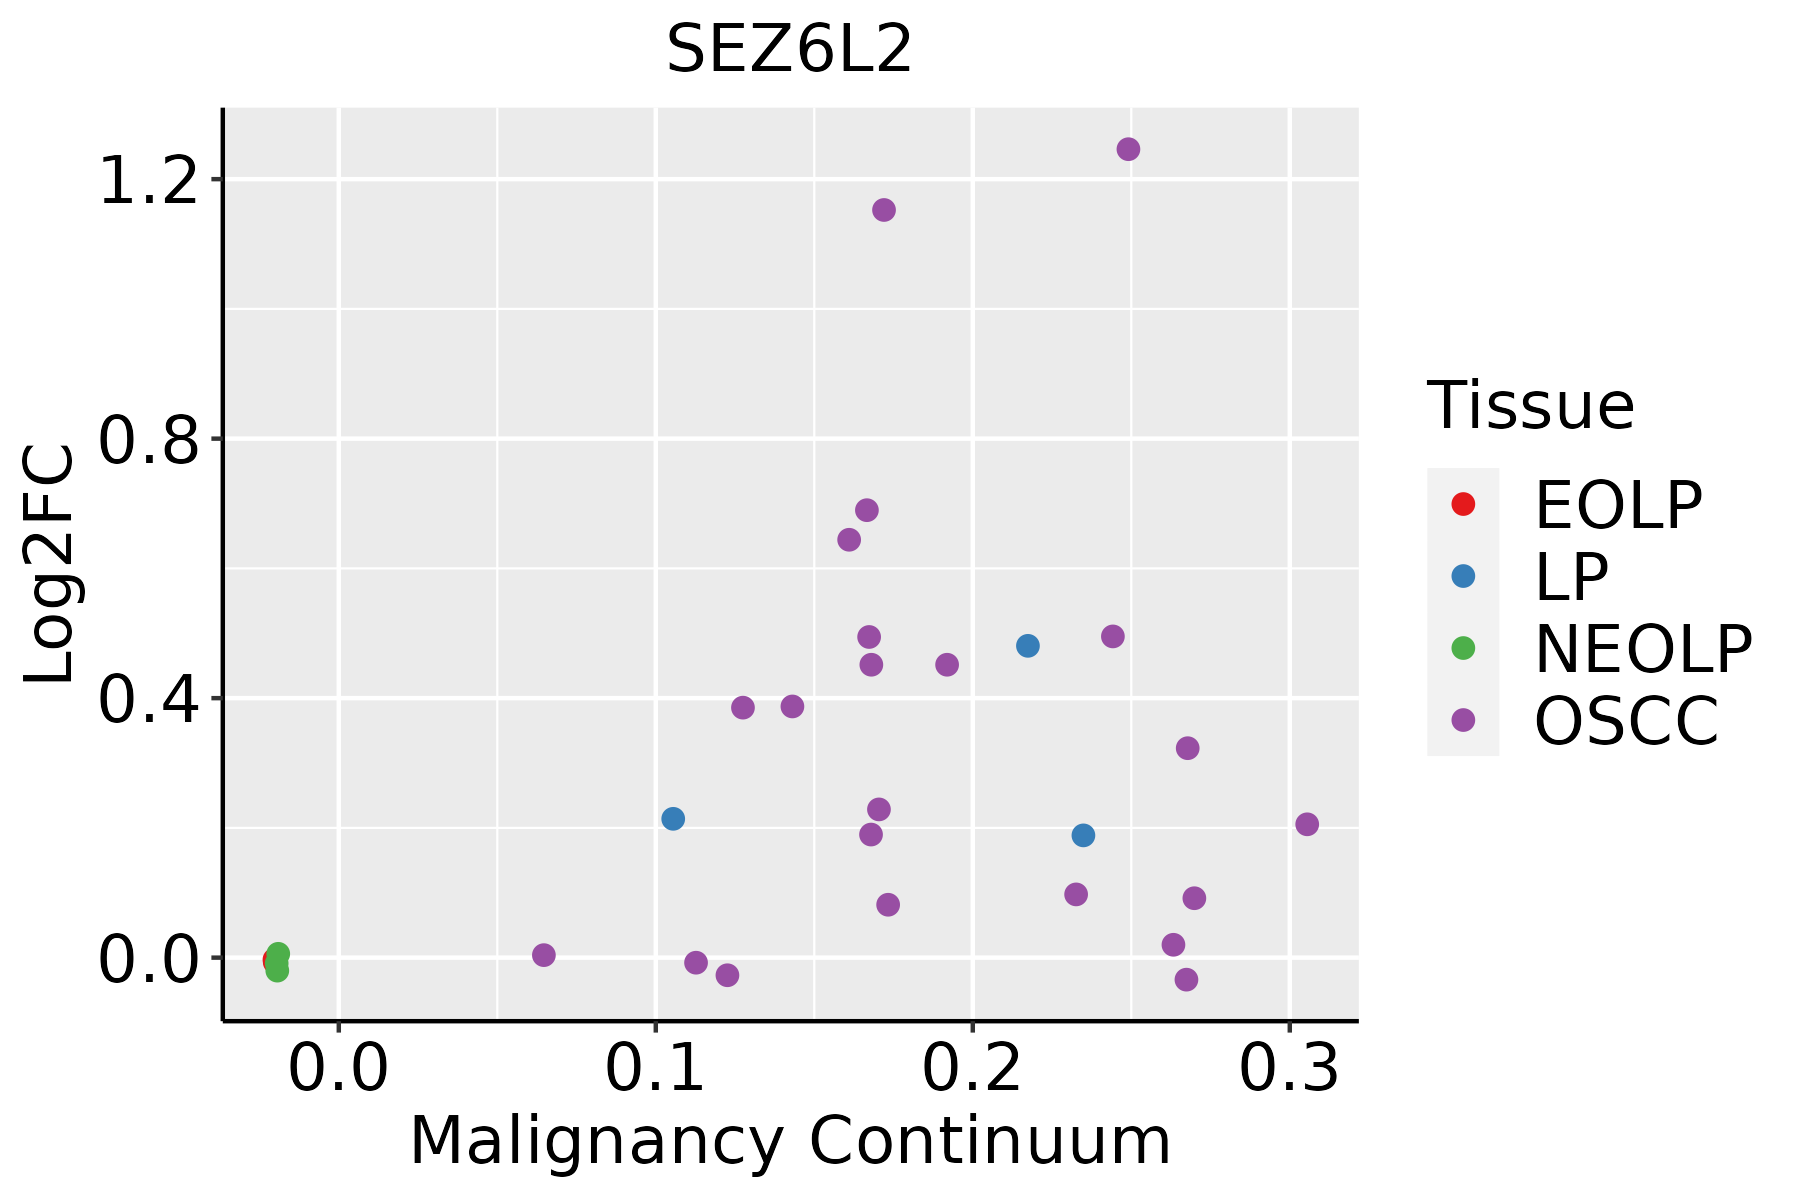 | EOLP: Erosive Oral lichen planus |
| LP: leukoplakia | ||
| NEOLP: Non-erosive oral lichen planus | ||
| OSCC: Oral squamous cell carcinoma | ||
| Prostate | 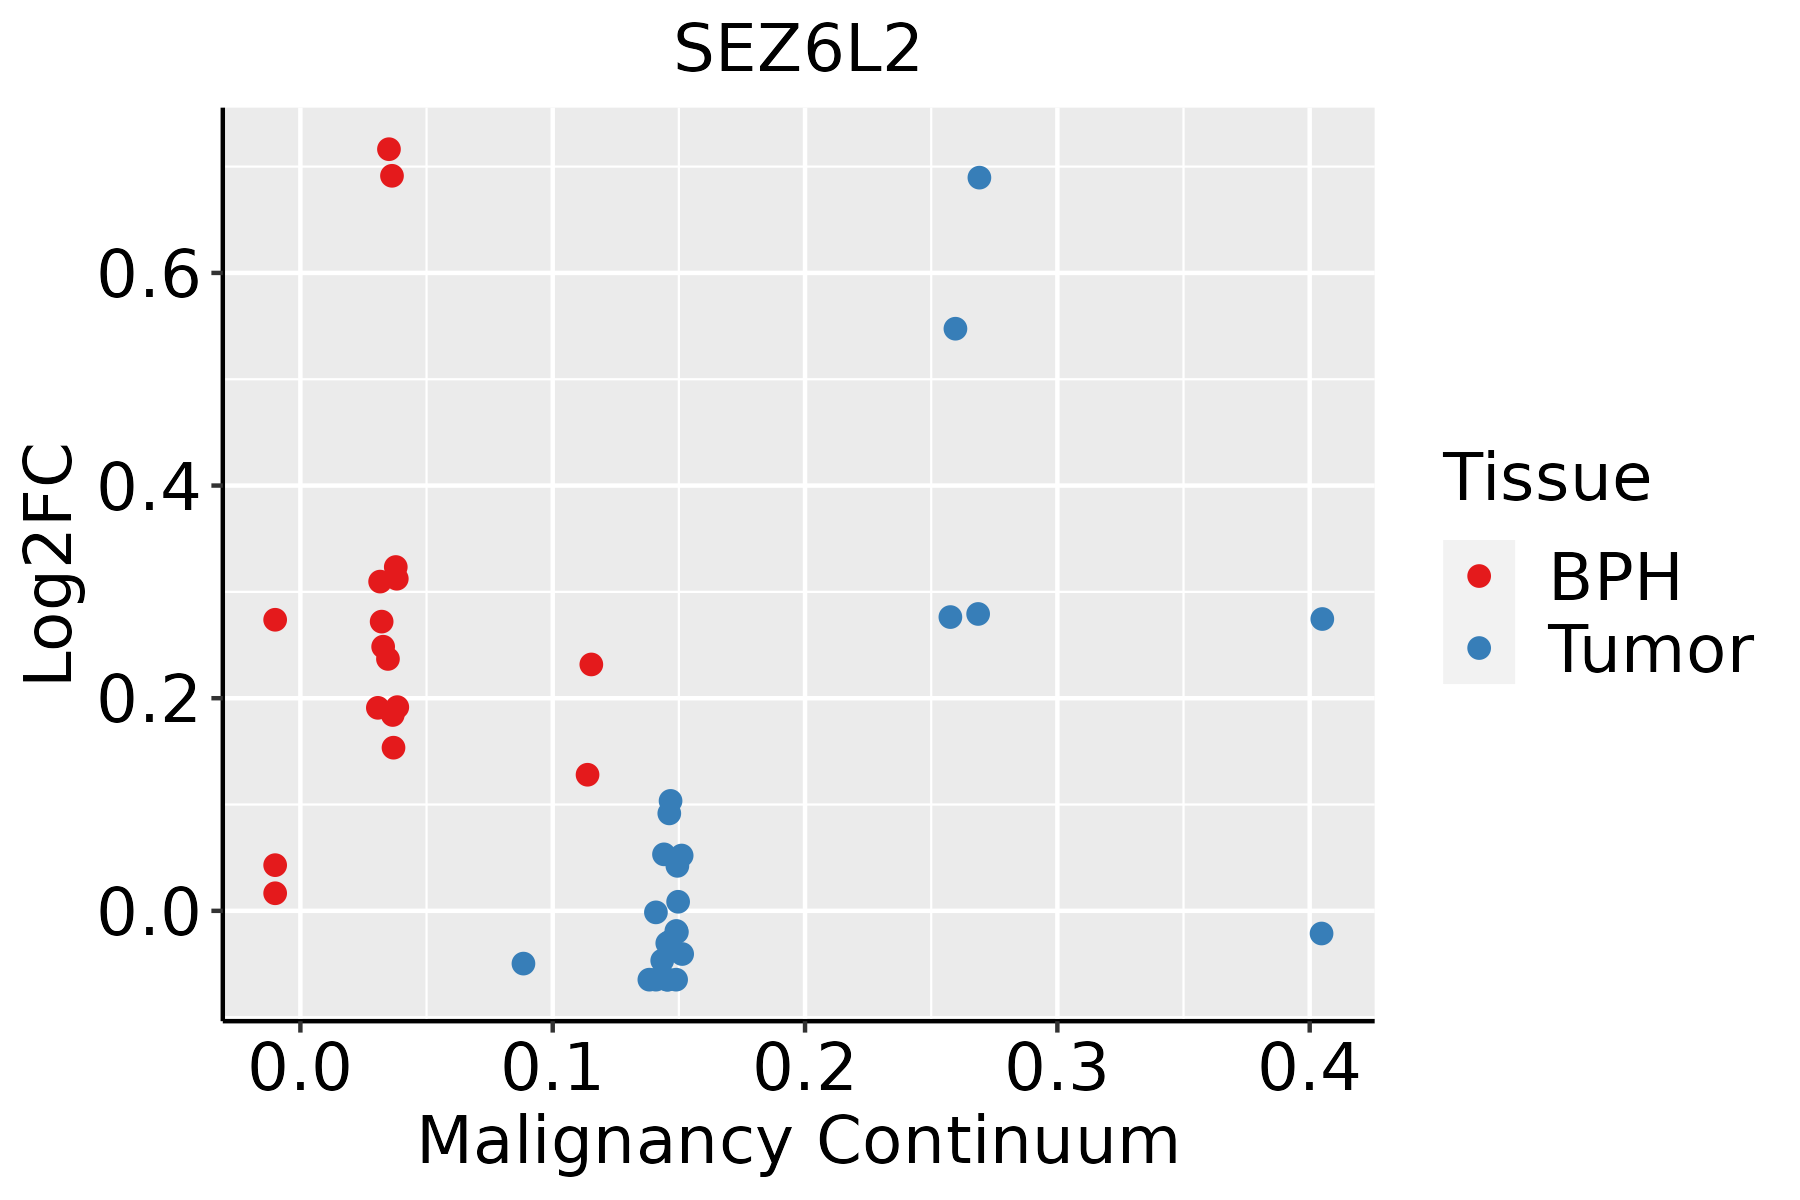 | BPH: Benign Prostatic Hyperplasia |
| Thyroid |  | ATC: Anaplastic thyroid cancer |
| HT: Hashimoto's thyroiditis | ||
| PTC: Papillary thyroid cancer |
| ∗log2FC in expression of this searched gene in stem-like cells from each diseased tissue sample relative to stem-like cells in normal samples in each tissue plotted against the malignancy continuum. Samples are colored based on if they are from different disease stage. |
Top |
Malignant transformation related pathway analysis |
| Find out the enriched GO biological processes and KEGG pathways involved in transition from healthy to precancer to cancer |
| Tissue | Disease Stage | Enriched GO biological Processes |
| Colorectum | AD |  |
| Colorectum | SER |  |
| Colorectum | MSS |  |
| Colorectum | MSI-H |  |
| Colorectum | FAP |  |
| ∗Top 15 enriched GO BP terms are showed in the bar plot of each disease state in each tissue. Each row represents a significant GO biological process which is colored according to the -log10(p.adjust). |
| Page: 1 2 3 4 5 6 7 8 9 |
| GO ID | Tissue | Disease Stage | Description | Gene Ratio | Bg Ratio | pvalue | p.adjust | Count |
| Page: 1 |
| Pathway ID | Tissue | Disease Stage | Description | Gene Ratio | Bg Ratio | pvalue | p.adjust | qvalue | Count |
| Page: 1 |
Top |
Cell-cell communication analysis |
| Identification of potential cell-cell interactions between two cell types and their ligand-receptor pairs for different disease states |
| Ligand | Receptor | LRpair | Pathway | Tissue | Disease Stage |
| Page: 1 |
Top |
Single-cell gene regulatory network inference analysis |
| Find out the significant the regulons (TFs) and the target genes of each regulon across cell types for different disease states |
| TF | Cell Type | Tissue | Disease Stage | Target Gene | RSS | Regulon Activity |
| ∗The dot plots of a searched regulon are shown for all cell subpopulations in each disease state of each tissue based on the regulon specific score inferred using pySCENIC and by calculating the average expression. |
| Page: 1 |
Top |
Somatic mutation of malignant transformation related genes |
| Annotation of somatic variants for genes involved in malignant transformation |
| Hugo Symbol | Variant Class | Variant Classification | dbSNP RS | HGVSc | HGVSp | HGVSp Short | SWISSPROT | BIOTYPE | SIFT | PolyPhen | Tumor Sample Barcode | Tissue | Histology | Sex | Age | Stage | Therapy Types | Drugs | Outcome |
| SEZ6L2 | SNV | Missense_Mutation | c.1195G>A | p.Glu399Lys | p.E399K | protein_coding | deleterious(0.01) | probably_damaging(0.992) | TCGA-A8-A094-01 | Breast | breast invasive carcinoma | Female | >=65 | I/II | Unknown | Unknown | SD | ||
| SEZ6L2 | SNV | Missense_Mutation | rs764439495 | c.2516G>A | p.Arg839Gln | p.R839Q | protein_coding | deleterious(0.04) | possibly_damaging(0.721) | TCGA-AN-A046-01 | Breast | breast invasive carcinoma | Female | >=65 | I/II | Unknown | Unknown | SD | |
| SEZ6L2 | SNV | Missense_Mutation | c.2257G>C | p.Gly753Arg | p.G753R | protein_coding | deleterious(0) | probably_damaging(0.999) | TCGA-AN-A0AJ-01 | Breast | breast invasive carcinoma | Female | >=65 | I/II | Unknown | Unknown | SD | ||
| SEZ6L2 | SNV | Missense_Mutation | rs375292147 | c.2293N>A | p.Ala765Thr | p.A765T | protein_coding | deleterious(0.05) | benign(0.251) | TCGA-AR-A5QP-01 | Breast | breast invasive carcinoma | Female | <65 | I/II | Hormone Therapy | tamoxiphen | SD | |
| SEZ6L2 | SNV | Missense_Mutation | rs763100339 | c.518G>T | p.Cys173Phe | p.C173F | protein_coding | deleterious(0) | probably_damaging(0.989) | TCGA-D8-A1XQ-01 | Breast | breast invasive carcinoma | Female | >=65 | I/II | Unknown | Unknown | SD | |
| SEZ6L2 | SNV | Missense_Mutation | rs764439495 | c.2516N>A | p.Arg839Gln | p.R839Q | protein_coding | deleterious(0.04) | possibly_damaging(0.721) | TCGA-E2-A15K-06 | Breast | breast invasive carcinoma | Female | <65 | I/II | Chemotherapy | adriamycin | SD | |
| SEZ6L2 | deletion | Frame_Shift_Del | c.964delC | p.Leu322CysfsTer49 | p.L322Cfs*49 | protein_coding | TCGA-E9-A22G-01 | Breast | breast invasive carcinoma | Female | <65 | I/II | Chemotherapy | doxorubicin | SD | ||||
| SEZ6L2 | SNV | Missense_Mutation | novel | c.2412G>T | p.Glu804Asp | p.E804D | protein_coding | tolerated(0.1) | benign(0.359) | TCGA-2W-A8YY-01 | Cervix | cervical & endocervical cancer | Female | <65 | I/II | Chemotherapy | cisplatin | CR | |
| SEZ6L2 | SNV | Missense_Mutation | rs777700133 | c.1768G>A | p.Ala590Thr | p.A590T | protein_coding | tolerated(0.1) | possibly_damaging(0.467) | TCGA-2W-A8YY-01 | Cervix | cervical & endocervical cancer | Female | <65 | I/II | Chemotherapy | cisplatin | CR | |
| SEZ6L2 | SNV | Missense_Mutation | rs777993672 | c.773G>A | p.Arg258Gln | p.R258Q | protein_coding | deleterious(0) | probably_damaging(0.982) | TCGA-2W-A8YY-01 | Cervix | cervical & endocervical cancer | Female | <65 | I/II | Chemotherapy | cisplatin | CR |
| Page: 1 2 3 4 5 6 7 8 9 10 11 12 |
Top |
Related drugs of malignant transformation related genes |
| Identification of chemicals and drugs interact with genes involved in malignant transfromation |
| (DGIdb 4.0) |
| Entrez ID | Symbol | Category | Interaction Types | Drug Claim Name | Drug Name | PMIDs |
| Page: 1 |

Copyright 2023-Present -The University of Texas Health Science Center at Houston |