
|
|||||
|
 | |
| |
| |
| |
| |
| |
|
Gene: SELENON |
Gene summary for SELENON |
| Gene information | Species | Human | Gene symbol | SELENON | Gene ID | 57190 |
| Gene name | selenoprotein N | |
| Gene Alias | CFTD | |
| Cytomap | 1p36.11 | |
| Gene Type | protein-coding | GO ID | GO:0003008 | UniProtAcc | Q9NZV5 |
Top |
Malignant transformation analysis |
| Identification of the aberrant gene expression in precancerous and cancerous lesions by comparing the gene expression of stem-like cells in diseased tissues with normal stem cells |
| Entrez ID | Symbol | Replicates | Species | Organ | Tissue | Adj P-value | Log2FC | Malignancy |
| 57190 | SELENON | ATC2 | Human | Thyroid | ATC | 9.20e-14 | 8.01e-01 | 0.34 |
| 57190 | SELENON | ATC3 | Human | Thyroid | ATC | 5.52e-09 | 4.23e-01 | 0.338 |
| 57190 | SELENON | ATC4 | Human | Thyroid | ATC | 2.93e-24 | 4.58e-01 | 0.34 |
| 57190 | SELENON | ATC5 | Human | Thyroid | ATC | 5.57e-37 | 6.35e-01 | 0.34 |
| Page: 1 2 |
| Tissue | Expression Dynamics | Abbreviation |
| Liver | 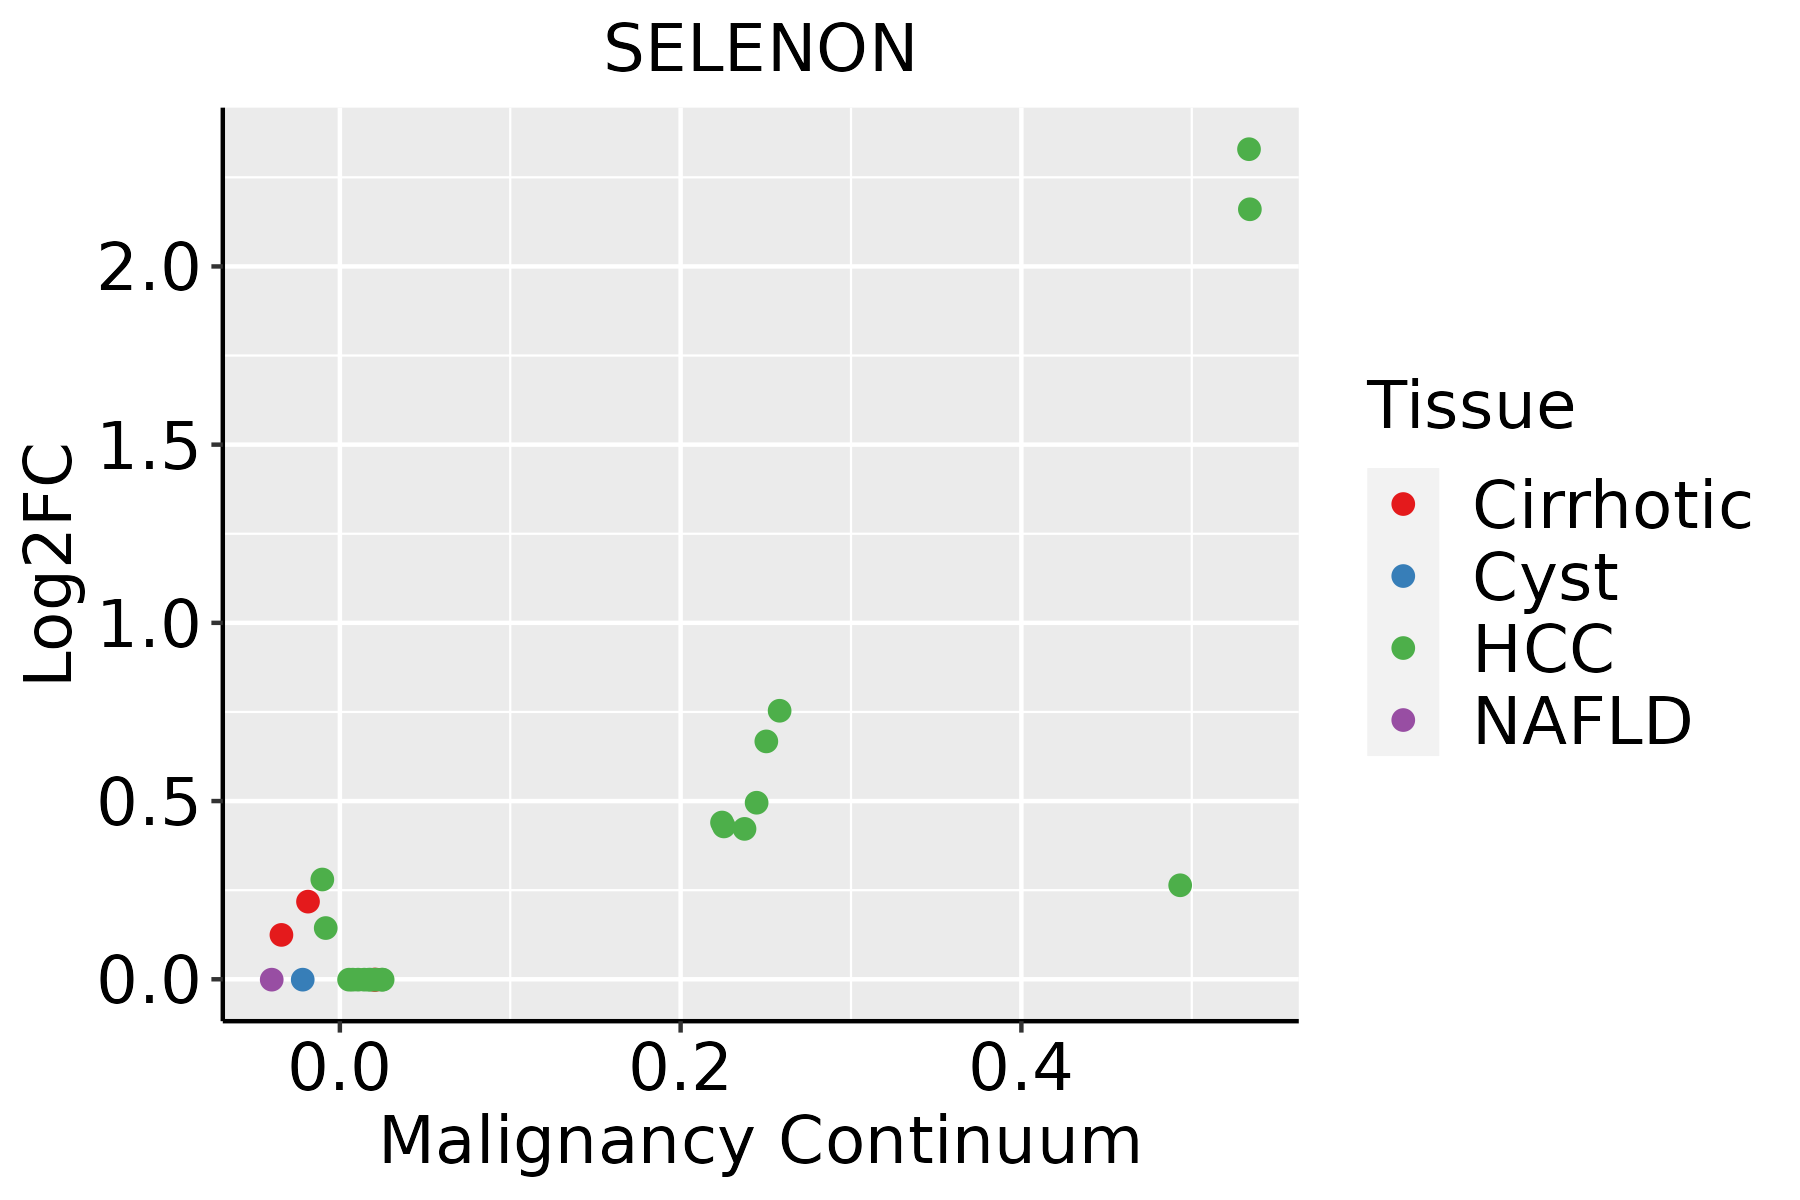 | HCC: Hepatocellular carcinoma |
| NAFLD: Non-alcoholic fatty liver disease | ||
| Thyroid | 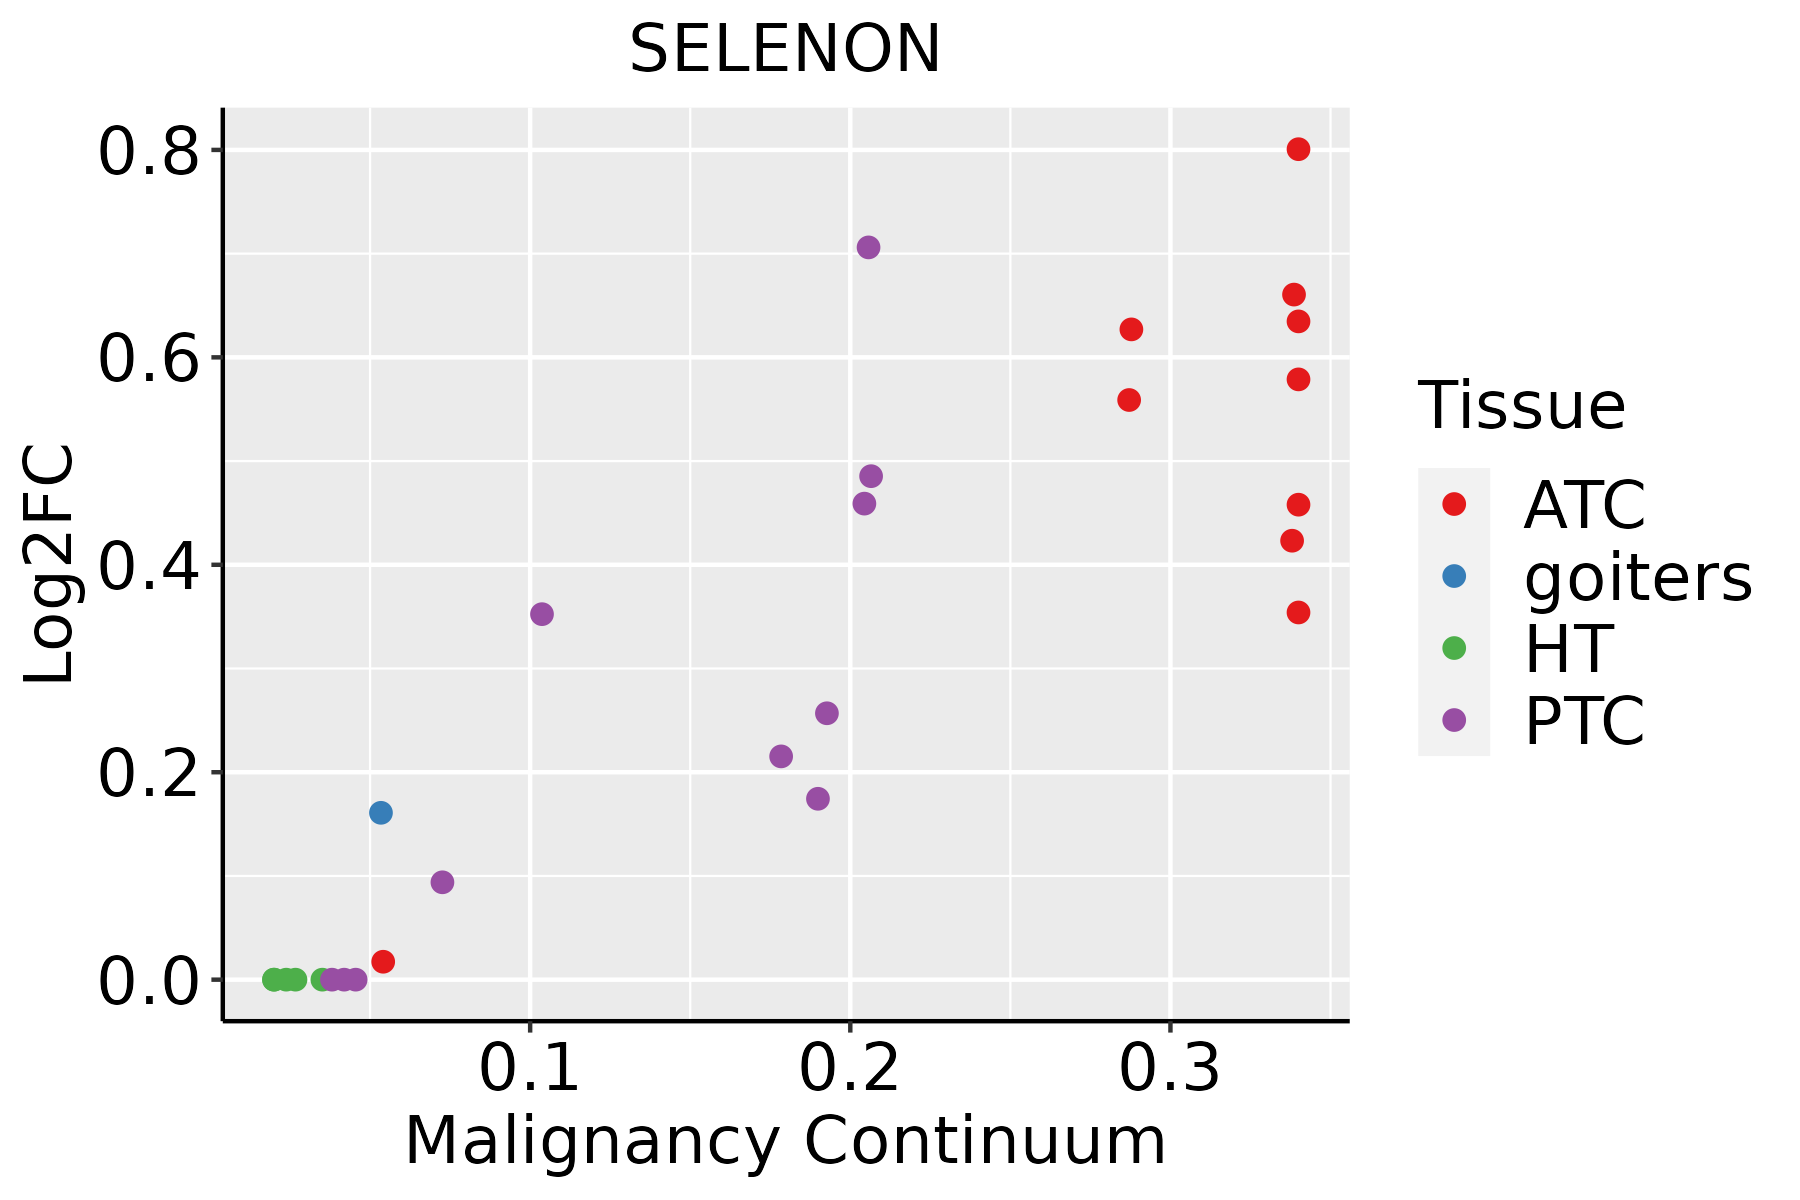 | ATC: Anaplastic thyroid cancer |
| HT: Hashimoto's thyroiditis | ||
| PTC: Papillary thyroid cancer |
| ∗log2FC in expression of this searched gene in stem-like cells from each diseased tissue sample relative to stem-like cells in normal samples in each tissue plotted against the malignancy continuum. Samples are colored based on if they are from different disease stage. |
Top |
Malignant transformation related pathway analysis |
| Find out the enriched GO biological processes and KEGG pathways involved in transition from healthy to precancer to cancer |
| Tissue | Disease Stage | Enriched GO biological Processes |
| Colorectum | AD |  |
| Colorectum | SER |  |
| Colorectum | MSS |  |
| Colorectum | MSI-H |  |
| Colorectum | FAP |  |
| ∗Top 15 enriched GO BP terms are showed in the bar plot of each disease state in each tissue. Each row represents a significant GO biological process which is colored according to the -log10(p.adjust). |
| Page: 1 2 3 4 5 6 7 8 9 |
| GO ID | Tissue | Disease Stage | Description | Gene Ratio | Bg Ratio | pvalue | p.adjust | Count |
| GO:000697922 | Liver | HCC | response to oxidative stress | 281/7958 | 446/18723 | 9.75e-19 | 1.24e-16 | 281 |
| GO:006219722 | Liver | HCC | cellular response to chemical stress | 216/7958 | 337/18723 | 6.86e-16 | 5.44e-14 | 216 |
| GO:003459922 | Liver | HCC | cellular response to oxidative stress | 183/7958 | 288/18723 | 3.65e-13 | 1.93e-11 | 183 |
| GO:005123521 | Liver | HCC | maintenance of location | 185/7958 | 327/18723 | 1.70e-07 | 3.12e-06 | 185 |
| GO:005165112 | Liver | HCC | maintenance of location in cell | 119/7958 | 214/18723 | 7.11e-05 | 6.39e-04 | 119 |
| GO:001407421 | Liver | HCC | response to purine-containing compound | 84/7958 | 148/18723 | 3.19e-04 | 2.26e-03 | 84 |
| GO:00987272 | Liver | HCC | maintenance of cell number | 77/7958 | 134/18723 | 3.32e-04 | 2.33e-03 | 77 |
| GO:00310992 | Liver | HCC | regeneration | 107/7958 | 198/18723 | 6.67e-04 | 4.12e-03 | 107 |
| GO:00148231 | Liver | HCC | response to activity | 45/7958 | 76/18723 | 2.42e-03 | 1.18e-02 | 45 |
| GO:003032311 | Liver | HCC | respiratory tube development | 95/7958 | 181/18723 | 4.15e-03 | 1.81e-02 | 95 |
| GO:190288212 | Liver | HCC | regulation of response to oxidative stress | 55/7958 | 98/18723 | 4.46e-03 | 1.93e-02 | 55 |
| GO:00432791 | Liver | HCC | response to alkaloid | 62/7958 | 115/18723 | 8.79e-03 | 3.42e-02 | 62 |
| GO:003032411 | Liver | HCC | lung development | 91/7958 | 177/18723 | 1.01e-02 | 3.80e-02 | 91 |
| GO:0006979113 | Thyroid | PTC | response to oxidative stress | 234/5968 | 446/18723 | 6.97e-20 | 9.77e-18 | 234 |
| GO:0062197113 | Thyroid | PTC | cellular response to chemical stress | 180/5968 | 337/18723 | 1.36e-16 | 1.16e-14 | 180 |
| GO:0034599113 | Thyroid | PTC | cellular response to oxidative stress | 151/5968 | 288/18723 | 2.82e-13 | 1.43e-11 | 151 |
| GO:0051235112 | Thyroid | PTC | maintenance of location | 148/5968 | 327/18723 | 2.30e-07 | 4.07e-06 | 148 |
| GO:0051651113 | Thyroid | PTC | maintenance of location in cell | 100/5968 | 214/18723 | 3.65e-06 | 4.67e-05 | 100 |
| GO:009872710 | Thyroid | PTC | maintenance of cell number | 63/5968 | 134/18723 | 1.73e-04 | 1.32e-03 | 63 |
| GO:003032317 | Thyroid | PTC | respiratory tube development | 80/5968 | 181/18723 | 3.23e-04 | 2.23e-03 | 80 |
| Page: 1 2 3 |
| Pathway ID | Tissue | Disease Stage | Description | Gene Ratio | Bg Ratio | pvalue | p.adjust | qvalue | Count |
| Page: 1 |
Top |
Cell-cell communication analysis |
| Identification of potential cell-cell interactions between two cell types and their ligand-receptor pairs for different disease states |
| Ligand | Receptor | LRpair | Pathway | Tissue | Disease Stage |
| Page: 1 |
Top |
Single-cell gene regulatory network inference analysis |
| Find out the significant the regulons (TFs) and the target genes of each regulon across cell types for different disease states |
| TF | Cell Type | Tissue | Disease Stage | Target Gene | RSS | Regulon Activity |
| ∗The dot plots of a searched regulon are shown for all cell subpopulations in each disease state of each tissue based on the regulon specific score inferred using pySCENIC and by calculating the average expression. |
| Page: 1 |
Top |
Somatic mutation of malignant transformation related genes |
| Annotation of somatic variants for genes involved in malignant transformation |
| Hugo Symbol | Variant Class | Variant Classification | dbSNP RS | HGVSc | HGVSp | HGVSp Short | SWISSPROT | BIOTYPE | SIFT | PolyPhen | Tumor Sample Barcode | Tissue | Histology | Sex | Age | Stage | Therapy Types | Drugs | Outcome |
| SELENON | insertion | Frame_Shift_Ins | novel | c.277_278insGAGGCAACATTTGCACAGATGG | p.Lys93ArgfsTer12 | p.K93Rfs*12 | Q9NZV5 | protein_coding | TCGA-AQ-A04J-01 | Breast | breast invasive carcinoma | Female | <65 | I/II | Chemotherapy | cytoxan | SD | ||
| SELENON | deletion | Frame_Shift_Del | novel | c.1180delG | p.Glu394SerfsTer? | p.E394Sfs*? | Q9NZV5 | protein_coding | TCGA-D8-A27V-01 | Breast | breast invasive carcinoma | Female | <65 | I/II | Hormone Therapy | tamoxiphen | SD | ||
| SELENON | SNV | Missense_Mutation | rs775897489 | c.935N>G | p.Gln312Arg | p.Q312R | Q9NZV5 | protein_coding | deleterious(0.01) | benign(0.297) | TCGA-AA-3492-01 | Colorectum | colon adenocarcinoma | Female | >=65 | I/II | Unknown | Unknown | SD |
| SELENON | SNV | Missense_Mutation | c.1711N>A | p.Ala571Thr | p.A571T | Q9NZV5 | protein_coding | tolerated(0.41) | benign(0.005) | TCGA-AA-3715-01 | Colorectum | colon adenocarcinoma | Male | >=65 | I/II | Unknown | Unknown | PD | |
| SELENON | SNV | Missense_Mutation | novel | c.770G>A | p.Ser257Asn | p.S257N | Q9NZV5 | protein_coding | deleterious(0.01) | benign(0.398) | TCGA-AA-3949-01 | Colorectum | colon adenocarcinoma | Female | >=65 | III/IV | Unknown | Unknown | SD |
| SELENON | SNV | Missense_Mutation | novel | c.1159N>A | p.Asp387Asn | p.D387N | Q9NZV5 | protein_coding | tolerated(0.11) | benign(0.003) | TCGA-CA-6717-01 | Colorectum | colon adenocarcinoma | Male | <65 | I/II | Chemotherapy | oxaliplatin | CR |
| SELENON | SNV | Missense_Mutation | c.886T>C | p.Phe296Leu | p.F296L | Q9NZV5 | protein_coding | deleterious(0) | probably_damaging(0.97) | TCGA-CM-4743-01 | Colorectum | colon adenocarcinoma | Male | >=65 | I/II | Chemotherapy | capecitabine | SD | |
| SELENON | SNV | Missense_Mutation | rs556232275 | c.980N>A | p.Arg327His | p.R327H | Q9NZV5 | protein_coding | tolerated(0.13) | probably_damaging(0.996) | TCGA-DC-4745-01 | Colorectum | rectum adenocarcinoma | Female | <65 | III/IV | Chemotherapy | 5-fluorouracil | SD |
| SELENON | SNV | Missense_Mutation | novel | c.1663N>A | p.Glu555Lys | p.E555K | Q9NZV5 | protein_coding | deleterious_low_confidence(0.03) | benign(0.009) | TCGA-A5-A2K5-01 | Endometrium | uterine corpus endometrioid carcinoma | Female | >=65 | I/II | Unknown | Unknown | SD |
| SELENON | SNV | Missense_Mutation | c.713A>G | p.Asn238Ser | p.N238S | Q9NZV5 | protein_coding | tolerated(0.09) | benign(0.111) | TCGA-AJ-A3EK-01 | Endometrium | uterine corpus endometrioid carcinoma | Female | <65 | I/II | Chemotherapy | carboplatin | CR |
| Page: 1 2 3 4 5 |
Top |
Related drugs of malignant transformation related genes |
| Identification of chemicals and drugs interact with genes involved in malignant transfromation |
| (DGIdb 4.0) |
| Entrez ID | Symbol | Category | Interaction Types | Drug Claim Name | Drug Name | PMIDs |
| Page: 1 |

Copyright 2023-Present -The University of Texas Health Science Center at Houston |