| Tissue | Expression Dynamics | Abbreviation |
| Breast | 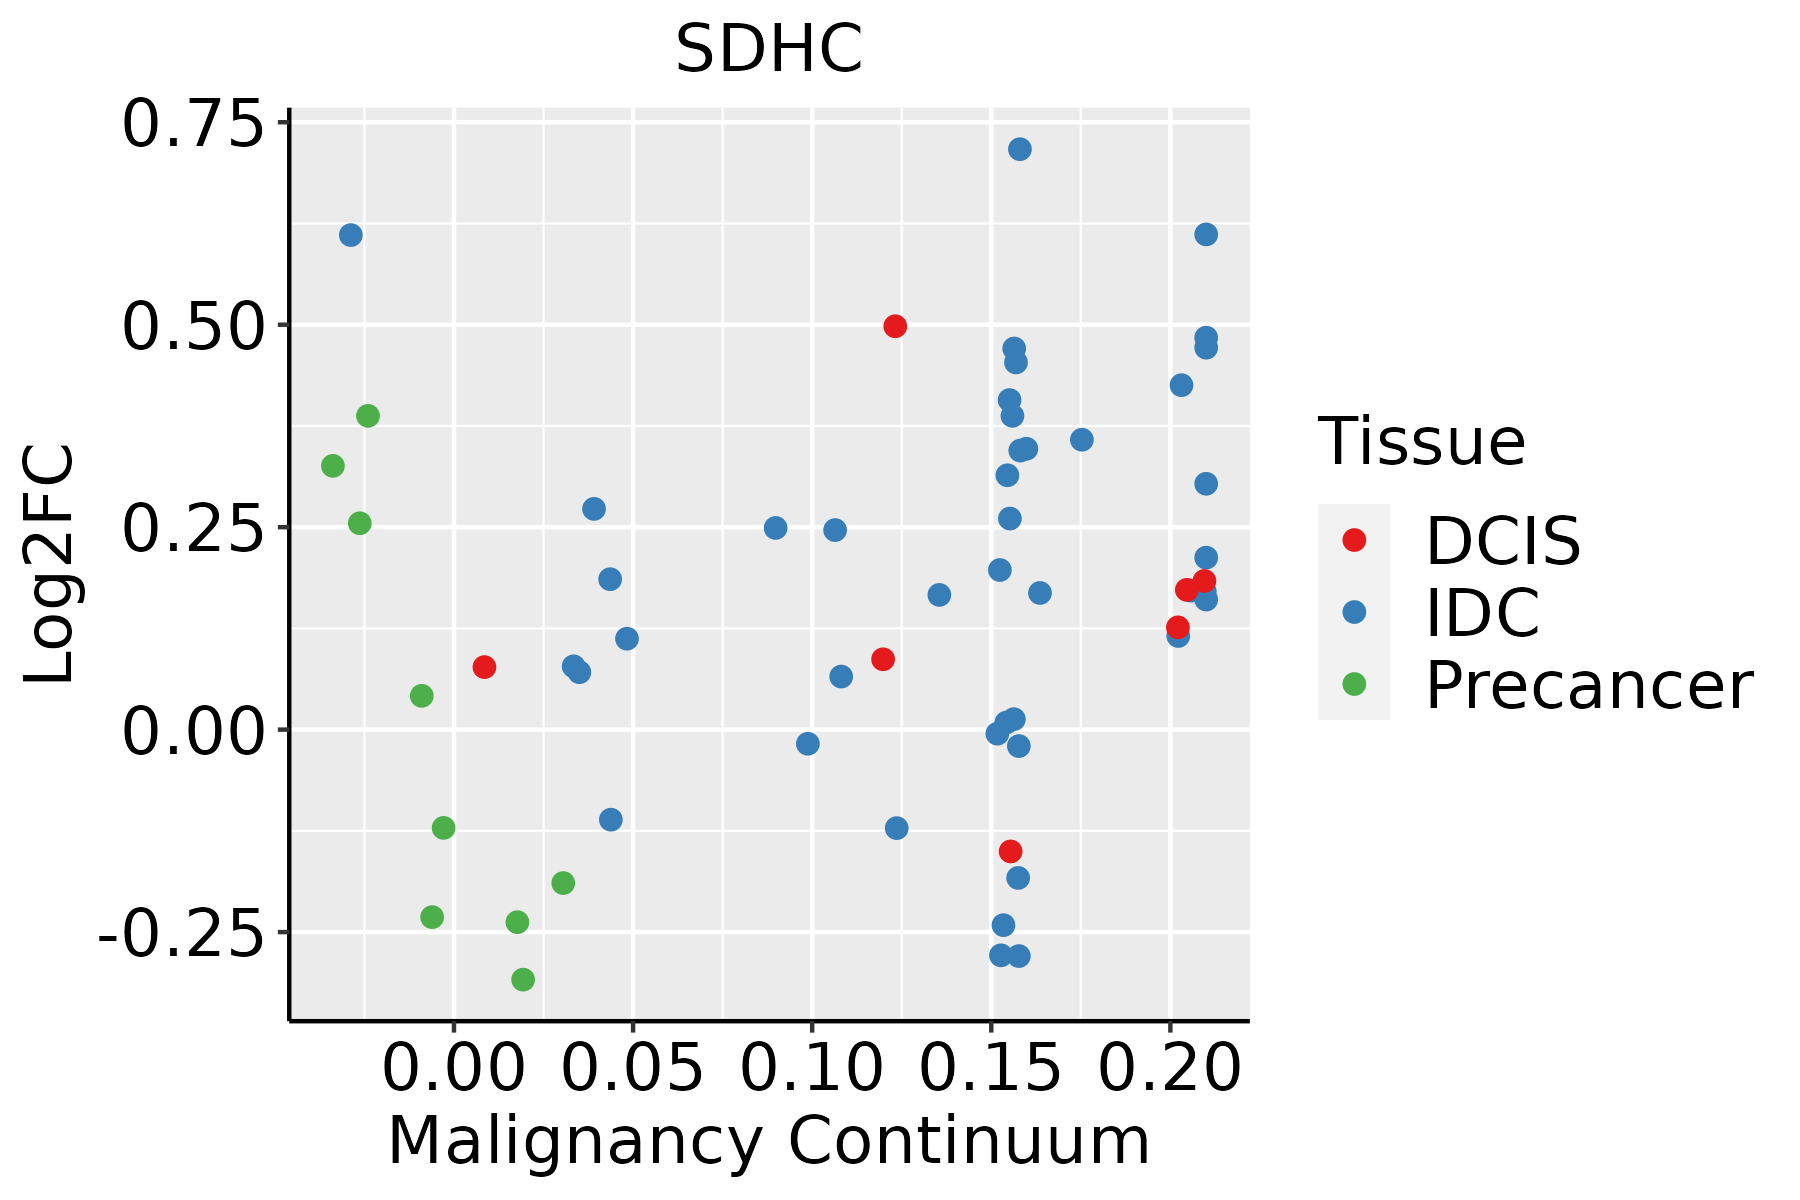 | IDC: Invasive ductal carcinoma |
| DCIS: Ductal carcinoma in situ |
| Precancer(BRCA1-mut): Precancerous lesion from BRCA1 mutation carriers |
| Colorectum (GSE201348) |  | FAP: Familial adenomatous polyposis |
| CRC: Colorectal cancer |
| Colorectum (HTA11) | 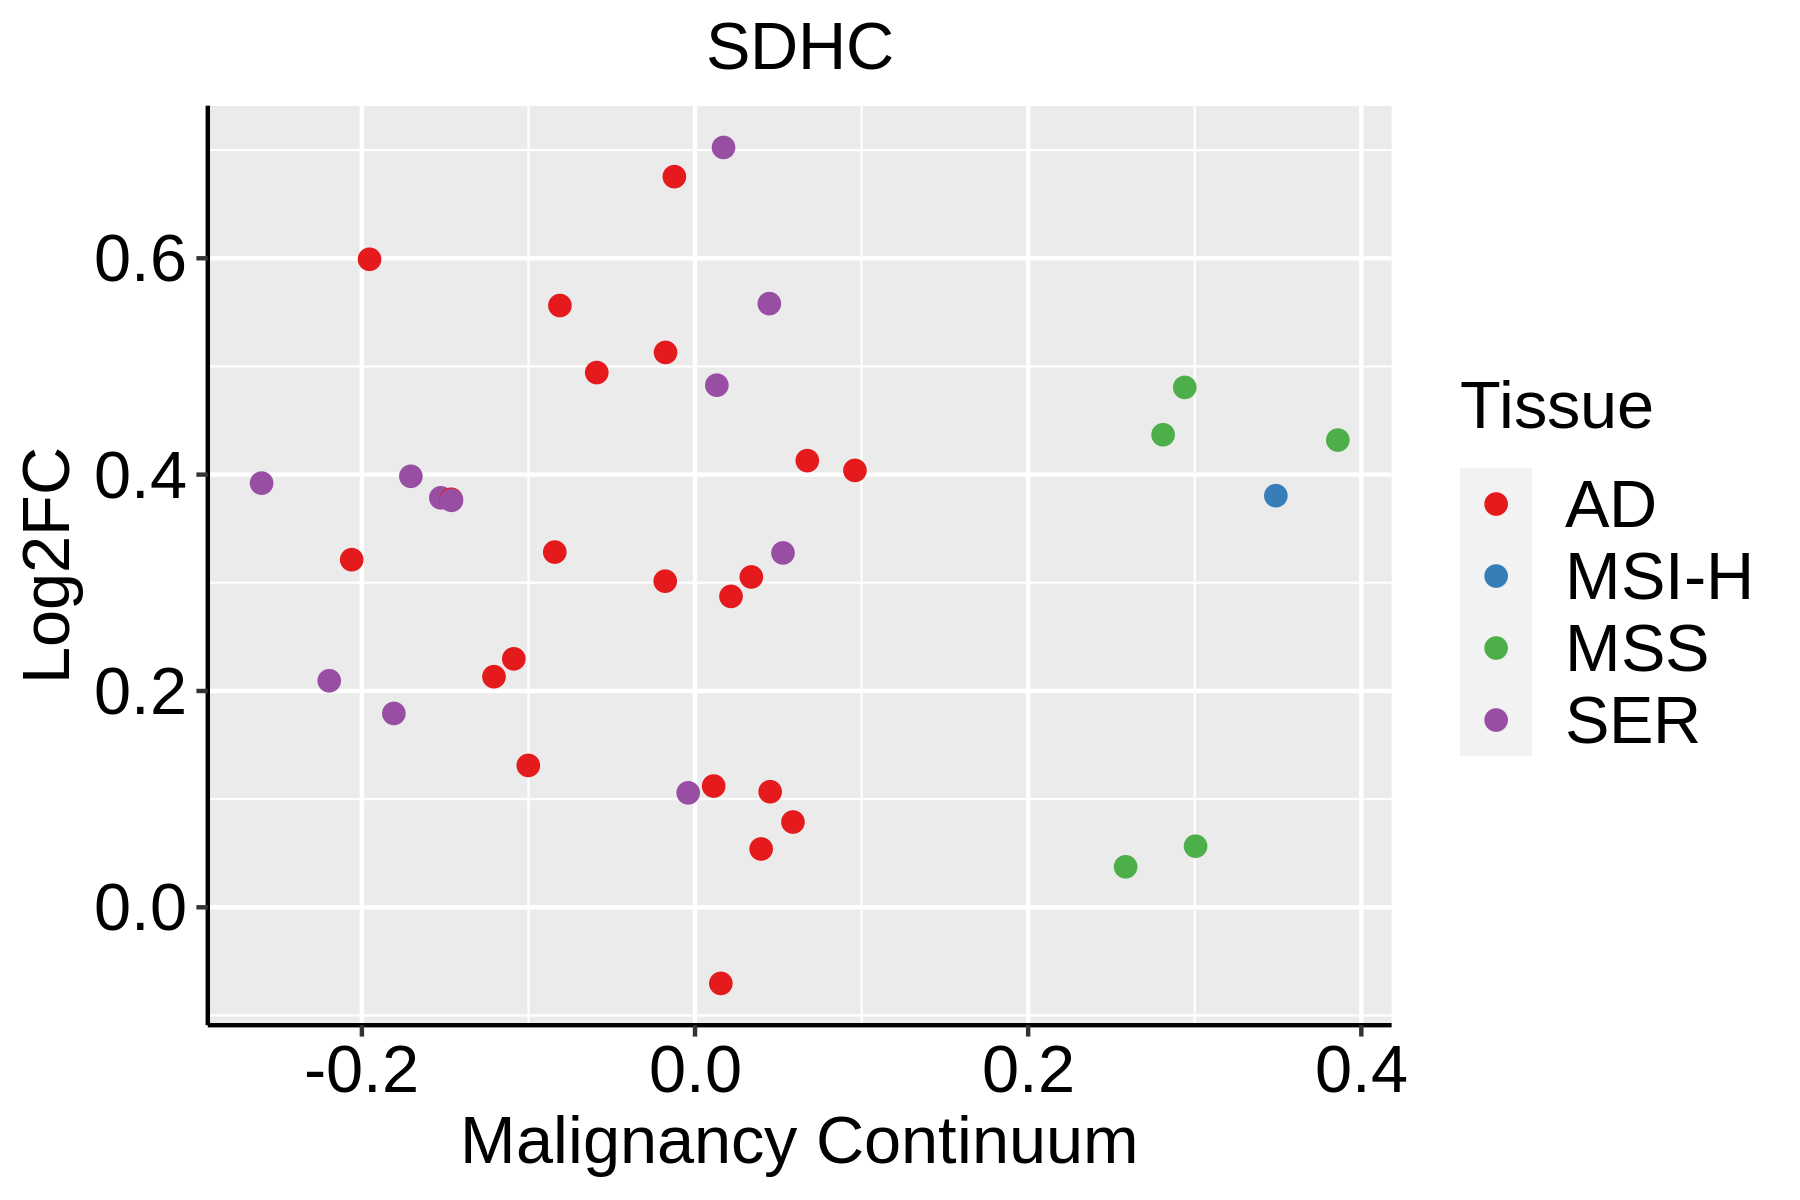 | AD: Adenomas |
| SER: Sessile serrated lesions |
| MSI-H: Microsatellite-high colorectal cancer |
| MSS: Microsatellite stable colorectal cancer |
| Endometrium |  | AEH: Atypical endometrial hyperplasia |
| EEC: Endometrioid Cancer |
| Esophagus | 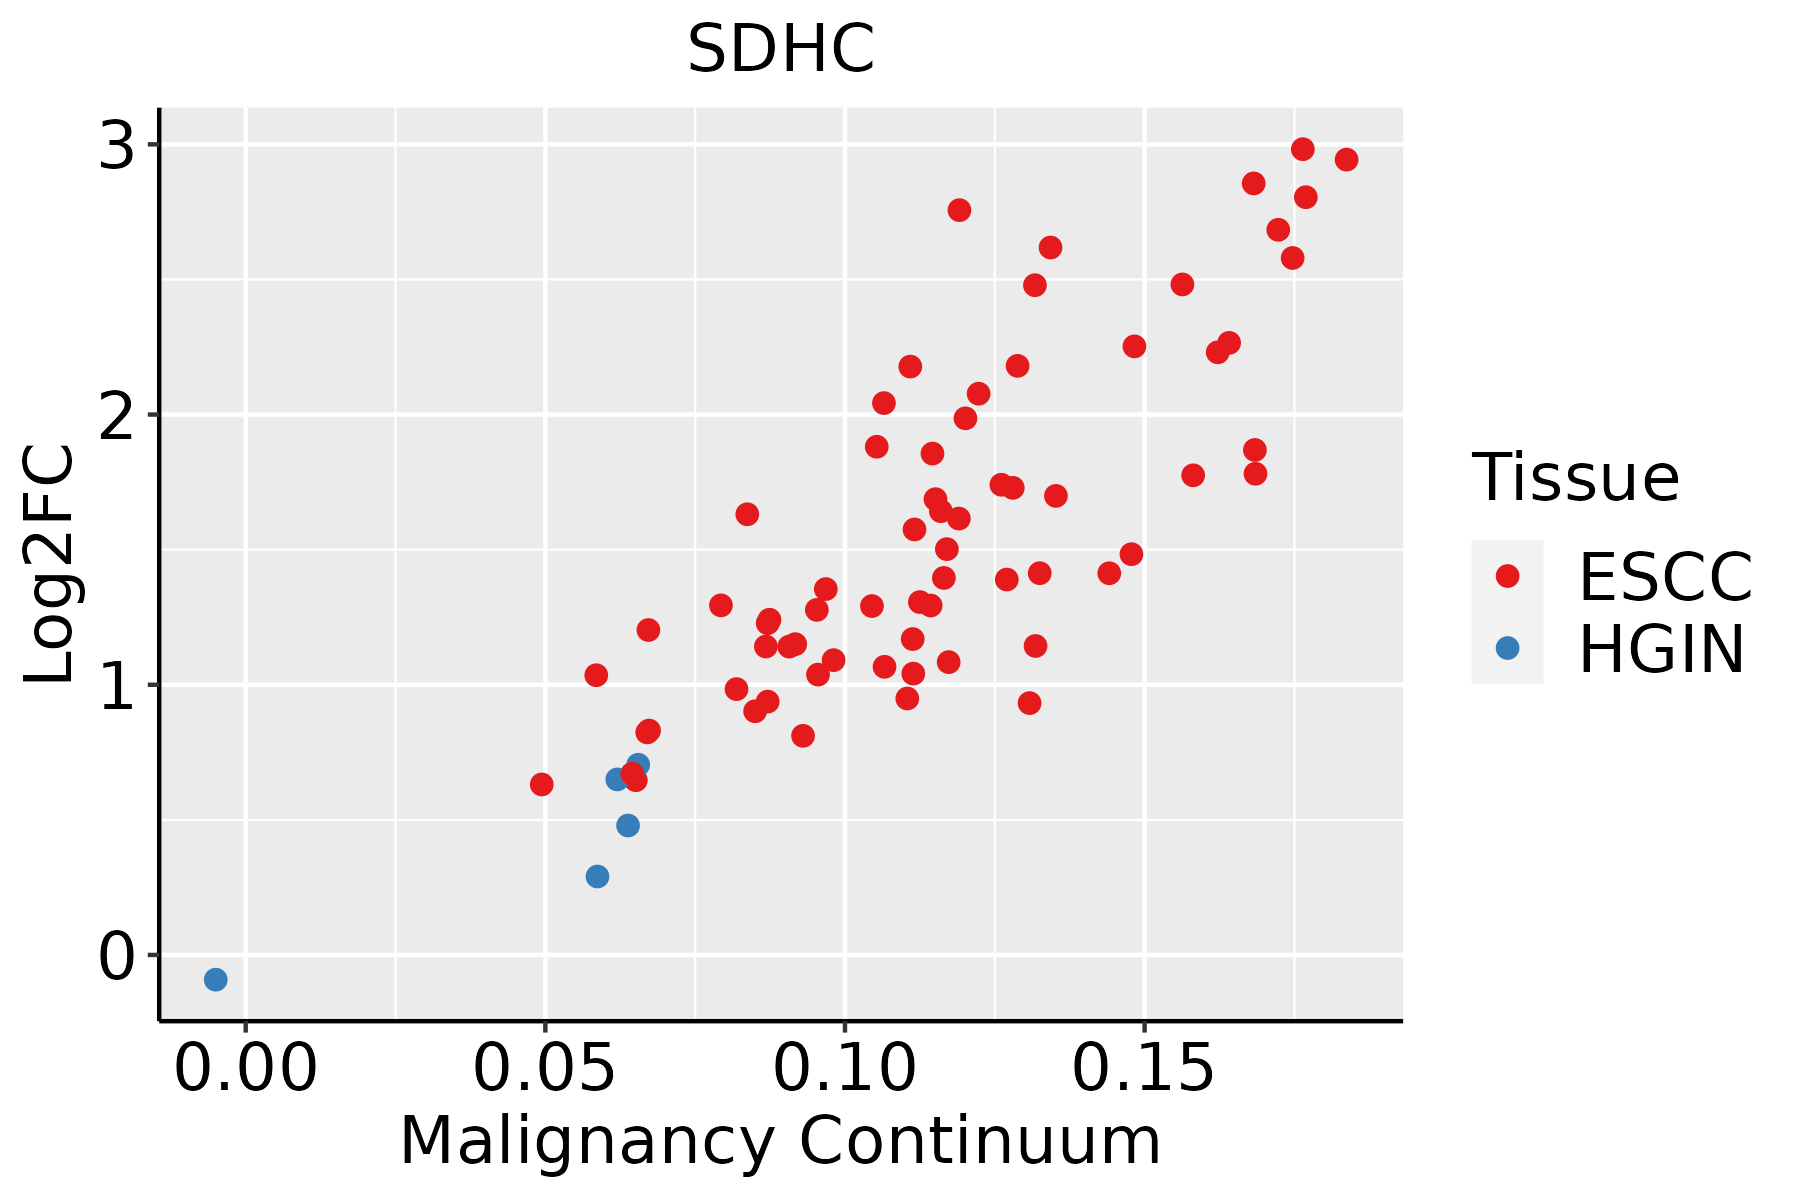 | ESCC: Esophageal squamous cell carcinoma |
| HGIN: High-grade intraepithelial neoplasias |
| LGIN: Low-grade intraepithelial neoplasias |
| Liver | 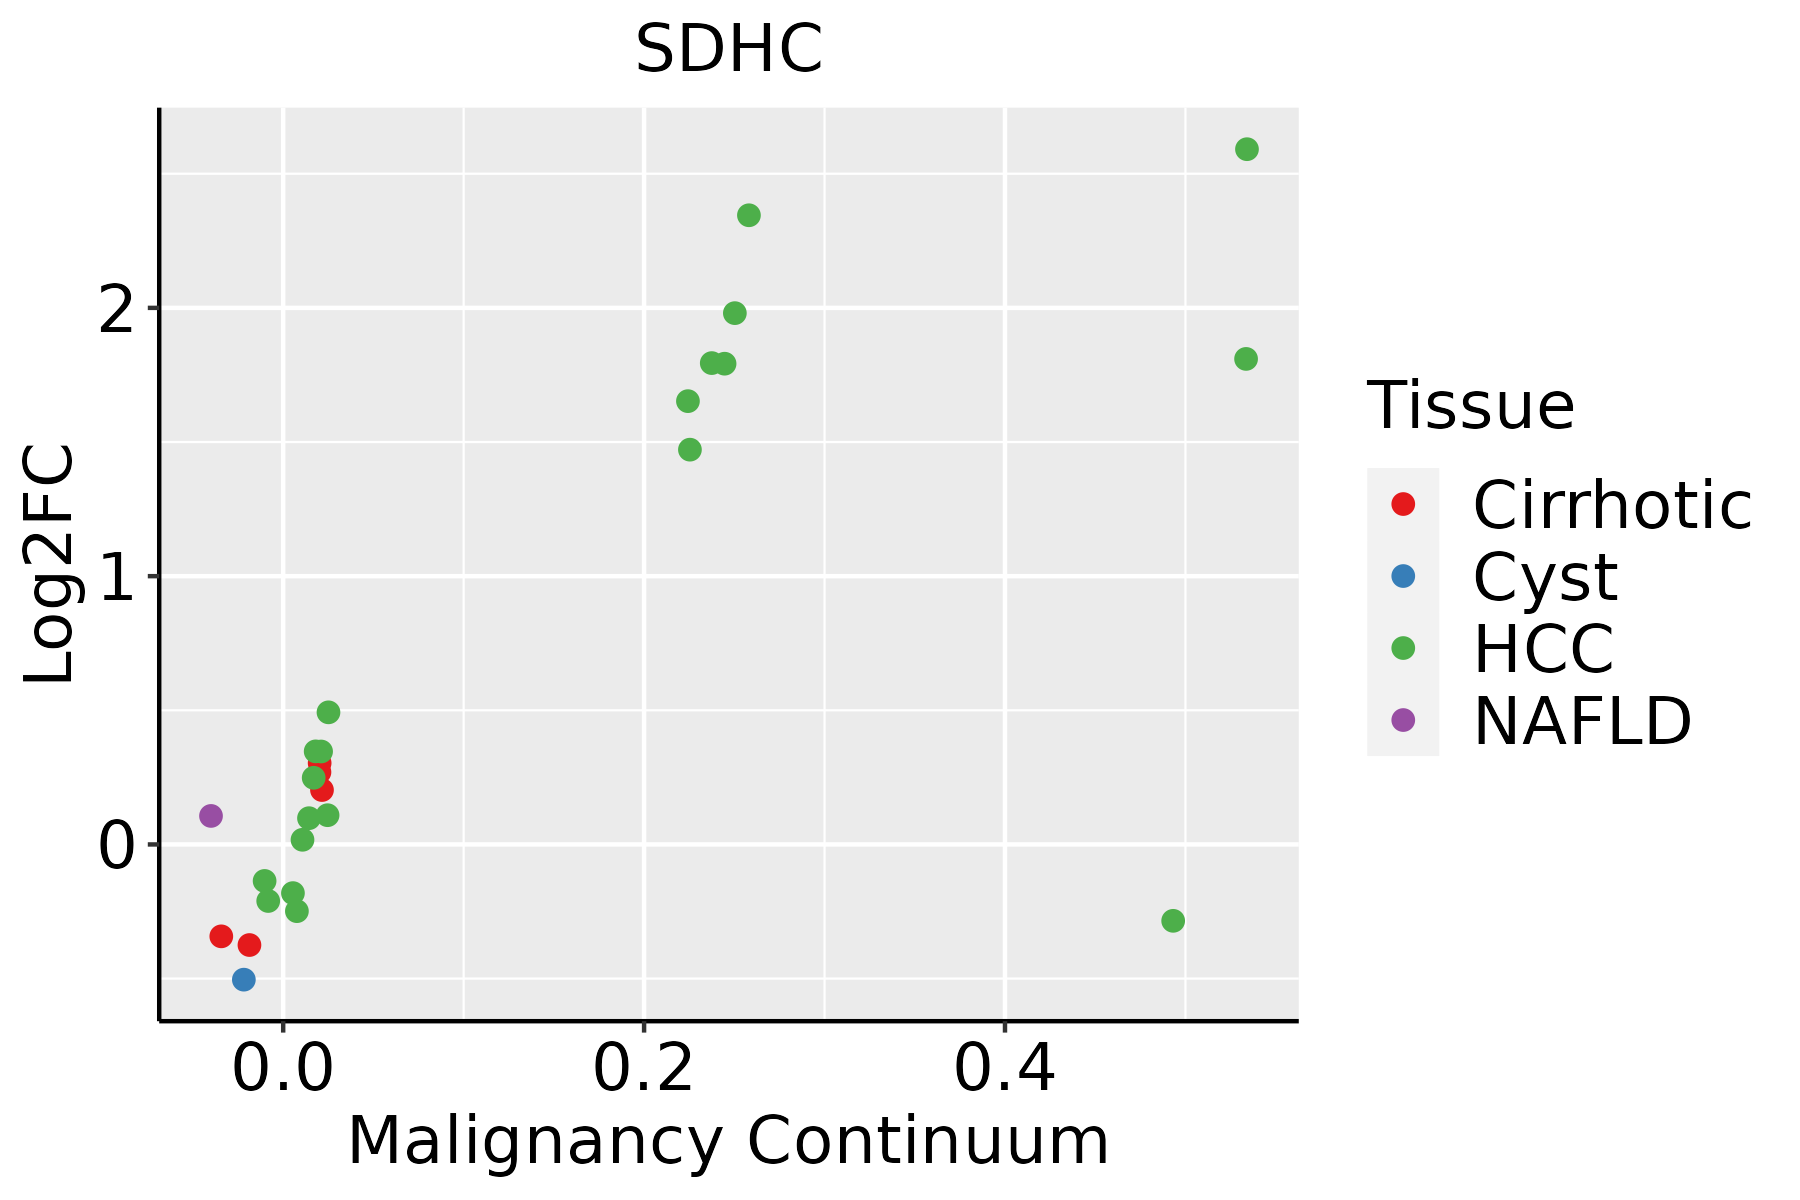 | HCC: Hepatocellular carcinoma |
| NAFLD: Non-alcoholic fatty liver disease |
| Oral Cavity | 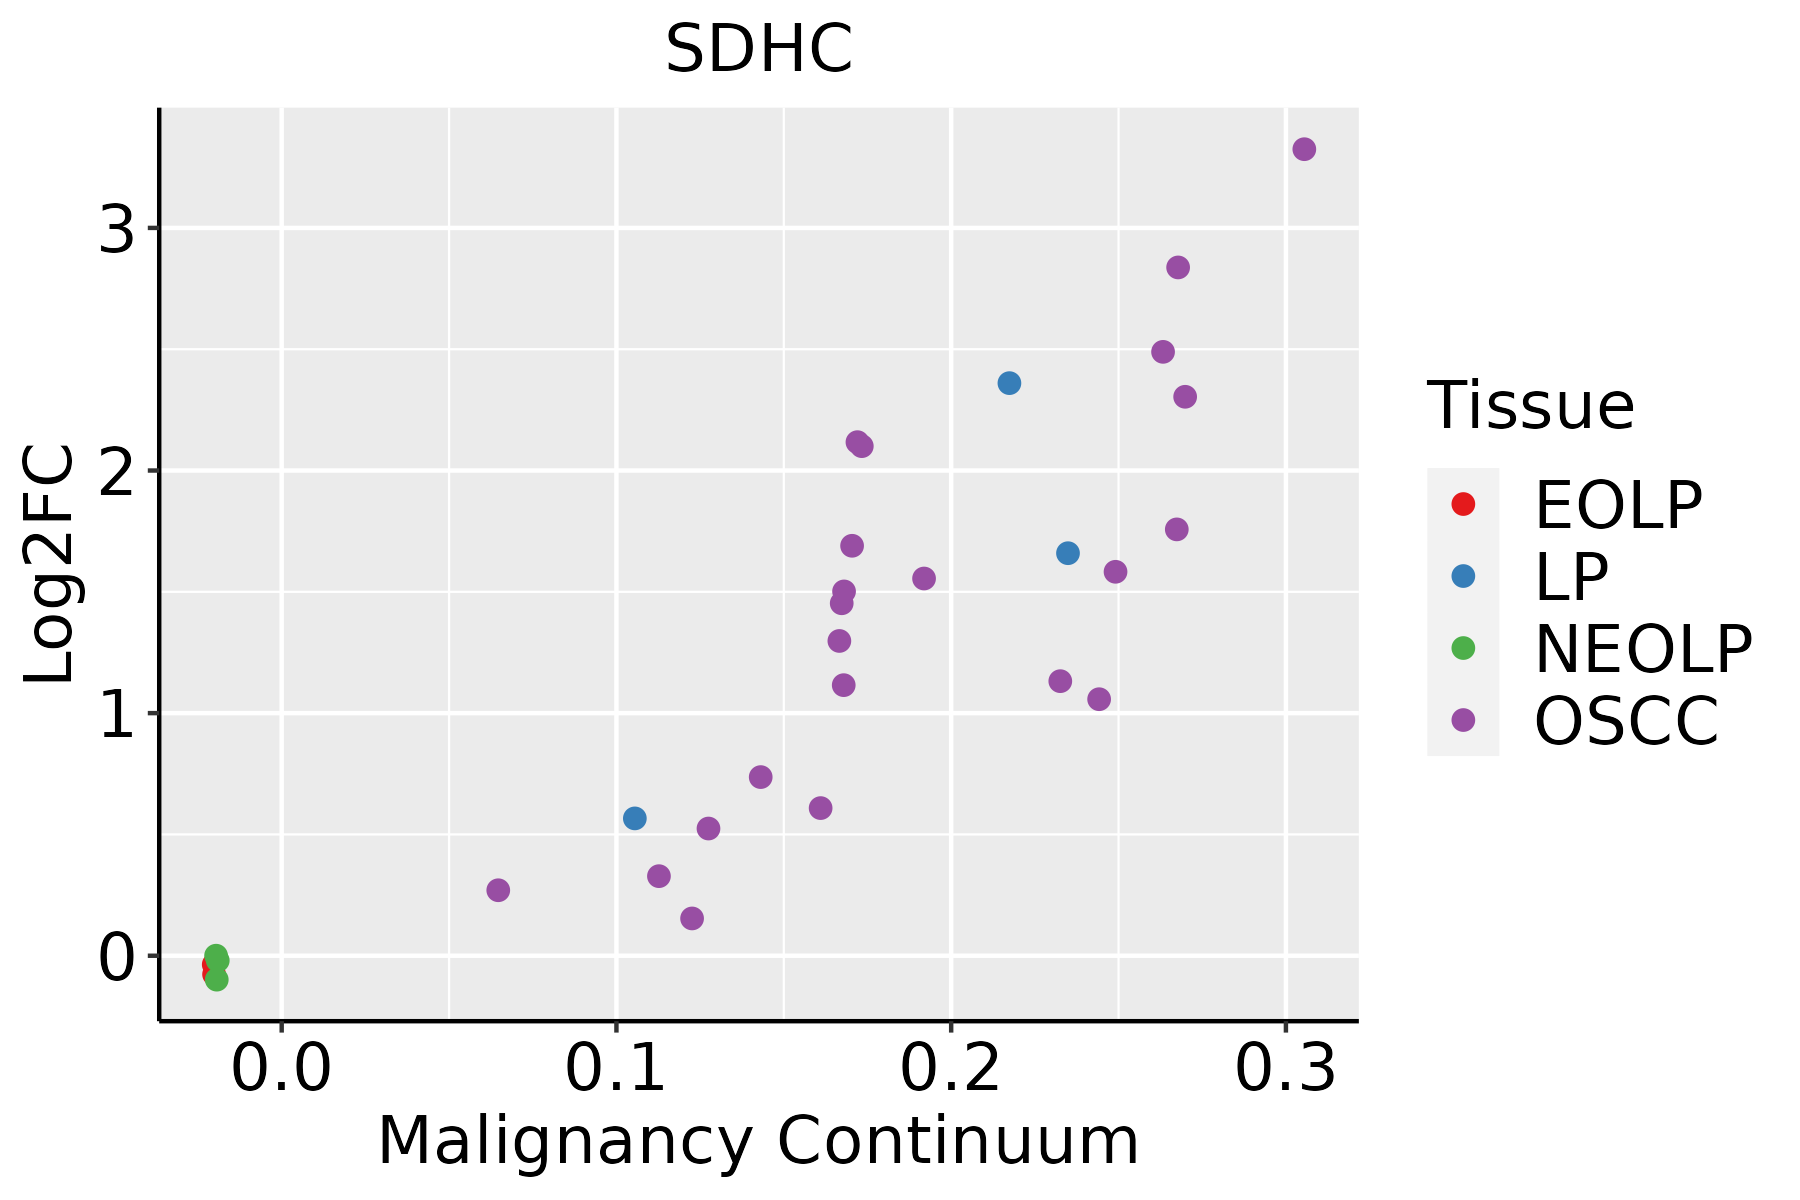 | EOLP: Erosive Oral lichen planus |
| LP: leukoplakia |
| NEOLP: Non-erosive oral lichen planus |
| OSCC: Oral squamous cell carcinoma |
| Prostate | 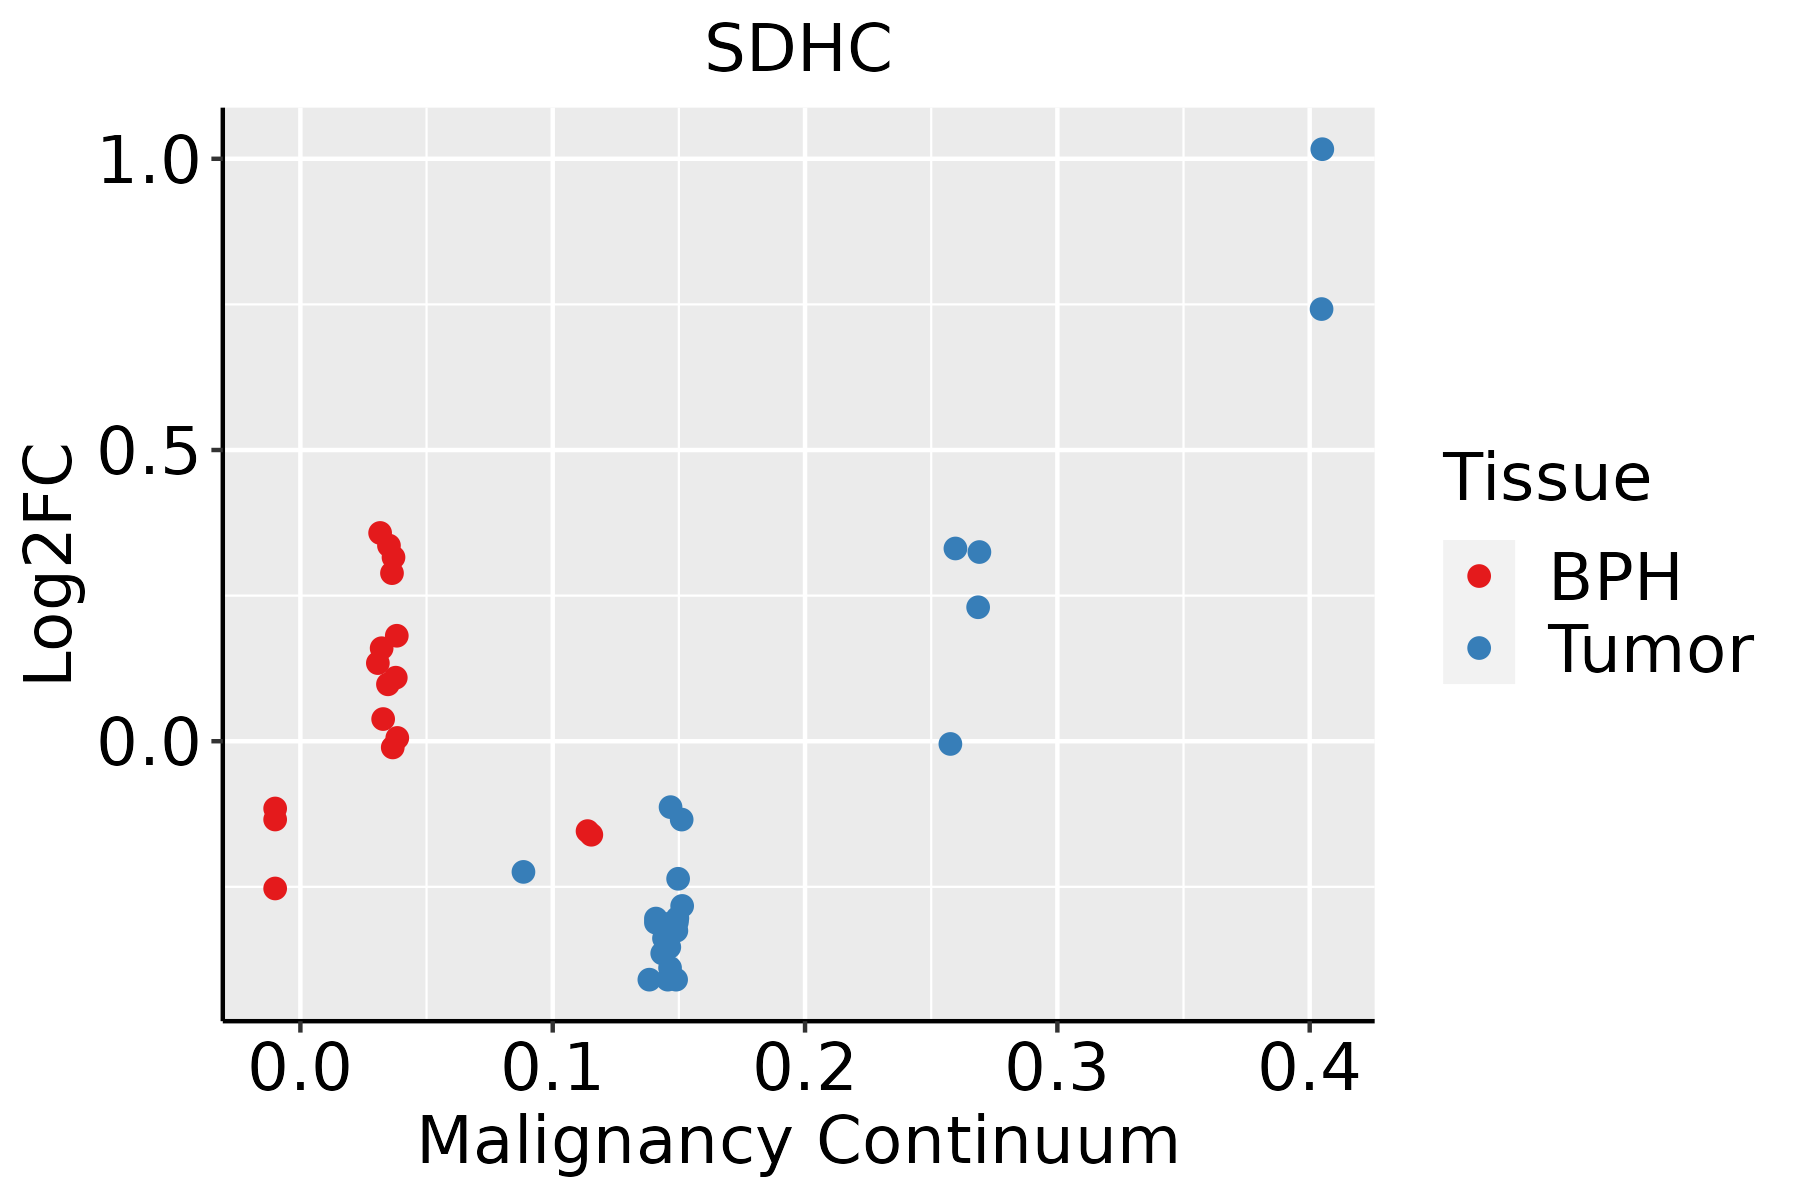 | BPH: Benign Prostatic Hyperplasia |
| Skin | 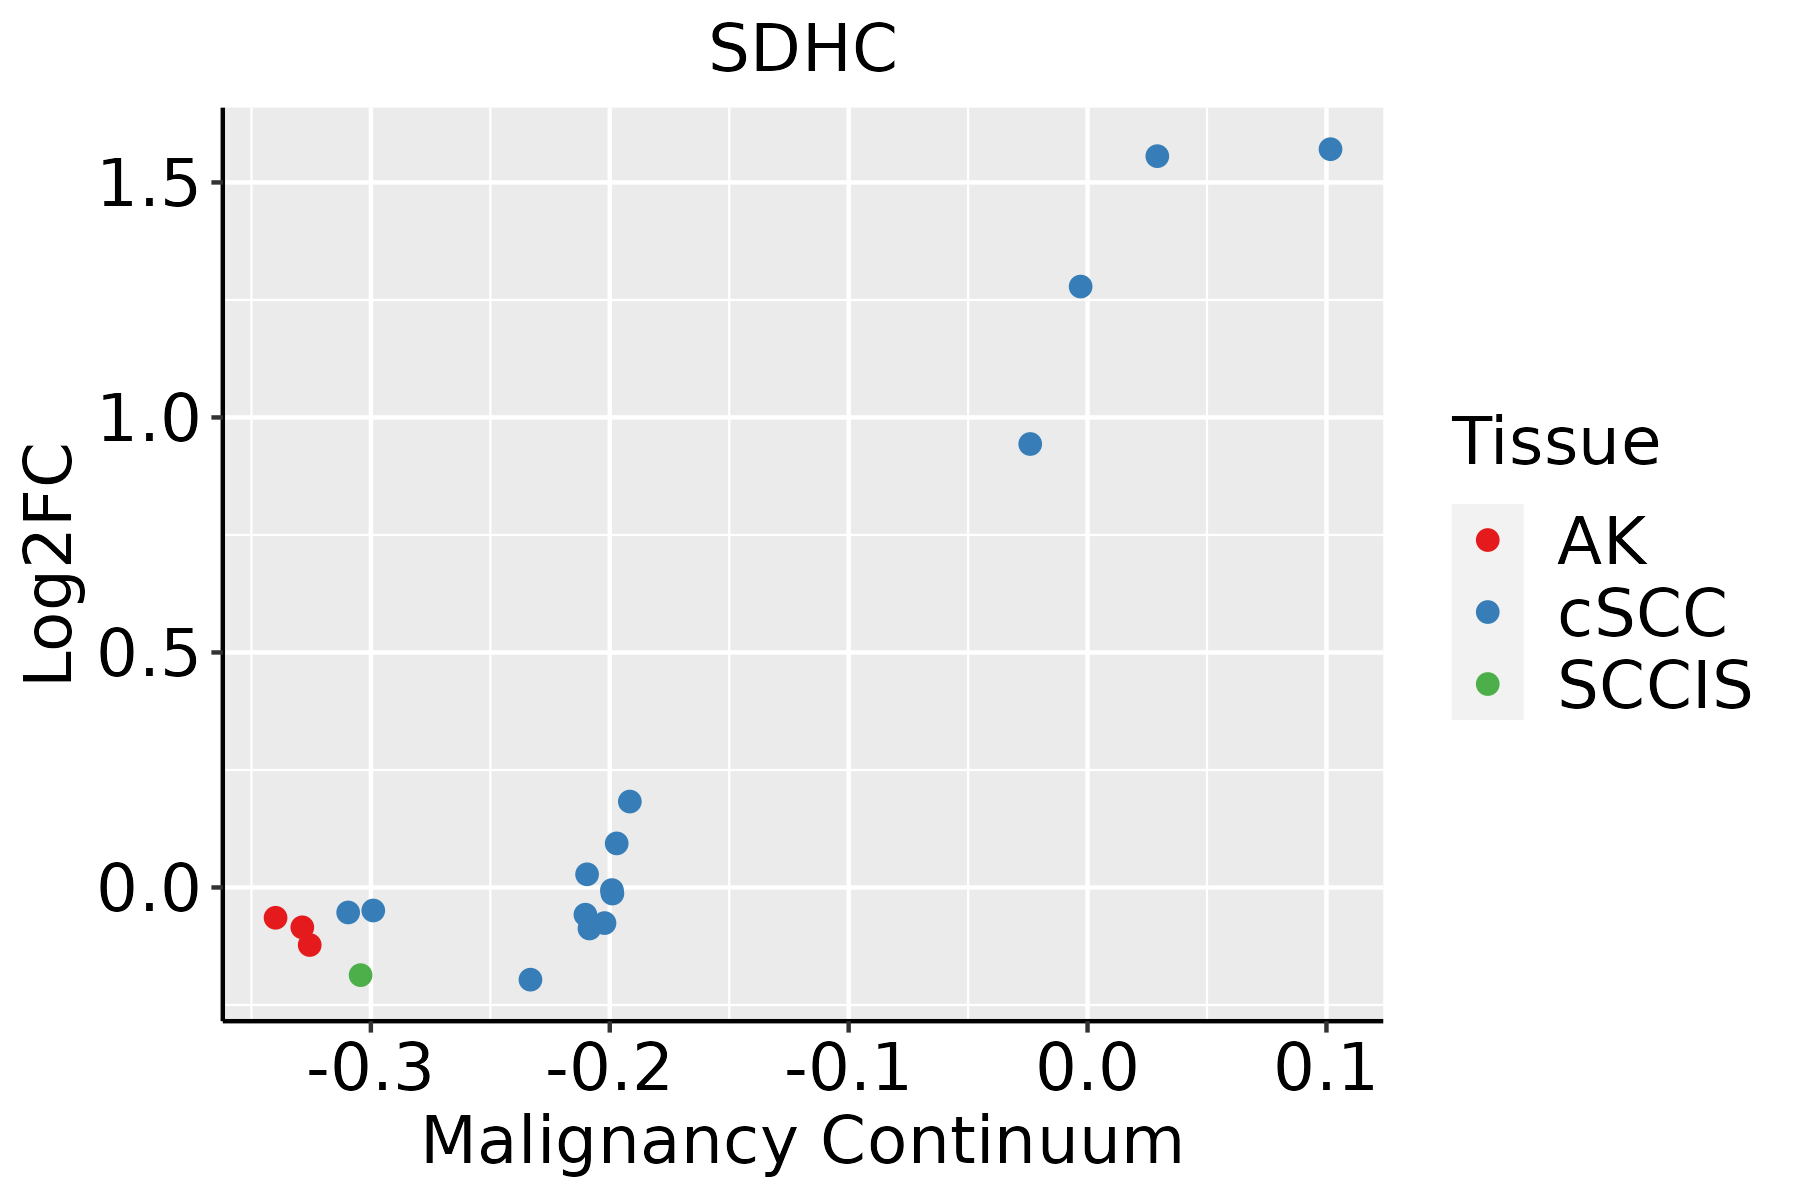 | AK: Actinic keratosis |
| cSCC: Cutaneous squamous cell carcinoma |
| SCCIS:squamous cell carcinoma in situ |
| Thyroid | 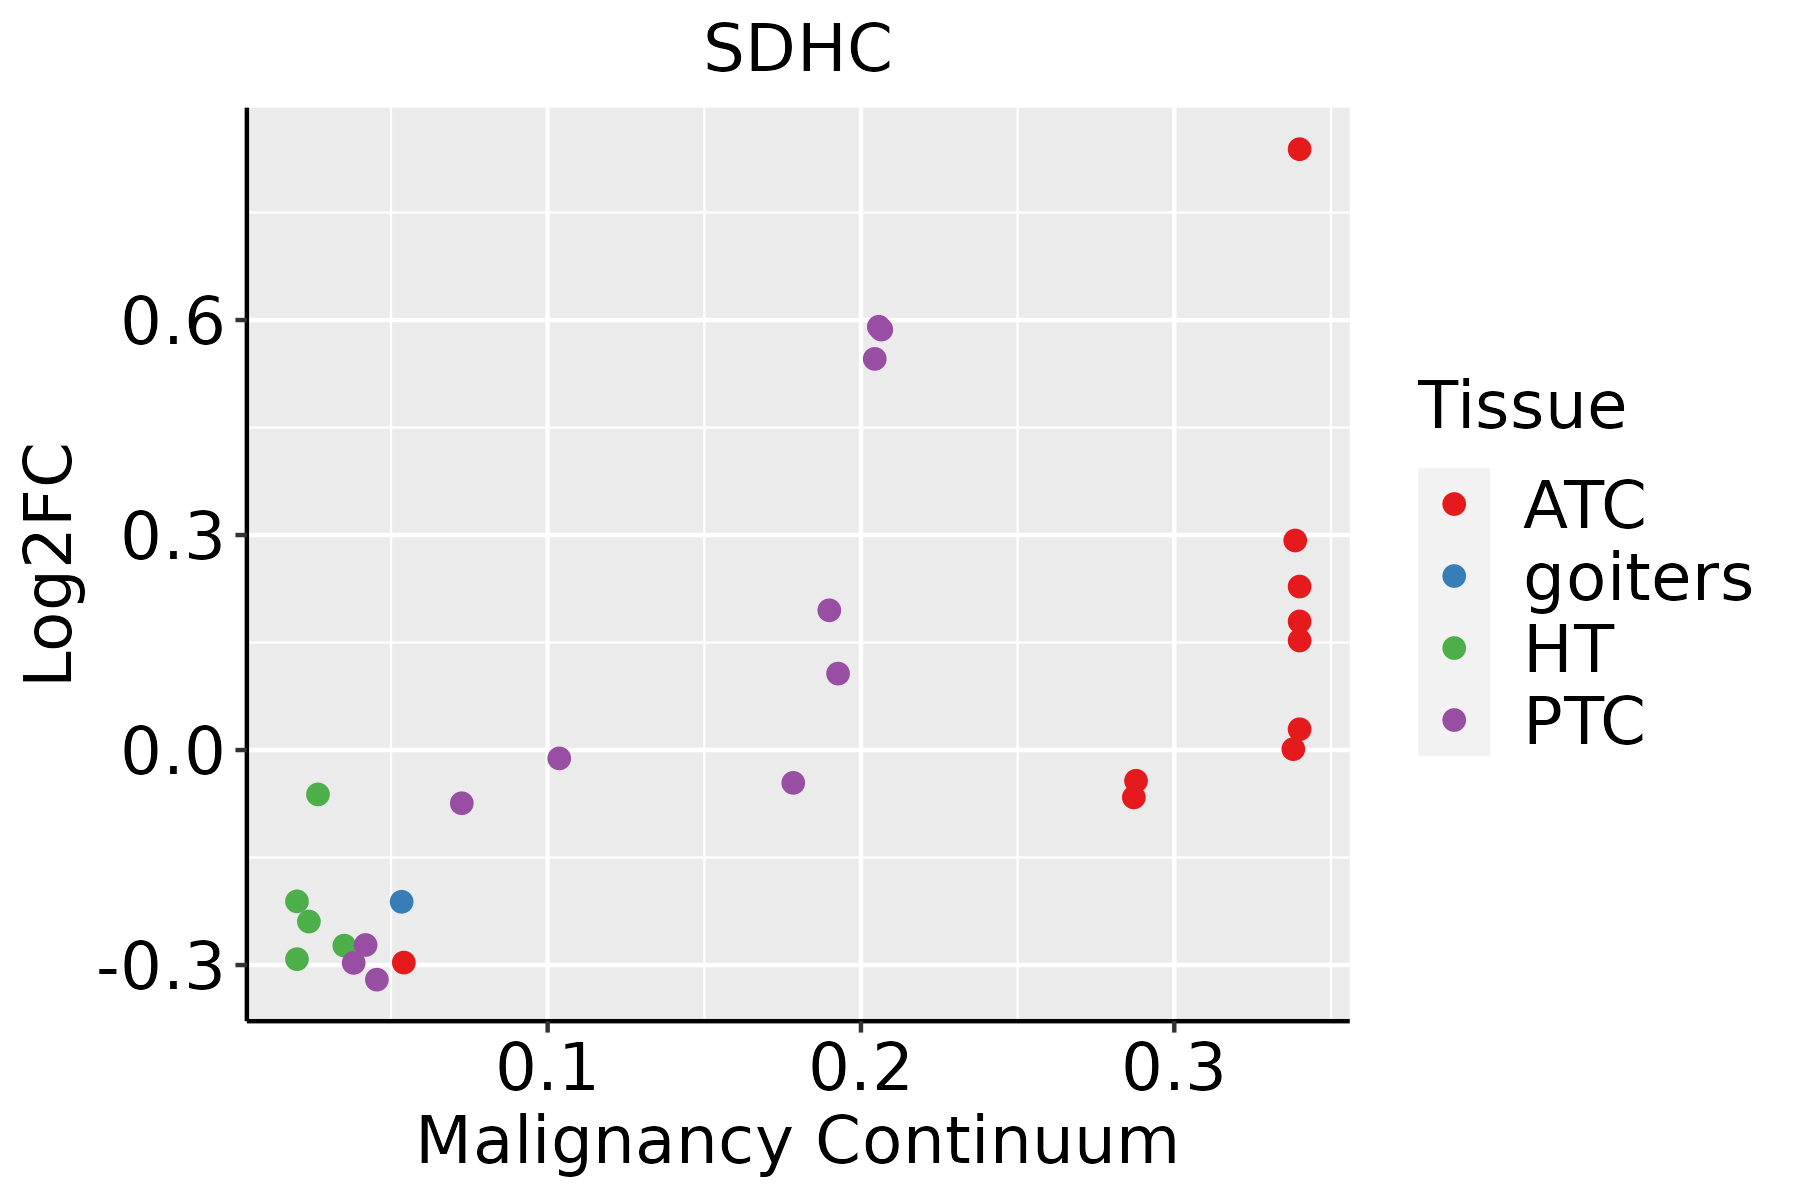 | ATC: Anaplastic thyroid cancer |
| HT: Hashimoto's thyroiditis |
| PTC: Papillary thyroid cancer |
| GO ID | Tissue | Disease Stage | Description | Gene Ratio | Bg Ratio | pvalue | p.adjust | Count |
| GO:00460349 | Breast | Precancer | ATP metabolic process | 82/1080 | 277/18723 | 1.94e-36 | 5.19e-33 | 82 |
| GO:00061199 | Breast | Precancer | oxidative phosphorylation | 53/1080 | 141/18723 | 1.15e-29 | 2.04e-26 | 53 |
| GO:00090608 | Breast | Precancer | aerobic respiration | 58/1080 | 189/18723 | 5.69e-27 | 7.62e-24 | 58 |
| GO:00060918 | Breast | Precancer | generation of precursor metabolites and energy | 94/1080 | 490/18723 | 1.54e-25 | 1.64e-22 | 94 |
| GO:00453338 | Breast | Precancer | cellular respiration | 59/1080 | 230/18723 | 5.97e-23 | 5.32e-20 | 59 |
| GO:00159808 | Breast | Precancer | energy derivation by oxidation of organic compounds | 70/1080 | 318/18723 | 8.33e-23 | 6.37e-20 | 70 |
| GO:00196468 | Breast | Precancer | aerobic electron transport chain | 34/1080 | 87/18723 | 3.95e-20 | 2.64e-17 | 34 |
| GO:00427738 | Breast | Precancer | ATP synthesis coupled electron transport | 35/1080 | 95/18723 | 1.08e-19 | 5.76e-17 | 35 |
| GO:00427758 | Breast | Precancer | mitochondrial ATP synthesis coupled electron transport | 35/1080 | 95/18723 | 1.08e-19 | 5.76e-17 | 35 |
| GO:00229048 | Breast | Precancer | respiratory electron transport chain | 35/1080 | 114/18723 | 8.51e-17 | 3.26e-14 | 35 |
| GO:00229008 | Breast | Precancer | electron transport chain | 42/1080 | 175/18723 | 1.37e-15 | 4.59e-13 | 42 |
| GO:004603414 | Breast | IDC | ATP metabolic process | 85/1434 | 277/18723 | 6.42e-30 | 1.82e-26 | 85 |
| GO:000611913 | Breast | IDC | oxidative phosphorylation | 56/1434 | 141/18723 | 1.87e-26 | 3.53e-23 | 56 |
| GO:000906013 | Breast | IDC | aerobic respiration | 61/1434 | 189/18723 | 4.42e-23 | 6.27e-20 | 61 |
| GO:000609113 | Breast | IDC | generation of precursor metabolites and energy | 103/1434 | 490/18723 | 1.53e-21 | 1.74e-18 | 103 |
| GO:004533313 | Breast | IDC | cellular respiration | 62/1434 | 230/18723 | 5.98e-19 | 4.25e-16 | 62 |
| GO:004277313 | Breast | IDC | ATP synthesis coupled electron transport | 38/1434 | 95/18723 | 1.65e-18 | 9.36e-16 | 38 |
| GO:004277513 | Breast | IDC | mitochondrial ATP synthesis coupled electron transport | 38/1434 | 95/18723 | 1.65e-18 | 9.36e-16 | 38 |
| GO:001964613 | Breast | IDC | aerobic electron transport chain | 36/1434 | 87/18723 | 3.48e-18 | 1.80e-15 | 36 |
| GO:001598013 | Breast | IDC | energy derivation by oxidation of organic compounds | 73/1434 | 318/18723 | 8.70e-18 | 3.80e-15 | 73 |
| Pathway ID | Tissue | Disease Stage | Description | Gene Ratio | Bg Ratio | pvalue | p.adjust | qvalue | Count |
| hsa0501218 | Breast | Precancer | Parkinson disease | 99/684 | 266/8465 | 3.58e-42 | 5.65e-40 | 4.33e-40 | 99 |
| hsa0502016 | Breast | Precancer | Prion disease | 95/684 | 273/8465 | 1.39e-37 | 1.46e-35 | 1.12e-35 | 95 |
| hsa0501616 | Breast | Precancer | Huntington disease | 98/684 | 306/8465 | 2.85e-35 | 2.25e-33 | 1.72e-33 | 98 |
| hsa0019016 | Breast | Precancer | Oxidative phosphorylation | 59/684 | 134/8465 | 6.15e-30 | 3.24e-28 | 2.48e-28 | 59 |
| hsa0501016 | Breast | Precancer | Alzheimer disease | 103/684 | 384/8465 | 1.03e-29 | 4.66e-28 | 3.57e-28 | 103 |
| hsa0501416 | Breast | Precancer | Amyotrophic lateral sclerosis | 98/684 | 364/8465 | 2.13e-28 | 8.41e-27 | 6.44e-27 | 98 |
| hsa0502216 | Breast | Precancer | Pathways of neurodegeneration - multiple diseases | 112/684 | 476/8465 | 6.96e-27 | 2.44e-25 | 1.87e-25 | 112 |
| hsa0520818 | Breast | Precancer | Chemical carcinogenesis - reactive oxygen species | 68/684 | 223/8465 | 3.61e-23 | 1.14e-21 | 8.73e-22 | 68 |
| hsa0471418 | Breast | Precancer | Thermogenesis | 68/684 | 232/8465 | 4.40e-22 | 1.26e-20 | 9.69e-21 | 68 |
| hsa0541518 | Breast | Precancer | Diabetic cardiomyopathy | 63/684 | 203/8465 | 5.63e-22 | 1.48e-20 | 1.14e-20 | 63 |
| hsa0493216 | Breast | Precancer | Non-alcoholic fatty liver disease | 48/684 | 155/8465 | 6.16e-17 | 1.50e-15 | 1.15e-15 | 48 |
| hsa0120012 | Breast | Precancer | Carbon metabolism | 18/684 | 115/8465 | 4.79e-03 | 2.75e-02 | 2.11e-02 | 18 |
| hsa0501219 | Breast | Precancer | Parkinson disease | 99/684 | 266/8465 | 3.58e-42 | 5.65e-40 | 4.33e-40 | 99 |
| hsa0502017 | Breast | Precancer | Prion disease | 95/684 | 273/8465 | 1.39e-37 | 1.46e-35 | 1.12e-35 | 95 |
| hsa0501617 | Breast | Precancer | Huntington disease | 98/684 | 306/8465 | 2.85e-35 | 2.25e-33 | 1.72e-33 | 98 |
| hsa0019017 | Breast | Precancer | Oxidative phosphorylation | 59/684 | 134/8465 | 6.15e-30 | 3.24e-28 | 2.48e-28 | 59 |
| hsa0501017 | Breast | Precancer | Alzheimer disease | 103/684 | 384/8465 | 1.03e-29 | 4.66e-28 | 3.57e-28 | 103 |
| hsa0501417 | Breast | Precancer | Amyotrophic lateral sclerosis | 98/684 | 364/8465 | 2.13e-28 | 8.41e-27 | 6.44e-27 | 98 |
| hsa0502217 | Breast | Precancer | Pathways of neurodegeneration - multiple diseases | 112/684 | 476/8465 | 6.96e-27 | 2.44e-25 | 1.87e-25 | 112 |
| hsa0520819 | Breast | Precancer | Chemical carcinogenesis - reactive oxygen species | 68/684 | 223/8465 | 3.61e-23 | 1.14e-21 | 8.73e-22 | 68 |
| Hugo Symbol | Variant Class | Variant Classification | dbSNP RS | HGVSc | HGVSp | HGVSp Short | SWISSPROT | BIOTYPE | SIFT | PolyPhen | Tumor Sample Barcode | Tissue | Histology | Sex | Age | Stage | Therapy Types | Drugs | Outcome |
| SDHC | SNV | Missense_Mutation | | c.436N>T | p.Pro146Ser | p.P146S | Q99643 | protein_coding | tolerated(0.2) | benign(0.014) | TCGA-AP-A059-01 | Endometrium | uterine corpus endometrioid carcinoma | Female | >=65 | I/II | Unknown | Unknown | SD |
| SDHC | SNV | Missense_Mutation | rs769177037 | c.149N>A | p.Arg50His | p.R50H | Q99643 | protein_coding | tolerated(0.06) | benign(0.382) | TCGA-AX-A0IZ-01 | Endometrium | uterine corpus endometrioid carcinoma | Female | <65 | I/II | Unknown | Unknown | SD |
| SDHC | SNV | Missense_Mutation | rs749402669 | c.265G>A | p.Ala89Thr | p.A89T | Q99643 | protein_coding | tolerated(0.13) | benign(0.236) | TCGA-AX-A2HD-01 | Endometrium | uterine corpus endometrioid carcinoma | Female | >=65 | III/IV | Unknown | Unknown | SD |
| SDHC | SNV | Missense_Mutation | novel | c.140G>A | p.Gly47Asp | p.G47D | Q99643 | protein_coding | tolerated(0.17) | benign(0) | TCGA-B5-A1MX-01 | Endometrium | uterine corpus endometrioid carcinoma | Female | <65 | I/II | Hormone Therapy | megace | SD |
| SDHC | SNV | Missense_Mutation | novel | c.275N>C | p.Leu92Pro | p.L92P | Q99643 | protein_coding | deleterious(0) | possibly_damaging(0.772) | TCGA-B5-A3FA-01 | Endometrium | uterine corpus endometrioid carcinoma | Female | >=65 | I/II | Unknown | Unknown | SD |
| SDHC | SNV | Missense_Mutation | novel | c.352N>C | p.Phe118Leu | p.F118L | Q99643 | protein_coding | deleterious(0.01) | benign(0.171) | TCGA-DI-A1BU-01 | Endometrium | uterine corpus endometrioid carcinoma | Female | <65 | I/II | Chemotherapy | paclitaxel | SD |
| SDHC | deletion | Frame_Shift_Del | novel | c.423delA | p.Gly142AlafsTer2 | p.G142Afs*2 | Q99643 | protein_coding | | | TCGA-EY-A5W2-01 | Endometrium | uterine corpus endometrioid carcinoma | Female | >=65 | I/II | Unknown | Unknown | SD |
| SDHC | SNV | Missense_Mutation | novel | c.312N>C | p.Lys104Asn | p.K104N | Q99643 | protein_coding | deleterious(0.01) | possibly_damaging(0.837) | TCGA-43-7656-01 | Lung | lung squamous cell carcinoma | Male | >=65 | I/II | Unknown | Unknown | SD |
| SDHC | insertion | In_Frame_Ins | novel | c.179_179+1insTTGGTCTCTTCCCAT | p.Pro64_Met65insIleTrpSerLeuPro | p.P64_M65insIWSLP | Q99643 | protein_coding | | | TCGA-D6-A6EP-01 | Oral cavity | head & neck squamous cell carcinoma | Male | <65 | III/IV | Unknown | Unknown | SD |
| SDHC | SNV | Missense_Mutation | | c.242N>A | p.Gly81Glu | p.G81E | Q99643 | protein_coding | deleterious(0.01) | probably_damaging(0.986) | TCGA-EJ-8472-01 | Prostate | prostate adenocarcinoma | Male | <65 | 8 | Unknown | Unknown | PD |


