
|
|||||
|
 | |
| |
| |
| |
| |
| |
|
Gene: RNF43 |
Gene summary for RNF43 |
| Gene information | Species | Human | Gene symbol | RNF43 | Gene ID | 54894 |
| Gene name | ring finger protein 43 | |
| Gene Alias | RNF124 | |
| Cytomap | 17q22 | |
| Gene Type | protein-coding | GO ID | GO:0006464 | UniProtAcc | Q68DV7 |
Top |
Malignant transformation analysis |
| Identification of the aberrant gene expression in precancerous and cancerous lesions by comparing the gene expression of stem-like cells in diseased tissues with normal stem cells |
| Entrez ID | Symbol | Replicates | Species | Organ | Tissue | Adj P-value | Log2FC | Malignancy |
| 54894 | RNF43 | HTA11_8622_2000001021 | Human | Colorectum | SER | 1.26e-04 | -6.80e-01 | 0.0528 |
| 54894 | RNF43 | HTA11_6801_2000001011 | Human | Colorectum | SER | 6.80e-05 | -7.47e-01 | 0.0171 |
| 54894 | RNF43 | HTA11_7696_3000711011 | Human | Colorectum | AD | 3.89e-11 | -4.82e-01 | 0.0674 |
| 54894 | RNF43 | HTA11_7469_2000001011 | Human | Colorectum | AD | 6.24e-04 | -1.09e+00 | -0.0124 |
| 54894 | RNF43 | HTA11_6818_2000001021 | Human | Colorectum | AD | 3.41e-12 | -7.40e-01 | 0.0588 |
| 54894 | RNF43 | HTA11_99999970781_79442 | Human | Colorectum | MSS | 5.14e-31 | -7.63e-01 | 0.294 |
| 54894 | RNF43 | HTA11_99999971662_82457 | Human | Colorectum | MSS | 3.68e-05 | -2.64e-01 | 0.3859 |
| 54894 | RNF43 | F007 | Human | Colorectum | FAP | 6.35e-28 | 7.07e-01 | 0.1176 |
| 54894 | RNF43 | A002-C-010 | Human | Colorectum | FAP | 1.82e-51 | 7.04e-01 | 0.242 |
| 54894 | RNF43 | A001-C-207 | Human | Colorectum | FAP | 1.50e-28 | 6.71e-01 | 0.1278 |
| 54894 | RNF43 | A015-C-203 | Human | Colorectum | FAP | 3.05e-37 | 4.65e-01 | -0.1294 |
| 54894 | RNF43 | A015-C-204 | Human | Colorectum | FAP | 2.64e-11 | 3.55e-01 | -0.0228 |
| 54894 | RNF43 | A014-C-040 | Human | Colorectum | FAP | 1.37e-08 | 3.83e-01 | -0.1184 |
| 54894 | RNF43 | A002-C-201 | Human | Colorectum | FAP | 5.33e-28 | 4.83e-01 | 0.0324 |
| 54894 | RNF43 | A002-C-203 | Human | Colorectum | FAP | 3.44e-47 | 6.84e-01 | 0.2786 |
| 54894 | RNF43 | A001-C-119 | Human | Colorectum | FAP | 1.41e-10 | 1.65e-01 | -0.1557 |
| 54894 | RNF43 | A001-C-108 | Human | Colorectum | FAP | 1.97e-24 | 4.29e-01 | -0.0272 |
| 54894 | RNF43 | A002-C-021 | Human | Colorectum | FAP | 1.56e-32 | 6.42e-01 | 0.1171 |
| 54894 | RNF43 | A002-C-205 | Human | Colorectum | FAP | 8.61e-31 | 3.38e-01 | -0.1236 |
| 54894 | RNF43 | A001-C-104 | Human | Colorectum | FAP | 1.13e-30 | 5.21e-01 | 0.0184 |
| Page: 1 2 3 4 5 6 7 |
| Tissue | Expression Dynamics | Abbreviation |
| Colorectum (GSE201348) | 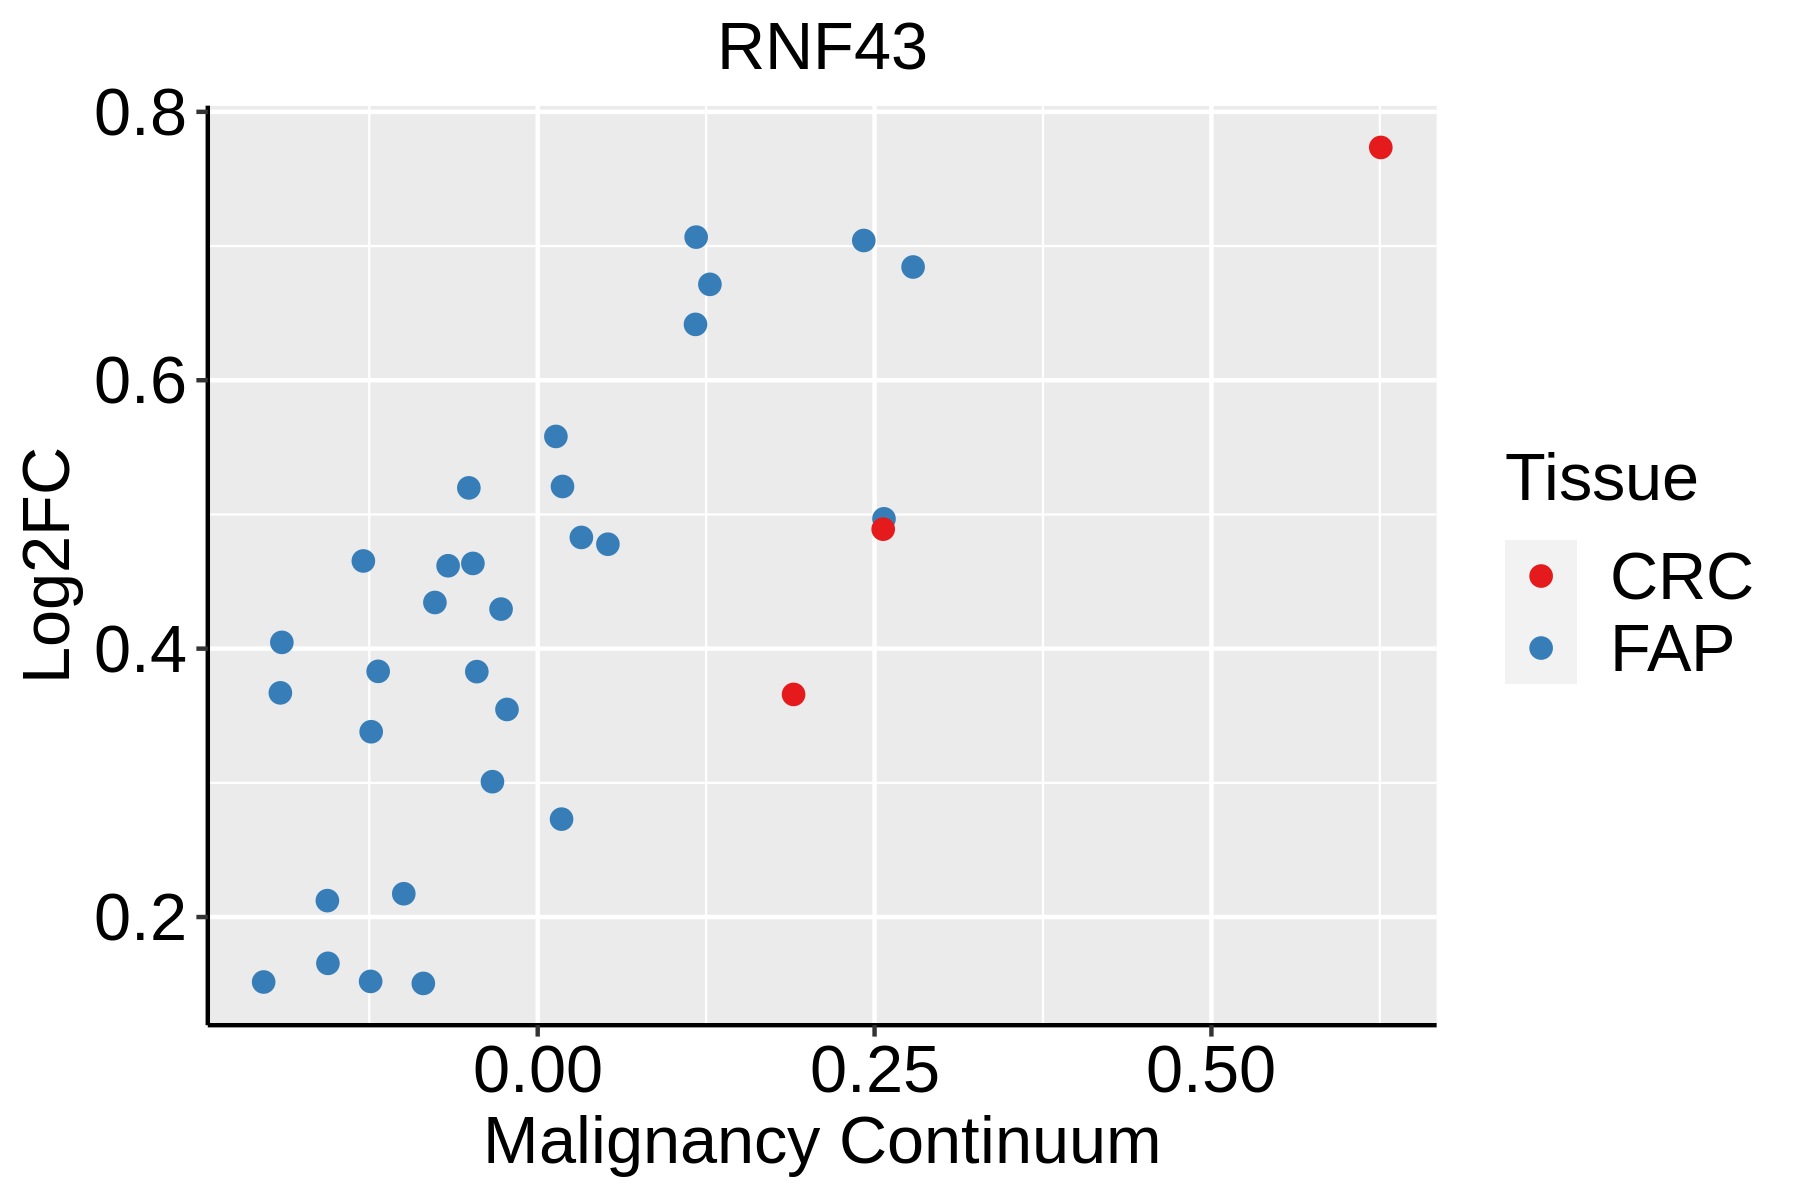 | FAP: Familial adenomatous polyposis |
| CRC: Colorectal cancer | ||
| Colorectum (HTA11) | 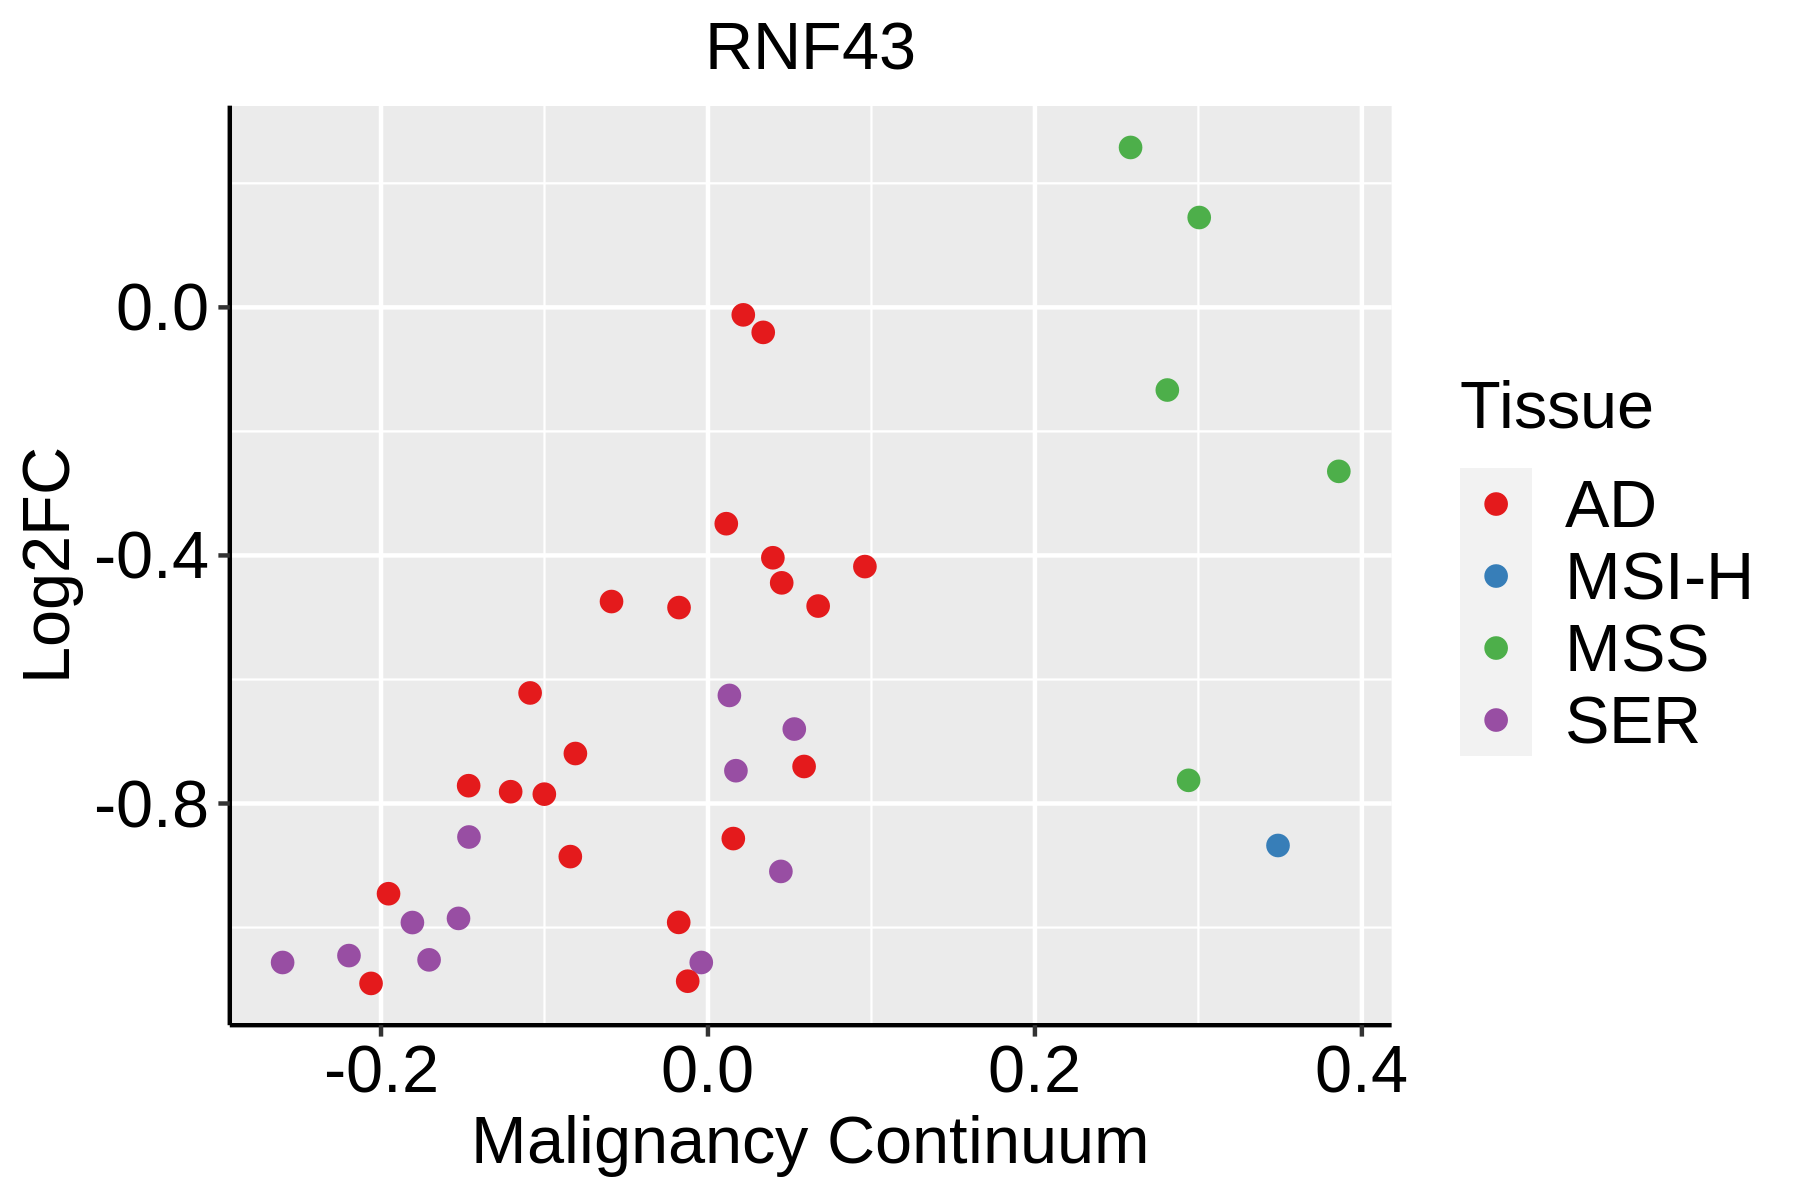 | AD: Adenomas |
| SER: Sessile serrated lesions | ||
| MSI-H: Microsatellite-high colorectal cancer | ||
| MSS: Microsatellite stable colorectal cancer | ||
| Esophagus |  | ESCC: Esophageal squamous cell carcinoma |
| HGIN: High-grade intraepithelial neoplasias | ||
| LGIN: Low-grade intraepithelial neoplasias | ||
| Liver | 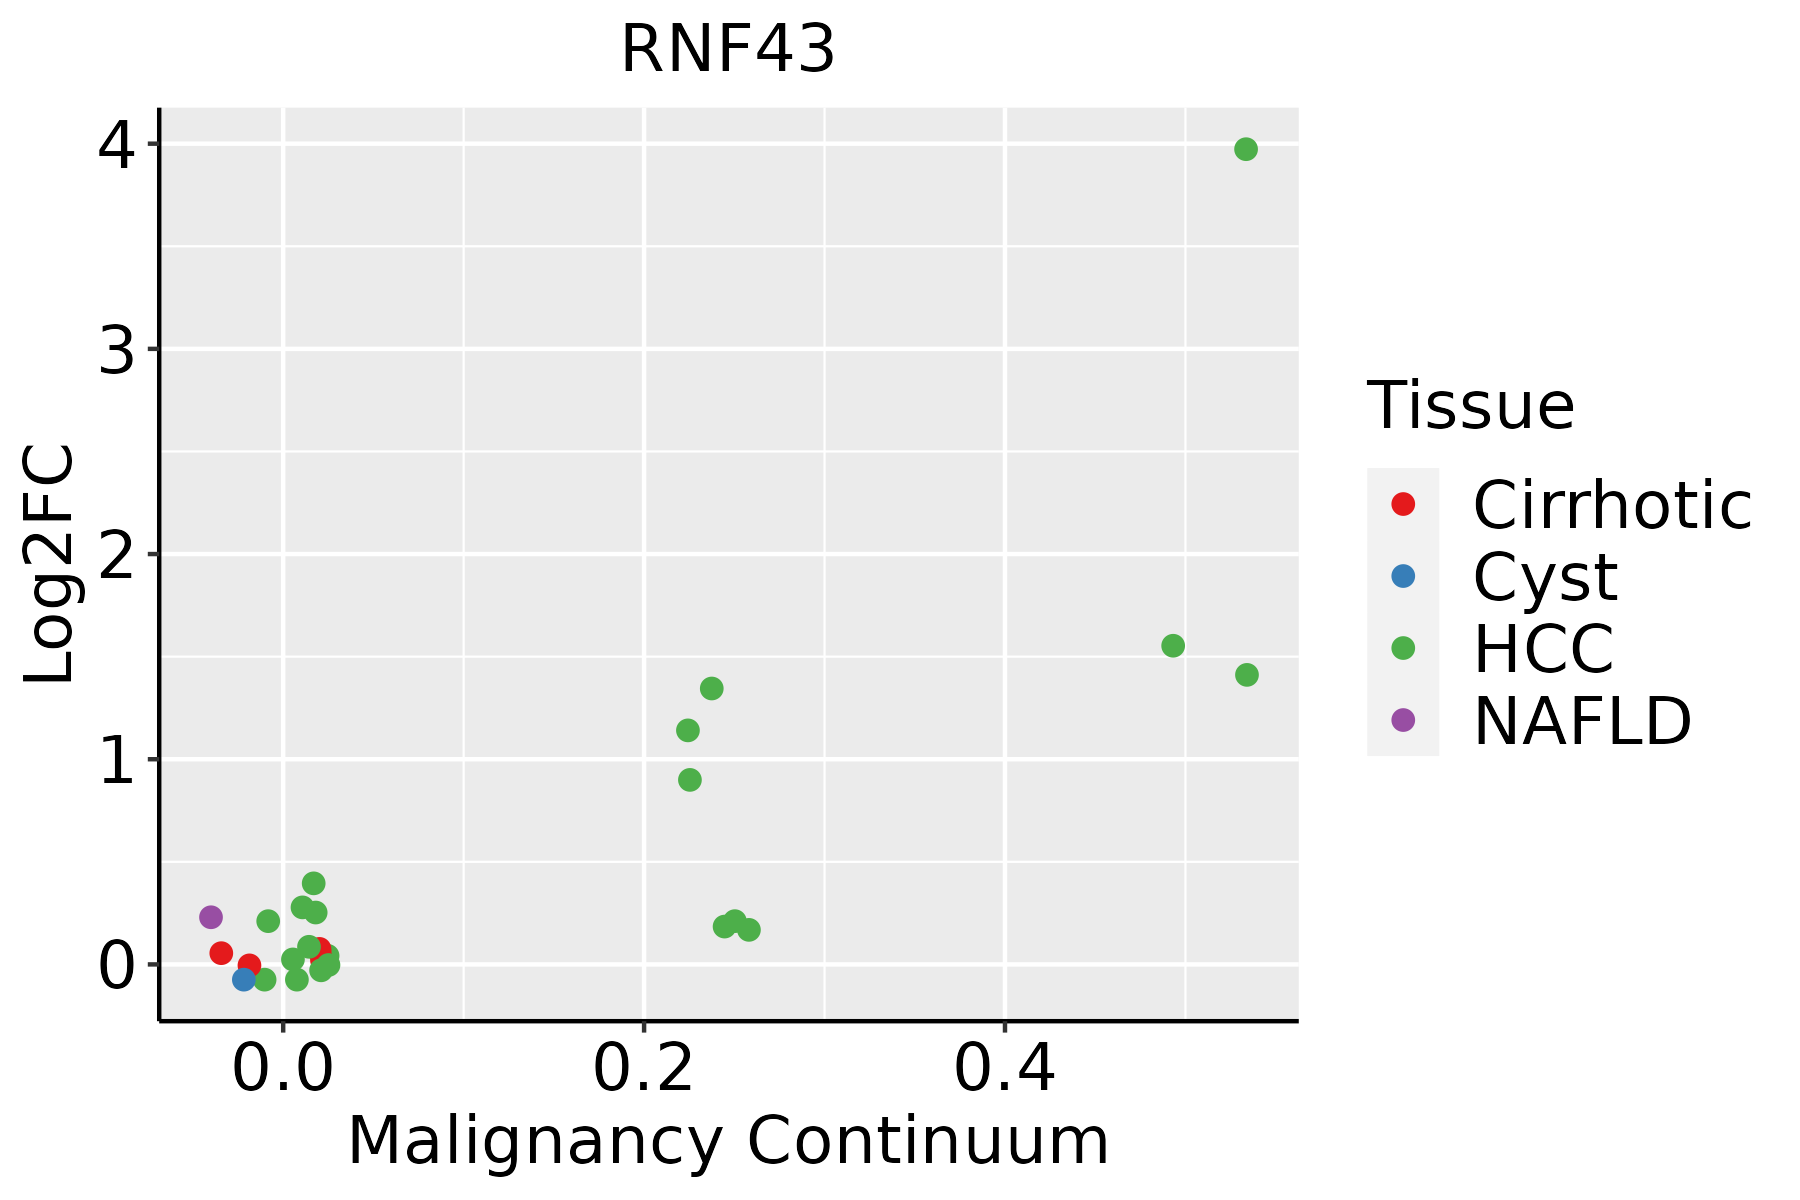 | HCC: Hepatocellular carcinoma |
| NAFLD: Non-alcoholic fatty liver disease |
| ∗log2FC in expression of this searched gene in stem-like cells from each diseased tissue sample relative to stem-like cells in normal samples in each tissue plotted against the malignancy continuum. Samples are colored based on if they are from different disease stage. |
Top |
Malignant transformation related pathway analysis |
| Find out the enriched GO biological processes and KEGG pathways involved in transition from healthy to precancer to cancer |
| Tissue | Disease Stage | Enriched GO biological Processes |
| Colorectum | AD |  |
| Colorectum | SER |  |
| Colorectum | MSS |  |
| Colorectum | MSI-H |  |
| Colorectum | FAP |  |
| ∗Top 15 enriched GO BP terms are showed in the bar plot of each disease state in each tissue. Each row represents a significant GO biological process which is colored according to the -log10(p.adjust). |
| Page: 1 2 3 4 5 6 7 8 9 |
| GO ID | Tissue | Disease Stage | Description | Gene Ratio | Bg Ratio | pvalue | p.adjust | Count |
| GO:0043112 | Colorectum | AD | receptor metabolic process | 62/3918 | 166/18723 | 8.18e-07 | 2.85e-05 | 62 |
| GO:0030111 | Colorectum | AD | regulation of Wnt signaling pathway | 102/3918 | 328/18723 | 8.51e-06 | 2.03e-04 | 102 |
| GO:0016055 | Colorectum | AD | Wnt signaling pathway | 130/3918 | 444/18723 | 1.60e-05 | 3.37e-04 | 130 |
| GO:0198738 | Colorectum | AD | cell-cell signaling by wnt | 130/3918 | 446/18723 | 2.02e-05 | 4.10e-04 | 130 |
| GO:0032801 | Colorectum | AD | receptor catabolic process | 12/3918 | 28/18723 | 7.21e-03 | 4.39e-02 | 12 |
| GO:00160551 | Colorectum | SER | Wnt signaling pathway | 97/2897 | 444/18723 | 2.02e-04 | 3.68e-03 | 97 |
| GO:01987381 | Colorectum | SER | cell-cell signaling by wnt | 97/2897 | 446/18723 | 2.39e-04 | 4.11e-03 | 97 |
| GO:00301111 | Colorectum | SER | regulation of Wnt signaling pathway | 75/2897 | 328/18723 | 2.47e-04 | 4.20e-03 | 75 |
| GO:00301112 | Colorectum | MSS | regulation of Wnt signaling pathway | 98/3467 | 328/18723 | 3.37e-07 | 1.36e-05 | 98 |
| GO:00160552 | Colorectum | MSS | Wnt signaling pathway | 124/3467 | 444/18723 | 6.06e-07 | 2.26e-05 | 124 |
| GO:01987382 | Colorectum | MSS | cell-cell signaling by wnt | 124/3467 | 446/18723 | 7.83e-07 | 2.77e-05 | 124 |
| GO:00431121 | Colorectum | MSS | receptor metabolic process | 57/3467 | 166/18723 | 8.47e-07 | 2.97e-05 | 57 |
| GO:0030178 | Colorectum | MSS | negative regulation of Wnt signaling pathway | 48/3467 | 170/18723 | 1.23e-03 | 1.18e-02 | 48 |
| GO:00328011 | Colorectum | MSS | receptor catabolic process | 12/3467 | 28/18723 | 2.53e-03 | 2.02e-02 | 12 |
| GO:00160553 | Colorectum | FAP | Wnt signaling pathway | 104/2622 | 444/18723 | 4.92e-08 | 3.92e-06 | 104 |
| GO:01987383 | Colorectum | FAP | cell-cell signaling by wnt | 104/2622 | 446/18723 | 6.26e-08 | 4.54e-06 | 104 |
| GO:00301113 | Colorectum | FAP | regulation of Wnt signaling pathway | 81/2622 | 328/18723 | 1.44e-07 | 9.03e-06 | 81 |
| GO:00431122 | Colorectum | FAP | receptor metabolic process | 46/2622 | 166/18723 | 2.70e-06 | 1.02e-04 | 46 |
| GO:00301781 | Colorectum | FAP | negative regulation of Wnt signaling pathway | 38/2622 | 170/18723 | 2.06e-03 | 1.70e-02 | 38 |
| GO:00160554 | Colorectum | CRC | Wnt signaling pathway | 88/2078 | 444/18723 | 3.91e-08 | 5.28e-06 | 88 |
| Page: 1 2 |
| Pathway ID | Tissue | Disease Stage | Description | Gene Ratio | Bg Ratio | pvalue | p.adjust | qvalue | Count |
| hsa04310 | Colorectum | AD | Wnt signaling pathway | 56/2092 | 171/8465 | 1.03e-02 | 3.93e-02 | 2.51e-02 | 56 |
| hsa043101 | Colorectum | AD | Wnt signaling pathway | 56/2092 | 171/8465 | 1.03e-02 | 3.93e-02 | 2.51e-02 | 56 |
| hsa043102 | Colorectum | MSS | Wnt signaling pathway | 53/1875 | 171/8465 | 4.24e-03 | 1.86e-02 | 1.14e-02 | 53 |
| hsa043103 | Colorectum | MSS | Wnt signaling pathway | 53/1875 | 171/8465 | 4.24e-03 | 1.86e-02 | 1.14e-02 | 53 |
| hsa043104 | Colorectum | FAP | Wnt signaling pathway | 46/1404 | 171/8465 | 3.94e-04 | 3.06e-03 | 1.86e-03 | 46 |
| hsa043105 | Colorectum | FAP | Wnt signaling pathway | 46/1404 | 171/8465 | 3.94e-04 | 3.06e-03 | 1.86e-03 | 46 |
| hsa043106 | Colorectum | CRC | Wnt signaling pathway | 40/1091 | 171/8465 | 1.01e-04 | 1.57e-03 | 1.07e-03 | 40 |
| hsa043107 | Colorectum | CRC | Wnt signaling pathway | 40/1091 | 171/8465 | 1.01e-04 | 1.57e-03 | 1.07e-03 | 40 |
| Page: 1 |
Top |
Cell-cell communication analysis |
| Identification of potential cell-cell interactions between two cell types and their ligand-receptor pairs for different disease states |
| Ligand | Receptor | LRpair | Pathway | Tissue | Disease Stage |
| Page: 1 |
Top |
Single-cell gene regulatory network inference analysis |
| Find out the significant the regulons (TFs) and the target genes of each regulon across cell types for different disease states |
| TF | Cell Type | Tissue | Disease Stage | Target Gene | RSS | Regulon Activity |
| ∗The dot plots of a searched regulon are shown for all cell subpopulations in each disease state of each tissue based on the regulon specific score inferred using pySCENIC and by calculating the average expression. |
| Page: 1 |
Top |
Somatic mutation of malignant transformation related genes |
| Annotation of somatic variants for genes involved in malignant transformation |
| Hugo Symbol | Variant Class | Variant Classification | dbSNP RS | HGVSc | HGVSp | HGVSp Short | SWISSPROT | BIOTYPE | SIFT | PolyPhen | Tumor Sample Barcode | Tissue | Histology | Sex | Age | Stage | Therapy Types | Drugs | Outcome |
| RNF43 | SNV | Missense_Mutation | c.1882N>A | p.Asp628Asn | p.D628N | Q68DV7 | protein_coding | tolerated_low_confidence(0.08) | benign(0.023) | TCGA-AC-A23H-01 | Breast | breast invasive carcinoma | Female | >=65 | I/II | Unknown | Unknown | PD | |
| RNF43 | SNV | Missense_Mutation | c.272N>A | p.Cys91Tyr | p.C91Y | Q68DV7 | protein_coding | deleterious(0) | probably_damaging(0.997) | TCGA-AN-A0AK-01 | Breast | breast invasive carcinoma | Female | >=65 | I/II | Unknown | Unknown | SD | |
| RNF43 | SNV | Missense_Mutation | c.2290G>T | p.Val764Leu | p.V764L | Q68DV7 | protein_coding | deleterious_low_confidence(0.02) | benign(0.168) | TCGA-BH-A0B4-01 | Breast | breast invasive carcinoma | Male | >=65 | III/IV | Hormone Therapy | tamoxiphen | SD | |
| RNF43 | SNV | Missense_Mutation | rs200066146 | c.1820N>T | p.Ser607Leu | p.S607L | Q68DV7 | protein_coding | tolerated_low_confidence(0.09) | benign(0) | TCGA-BH-A18P-01 | Breast | breast invasive carcinoma | Female | <65 | I/II | Unknown | Unknown | PD |
| RNF43 | SNV | Missense_Mutation | c.181N>A | p.Leu61Met | p.L61M | Q68DV7 | protein_coding | deleterious_low_confidence(0.04) | possibly_damaging(0.862) | TCGA-D8-A1XQ-01 | Breast | breast invasive carcinoma | Female | >=65 | I/II | Unknown | Unknown | SD | |
| RNF43 | SNV | Missense_Mutation | rs200066146 | c.1820C>T | p.Ser607Leu | p.S607L | Q68DV7 | protein_coding | tolerated_low_confidence(0.09) | benign(0) | TCGA-E2-A1B5-01 | Breast | breast invasive carcinoma | Female | <65 | I/II | Hormone Therapy | tamoxiphen | SD |
| RNF43 | deletion | Frame_Shift_Del | rs781215815 | c.1976delN | p.Gly659ValfsTer41 | p.G659Vfs*41 | Q68DV7 | protein_coding | TCGA-A8-A09Z-01 | Breast | breast invasive carcinoma | Female | >=65 | I/II | Unknown | Unknown | SD | ||
| RNF43 | insertion | Frame_Shift_Ins | novel | c.1627_1628insTGCCACCATACCCAGCTAATTTTTGTATTTTTAGTAG | p.Gln543LeufsTer65 | p.Q543Lfs*65 | Q68DV7 | protein_coding | TCGA-AN-A049-01 | Breast | breast invasive carcinoma | Female | <65 | I/II | Unknown | Unknown | SD | ||
| RNF43 | deletion | Frame_Shift_Del | c.1539_1551delTAAAGGGGATCCC | p.Lys514SerfsTer9 | p.K514Sfs*9 | Q68DV7 | protein_coding | TCGA-AN-A04D-01 | Breast | breast invasive carcinoma | Female | <65 | I/II | Unknown | Unknown | SD | |||
| RNF43 | deletion | Frame_Shift_Del | rs781215815 | c.1976delN | p.Gly659ValfsTer41 | p.G659Vfs*41 | Q68DV7 | protein_coding | TCGA-BH-A18G-01 | Breast | breast invasive carcinoma | Female | >=65 | I/II | Unknown | Unknown | SD |
| Page: 1 2 3 4 5 6 7 8 9 10 11 12 13 14 15 16 17 18 19 20 21 22 23 24 25 |
Top |
Related drugs of malignant transformation related genes |
| Identification of chemicals and drugs interact with genes involved in malignant transfromation |
| (DGIdb 4.0) |
| Entrez ID | Symbol | Category | Interaction Types | Drug Claim Name | Drug Name | PMIDs |
| 54894 | RNF43 | ENZYME, CLINICALLY ACTIONABLE | RNF43-721 | 22977472 |
| Page: 1 |

Copyright 2023-Present -The University of Texas Health Science Center at Houston |