
|
|||||
|
 | |
| |
| |
| |
| |
| |
|
Gene: RNF25 |
Gene summary for RNF25 |
| Gene information | Species | Human | Gene symbol | RNF25 | Gene ID | 64320 |
| Gene name | ring finger protein 25 | |
| Gene Alias | AO7 | |
| Cytomap | 2q35 | |
| Gene Type | protein-coding | GO ID | GO:0006139 | UniProtAcc | Q96BH1 |
Top |
Malignant transformation analysis |
| Identification of the aberrant gene expression in precancerous and cancerous lesions by comparing the gene expression of stem-like cells in diseased tissues with normal stem cells |
| Entrez ID | Symbol | Replicates | Species | Organ | Tissue | Adj P-value | Log2FC | Malignancy |
| 64320 | RNF25 | P27T-E | Human | Esophagus | ESCC | 4.80e-11 | 1.77e-01 | 0.1055 |
| 64320 | RNF25 | P28T-E | Human | Esophagus | ESCC | 5.39e-07 | 2.35e-01 | 0.1149 |
| 64320 | RNF25 | P30T-E | Human | Esophagus | ESCC | 2.68e-12 | 3.37e-01 | 0.137 |
| 64320 | RNF25 | P31T-E | Human | Esophagus | ESCC | 2.90e-15 | 2.98e-01 | 0.1251 |
| 64320 | RNF25 | P32T-E | Human | Esophagus | ESCC | 1.65e-23 | 4.98e-01 | 0.1666 |
| 64320 | RNF25 | P36T-E | Human | Esophagus | ESCC | 2.60e-05 | 1.63e-01 | 0.1187 |
| 64320 | RNF25 | P37T-E | Human | Esophagus | ESCC | 3.07e-09 | 1.10e-01 | 0.1371 |
| 64320 | RNF25 | P39T-E | Human | Esophagus | ESCC | 1.47e-06 | 4.89e-02 | 0.0894 |
| 64320 | RNF25 | P40T-E | Human | Esophagus | ESCC | 7.07e-04 | 1.28e-01 | 0.109 |
| 64320 | RNF25 | P42T-E | Human | Esophagus | ESCC | 2.87e-05 | 1.23e-01 | 0.1175 |
| 64320 | RNF25 | P44T-E | Human | Esophagus | ESCC | 3.18e-04 | 9.30e-02 | 0.1096 |
| 64320 | RNF25 | P47T-E | Human | Esophagus | ESCC | 4.05e-05 | 6.86e-02 | 0.1067 |
| 64320 | RNF25 | P48T-E | Human | Esophagus | ESCC | 4.26e-05 | 6.71e-02 | 0.0959 |
| 64320 | RNF25 | P49T-E | Human | Esophagus | ESCC | 1.40e-09 | 9.26e-01 | 0.1768 |
| 64320 | RNF25 | P52T-E | Human | Esophagus | ESCC | 2.13e-18 | 2.23e-01 | 0.1555 |
| 64320 | RNF25 | P54T-E | Human | Esophagus | ESCC | 5.21e-10 | 2.01e-01 | 0.0975 |
| 64320 | RNF25 | P56T-E | Human | Esophagus | ESCC | 4.61e-04 | 8.63e-01 | 0.1613 |
| 64320 | RNF25 | P57T-E | Human | Esophagus | ESCC | 8.27e-04 | 1.28e-01 | 0.0926 |
| 64320 | RNF25 | P61T-E | Human | Esophagus | ESCC | 1.55e-10 | 2.52e-01 | 0.099 |
| 64320 | RNF25 | P62T-E | Human | Esophagus | ESCC | 2.45e-24 | 4.03e-01 | 0.1302 |
| Page: 1 2 3 4 |
| Tissue | Expression Dynamics | Abbreviation |
| Esophagus | 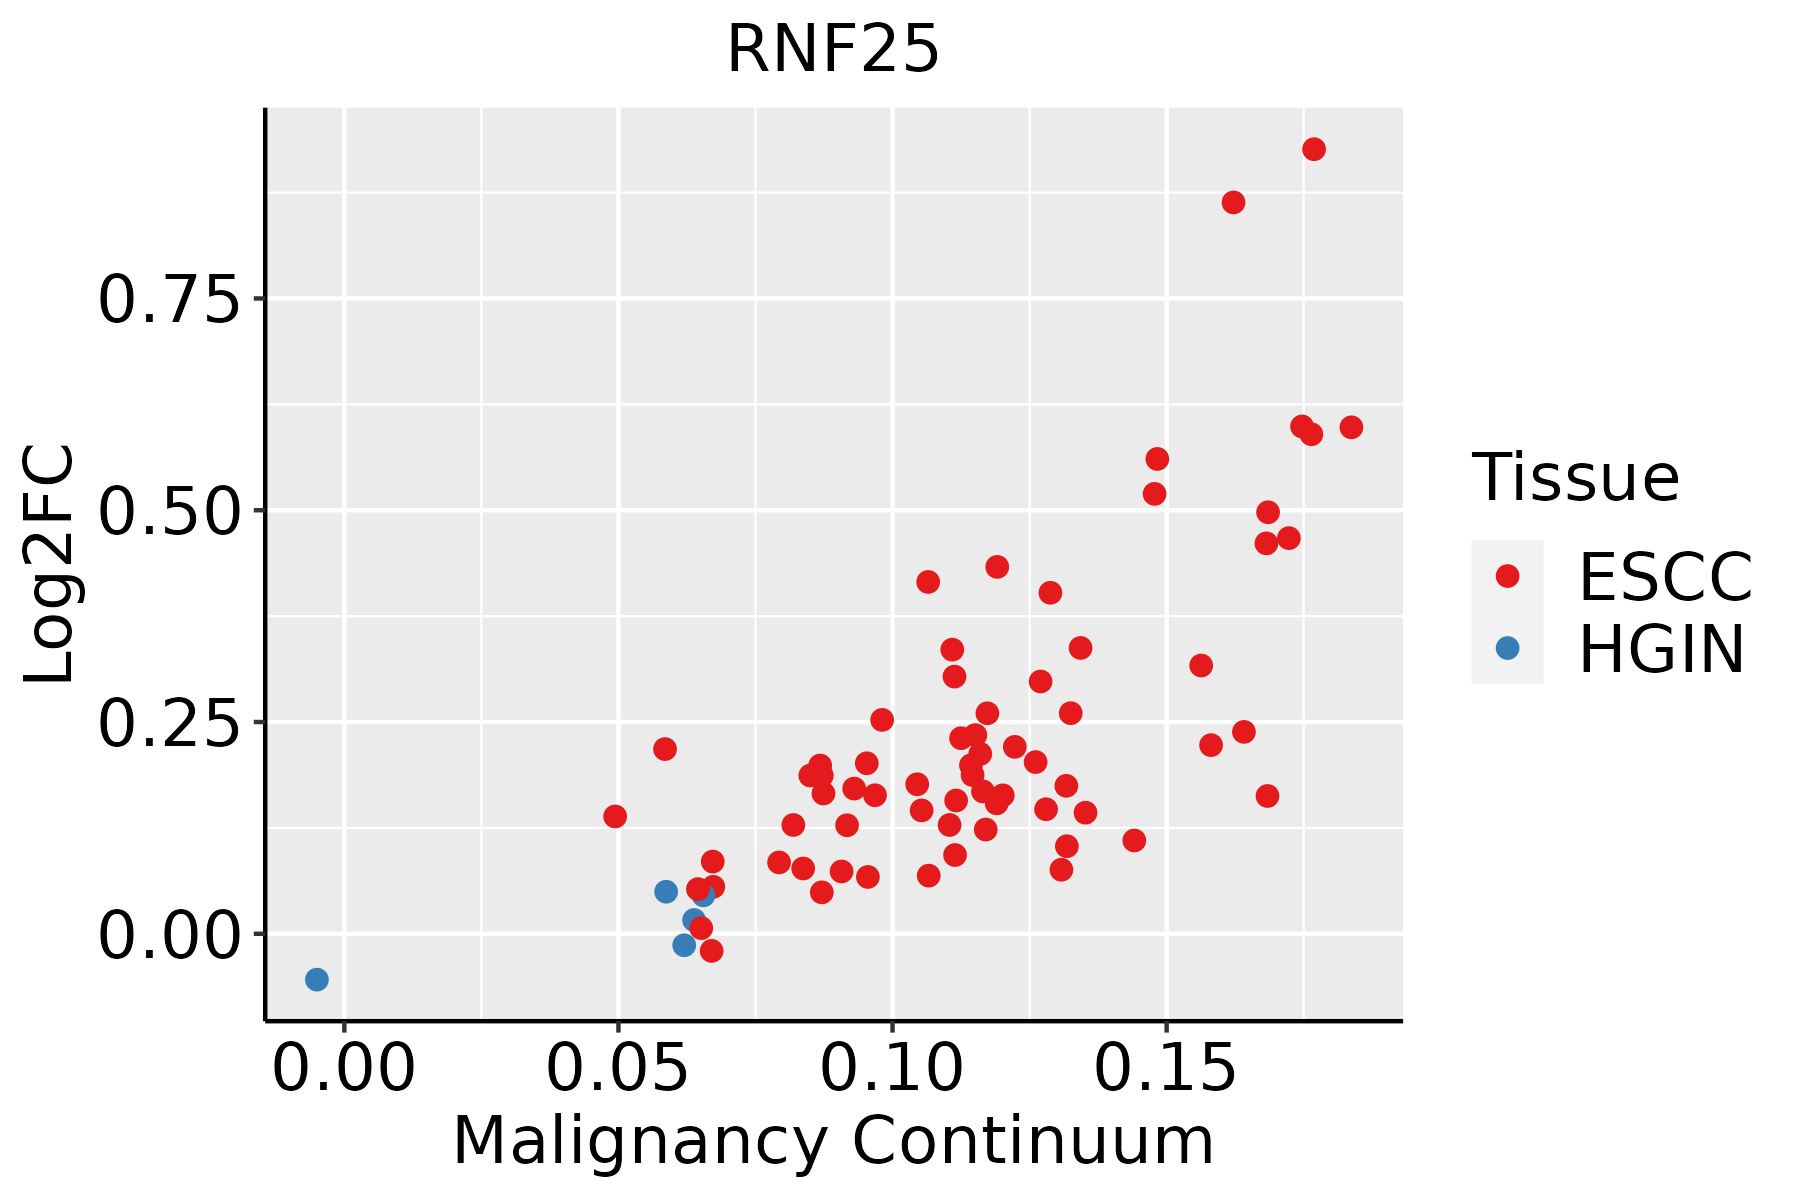 | ESCC: Esophageal squamous cell carcinoma |
| HGIN: High-grade intraepithelial neoplasias | ||
| LGIN: Low-grade intraepithelial neoplasias | ||
| Liver |  | HCC: Hepatocellular carcinoma |
| NAFLD: Non-alcoholic fatty liver disease | ||
| Oral Cavity | 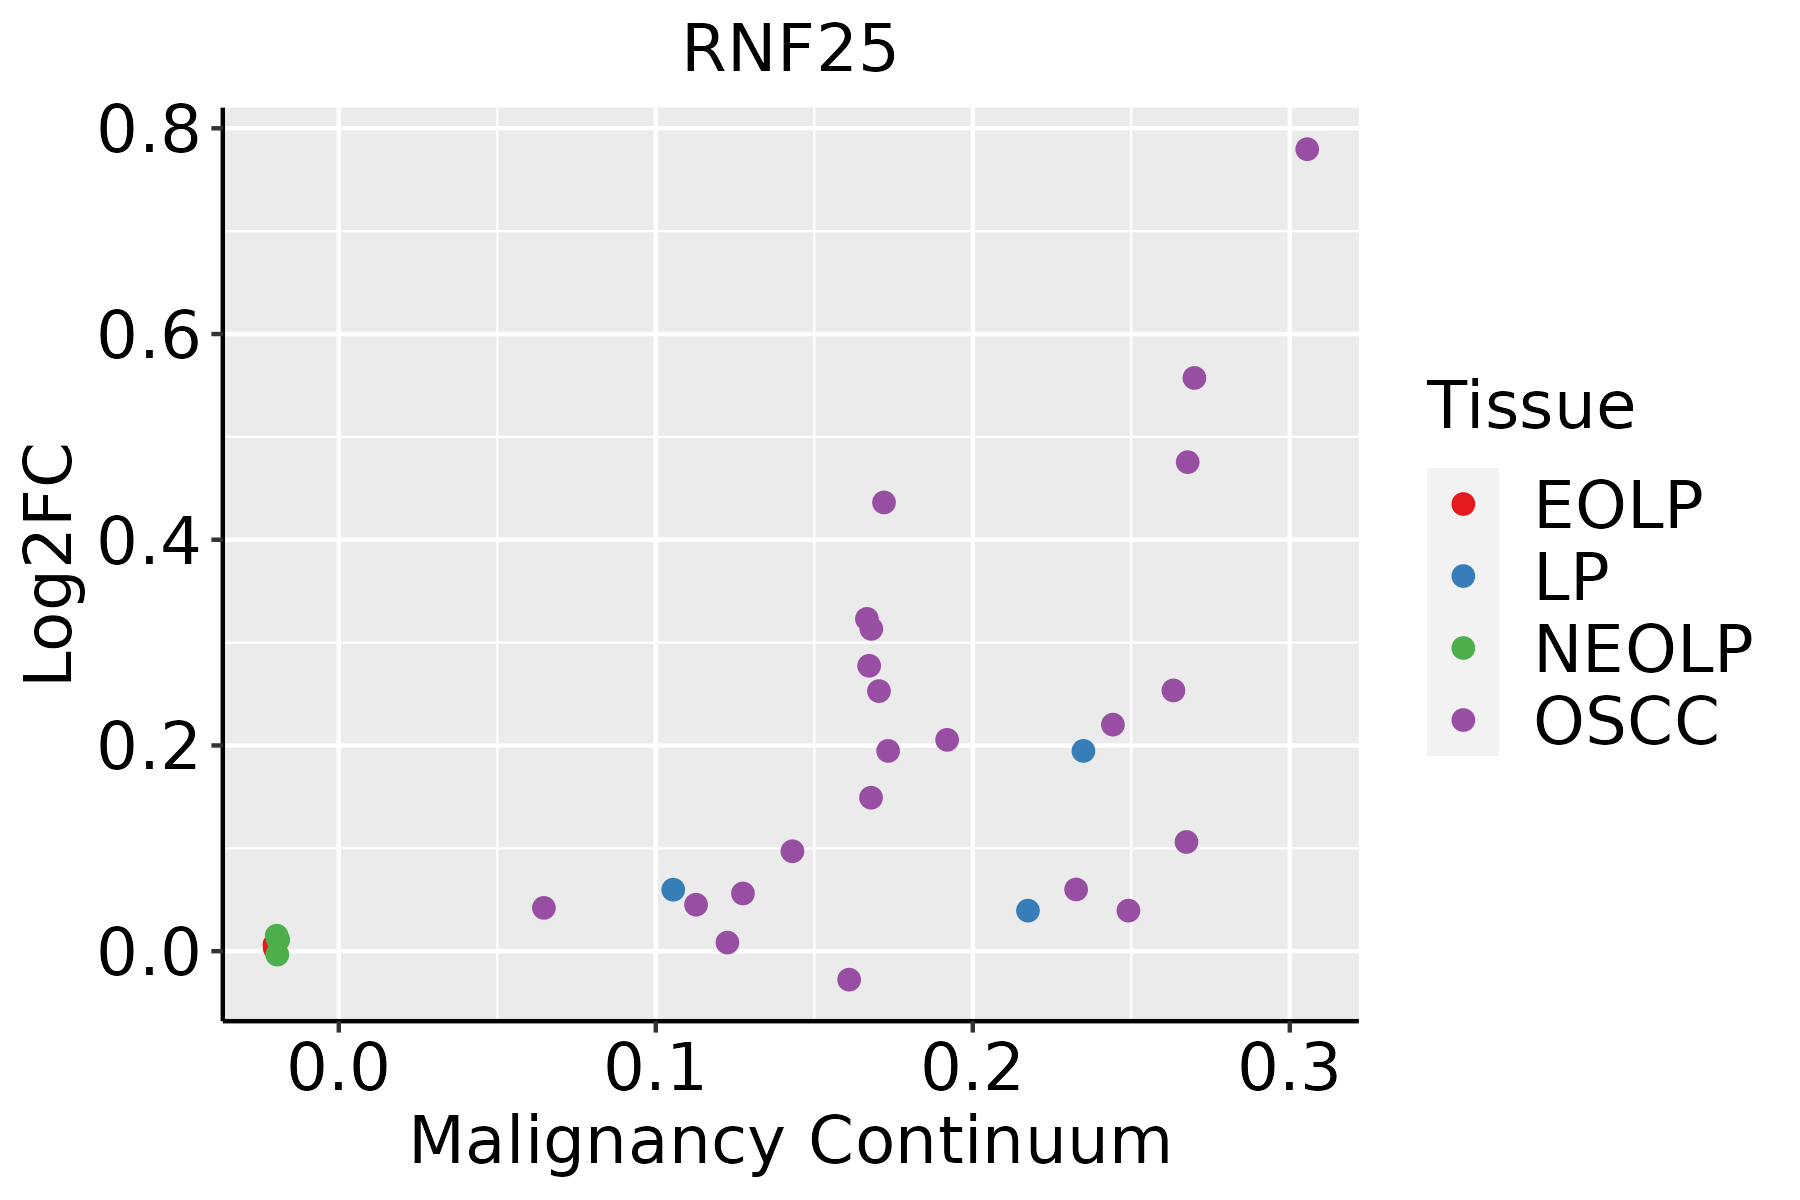 | EOLP: Erosive Oral lichen planus |
| LP: leukoplakia | ||
| NEOLP: Non-erosive oral lichen planus | ||
| OSCC: Oral squamous cell carcinoma |
| ∗log2FC in expression of this searched gene in stem-like cells from each diseased tissue sample relative to stem-like cells in normal samples in each tissue plotted against the malignancy continuum. Samples are colored based on if they are from different disease stage. |
Top |
Malignant transformation related pathway analysis |
| Find out the enriched GO biological processes and KEGG pathways involved in transition from healthy to precancer to cancer |
| Tissue | Disease Stage | Enriched GO biological Processes |
| Colorectum | AD |  |
| Colorectum | SER |  |
| Colorectum | MSS |  |
| Colorectum | MSI-H |  |
| Colorectum | FAP |  |
| ∗Top 15 enriched GO BP terms are showed in the bar plot of each disease state in each tissue. Each row represents a significant GO biological process which is colored according to the -log10(p.adjust). |
| Page: 1 2 3 4 5 6 7 8 9 |
| GO ID | Tissue | Disease Stage | Description | Gene Ratio | Bg Ratio | pvalue | p.adjust | Count |
| GO:00510908 | Esophagus | ESCC | regulation of DNA-binding transcription factor activity | 252/8552 | 440/18723 | 5.22e-07 | 6.97e-06 | 252 |
| GO:00510918 | Esophagus | ESCC | positive regulation of DNA-binding transcription factor activity | 155/8552 | 260/18723 | 3.83e-06 | 4.14e-05 | 155 |
| GO:00510926 | Esophagus | ESCC | positive regulation of NF-kappaB transcription factor activity | 91/8552 | 152/18723 | 2.91e-04 | 1.75e-03 | 91 |
| GO:00510902 | Liver | HCC | regulation of DNA-binding transcription factor activity | 220/7958 | 440/18723 | 8.04e-04 | 4.82e-03 | 220 |
| GO:00510913 | Liver | HCC | positive regulation of DNA-binding transcription factor activity | 131/7958 | 260/18723 | 5.98e-03 | 2.45e-02 | 131 |
| GO:00510907 | Oral cavity | OSCC | regulation of DNA-binding transcription factor activity | 221/7305 | 440/18723 | 9.06e-07 | 1.23e-05 | 221 |
| GO:00510917 | Oral cavity | OSCC | positive regulation of DNA-binding transcription factor activity | 134/7305 | 260/18723 | 2.52e-05 | 2.35e-04 | 134 |
| GO:00510925 | Oral cavity | OSCC | positive regulation of NF-kappaB transcription factor activity | 82/7305 | 152/18723 | 1.28e-04 | 9.13e-04 | 82 |
| Page: 1 |
| Pathway ID | Tissue | Disease Stage | Description | Gene Ratio | Bg Ratio | pvalue | p.adjust | qvalue | Count |
| Page: 1 |
Top |
Cell-cell communication analysis |
| Identification of potential cell-cell interactions between two cell types and their ligand-receptor pairs for different disease states |
| Ligand | Receptor | LRpair | Pathway | Tissue | Disease Stage |
| Page: 1 |
Top |
Single-cell gene regulatory network inference analysis |
| Find out the significant the regulons (TFs) and the target genes of each regulon across cell types for different disease states |
| TF | Cell Type | Tissue | Disease Stage | Target Gene | RSS | Regulon Activity |
| ∗The dot plots of a searched regulon are shown for all cell subpopulations in each disease state of each tissue based on the regulon specific score inferred using pySCENIC and by calculating the average expression. |
| Page: 1 |
Top |
Somatic mutation of malignant transformation related genes |
| Annotation of somatic variants for genes involved in malignant transformation |
| Hugo Symbol | Variant Class | Variant Classification | dbSNP RS | HGVSc | HGVSp | HGVSp Short | SWISSPROT | BIOTYPE | SIFT | PolyPhen | Tumor Sample Barcode | Tissue | Histology | Sex | Age | Stage | Therapy Types | Drugs | Outcome |
| RNF25 | insertion | Frame_Shift_Ins | novel | c.1273_1274insTAATCCCAGCTACTCAGGAGGCTGAGGCAGGAGAATC | p.Gly425ValfsTer44 | p.G425Vfs*44 | Q96BH1 | protein_coding | TCGA-BH-A0AY-01 | Breast | breast invasive carcinoma | Female | <65 | I/II | Chemotherapy | SD | |||
| RNF25 | insertion | Frame_Shift_Ins | novel | c.1040_1041insCACCTGGGCAGGACTGATCTGGTTTGTAGCTCGAAGGACATGTTCT | p.Trp347CysfsTer33 | p.W347Cfs*33 | Q96BH1 | protein_coding | TCGA-BH-A0B1-01 | Breast | breast invasive carcinoma | Female | >=65 | I/II | Chemotherapy | adriamycin | SD | ||
| RNF25 | SNV | Missense_Mutation | rs761598782 | c.1301G>A | p.Arg434His | p.R434H | Q96BH1 | protein_coding | tolerated(0.13) | benign(0.001) | TCGA-VS-A9UV-01 | Cervix | cervical & endocervical cancer | Female | >=65 | I/II | Unknown | Unknown | PD |
| RNF25 | SNV | Missense_Mutation | c.844A>G | p.Lys282Glu | p.K282E | Q96BH1 | protein_coding | tolerated(1) | benign(0.003) | TCGA-AA-3844-01 | Colorectum | colon adenocarcinoma | Female | >=65 | III/IV | Chemotherapy | capecitabine | PD | |
| RNF25 | SNV | Missense_Mutation | novel | c.590A>G | p.Gln197Arg | p.Q197R | Q96BH1 | protein_coding | deleterious(0.04) | possibly_damaging(0.857) | TCGA-AA-3949-01 | Colorectum | colon adenocarcinoma | Female | >=65 | III/IV | Unknown | Unknown | SD |
| RNF25 | SNV | Missense_Mutation | novel | c.1280N>T | p.Thr427Ile | p.T427I | Q96BH1 | protein_coding | deleterious(0.03) | benign(0.003) | TCGA-AA-3966-01 | Colorectum | colon adenocarcinoma | Female | >=65 | I/II | Unknown | Unknown | SD |
| RNF25 | SNV | Missense_Mutation | rs186960212 | c.1100G>A | p.Arg367His | p.R367H | Q96BH1 | protein_coding | tolerated(0.11) | benign(0.051) | TCGA-CK-5916-01 | Colorectum | colon adenocarcinoma | Female | >=65 | I/II | Unknown | Unknown | PD |
| RNF25 | SNV | Missense_Mutation | c.773G>A | p.Arg258Gln | p.R258Q | Q96BH1 | protein_coding | deleterious(0.01) | possibly_damaging(0.462) | TCGA-DM-A1D0-01 | Colorectum | colon adenocarcinoma | Female | >=65 | I/II | Unknown | Unknown | SD | |
| RNF25 | SNV | Missense_Mutation | rs377322408 | c.991N>A | p.Glu331Lys | p.E331K | Q96BH1 | protein_coding | tolerated(0.17) | benign(0.013) | TCGA-F5-6814-01 | Colorectum | rectum adenocarcinoma | Male | <65 | I/II | Unknown | Unknown | SD |
| RNF25 | deletion | Frame_Shift_Del | c.749delN | p.Gly250GlufsTer29 | p.G250Efs*29 | Q96BH1 | protein_coding | TCGA-AA-3715-01 | Colorectum | colon adenocarcinoma | Male | >=65 | I/II | Unknown | Unknown | PD |
| Page: 1 2 3 4 5 |
Top |
Related drugs of malignant transformation related genes |
| Identification of chemicals and drugs interact with genes involved in malignant transfromation |
| (DGIdb 4.0) |
| Entrez ID | Symbol | Category | Interaction Types | Drug Claim Name | Drug Name | PMIDs |
| Page: 1 |

Copyright 2023-Present -The University of Texas Health Science Center at Houston |