
|
|||||
|
 | |
| |
| |
| |
| |
| |
|
Gene: RLIM |
Gene summary for RLIM |
| Gene information | Species | Human | Gene symbol | RLIM | Gene ID | 51132 |
| Gene name | ring finger protein, LIM domain interacting | |
| Gene Alias | MRX61 | |
| Cytomap | Xq13.2 | |
| Gene Type | protein-coding | GO ID | GO:0000122 | UniProtAcc | Q9NVW2 |
Top |
Malignant transformation analysis |
| Identification of the aberrant gene expression in precancerous and cancerous lesions by comparing the gene expression of stem-like cells in diseased tissues with normal stem cells |
| Entrez ID | Symbol | Replicates | Species | Organ | Tissue | Adj P-value | Log2FC | Malignancy |
| 51132 | RLIM | P19T-E | Human | Esophagus | ESCC | 5.75e-06 | 2.81e-01 | 0.1662 |
| 51132 | RLIM | P20T-E | Human | Esophagus | ESCC | 1.55e-16 | 3.45e-01 | 0.1124 |
| 51132 | RLIM | P21T-E | Human | Esophagus | ESCC | 5.60e-18 | 1.30e-01 | 0.1617 |
| 51132 | RLIM | P22T-E | Human | Esophagus | ESCC | 4.63e-15 | 2.43e-01 | 0.1236 |
| 51132 | RLIM | P23T-E | Human | Esophagus | ESCC | 3.70e-14 | 2.96e-01 | 0.108 |
| 51132 | RLIM | P24T-E | Human | Esophagus | ESCC | 1.53e-11 | 2.22e-01 | 0.1287 |
| 51132 | RLIM | P26T-E | Human | Esophagus | ESCC | 6.83e-31 | 5.01e-01 | 0.1276 |
| 51132 | RLIM | P27T-E | Human | Esophagus | ESCC | 4.82e-18 | 4.57e-01 | 0.1055 |
| 51132 | RLIM | P28T-E | Human | Esophagus | ESCC | 5.66e-15 | 3.21e-01 | 0.1149 |
| 51132 | RLIM | P30T-E | Human | Esophagus | ESCC | 9.99e-15 | 4.37e-01 | 0.137 |
| 51132 | RLIM | P31T-E | Human | Esophagus | ESCC | 5.20e-19 | 3.63e-01 | 0.1251 |
| 51132 | RLIM | P32T-E | Human | Esophagus | ESCC | 5.27e-09 | 2.28e-01 | 0.1666 |
| 51132 | RLIM | P36T-E | Human | Esophagus | ESCC | 8.48e-20 | 6.62e-01 | 0.1187 |
| 51132 | RLIM | P37T-E | Human | Esophagus | ESCC | 1.33e-15 | 2.67e-01 | 0.1371 |
| 51132 | RLIM | P39T-E | Human | Esophagus | ESCC | 5.38e-14 | 1.63e-01 | 0.0894 |
| 51132 | RLIM | P40T-E | Human | Esophagus | ESCC | 9.24e-08 | 2.62e-01 | 0.109 |
| 51132 | RLIM | P42T-E | Human | Esophagus | ESCC | 2.43e-21 | 4.72e-01 | 0.1175 |
| 51132 | RLIM | P44T-E | Human | Esophagus | ESCC | 1.78e-11 | 1.27e-01 | 0.1096 |
| 51132 | RLIM | P47T-E | Human | Esophagus | ESCC | 2.44e-11 | 3.16e-01 | 0.1067 |
| 51132 | RLIM | P48T-E | Human | Esophagus | ESCC | 2.43e-15 | 1.79e-01 | 0.0959 |
| Page: 1 2 3 4 |
| Tissue | Expression Dynamics | Abbreviation |
| Esophagus | 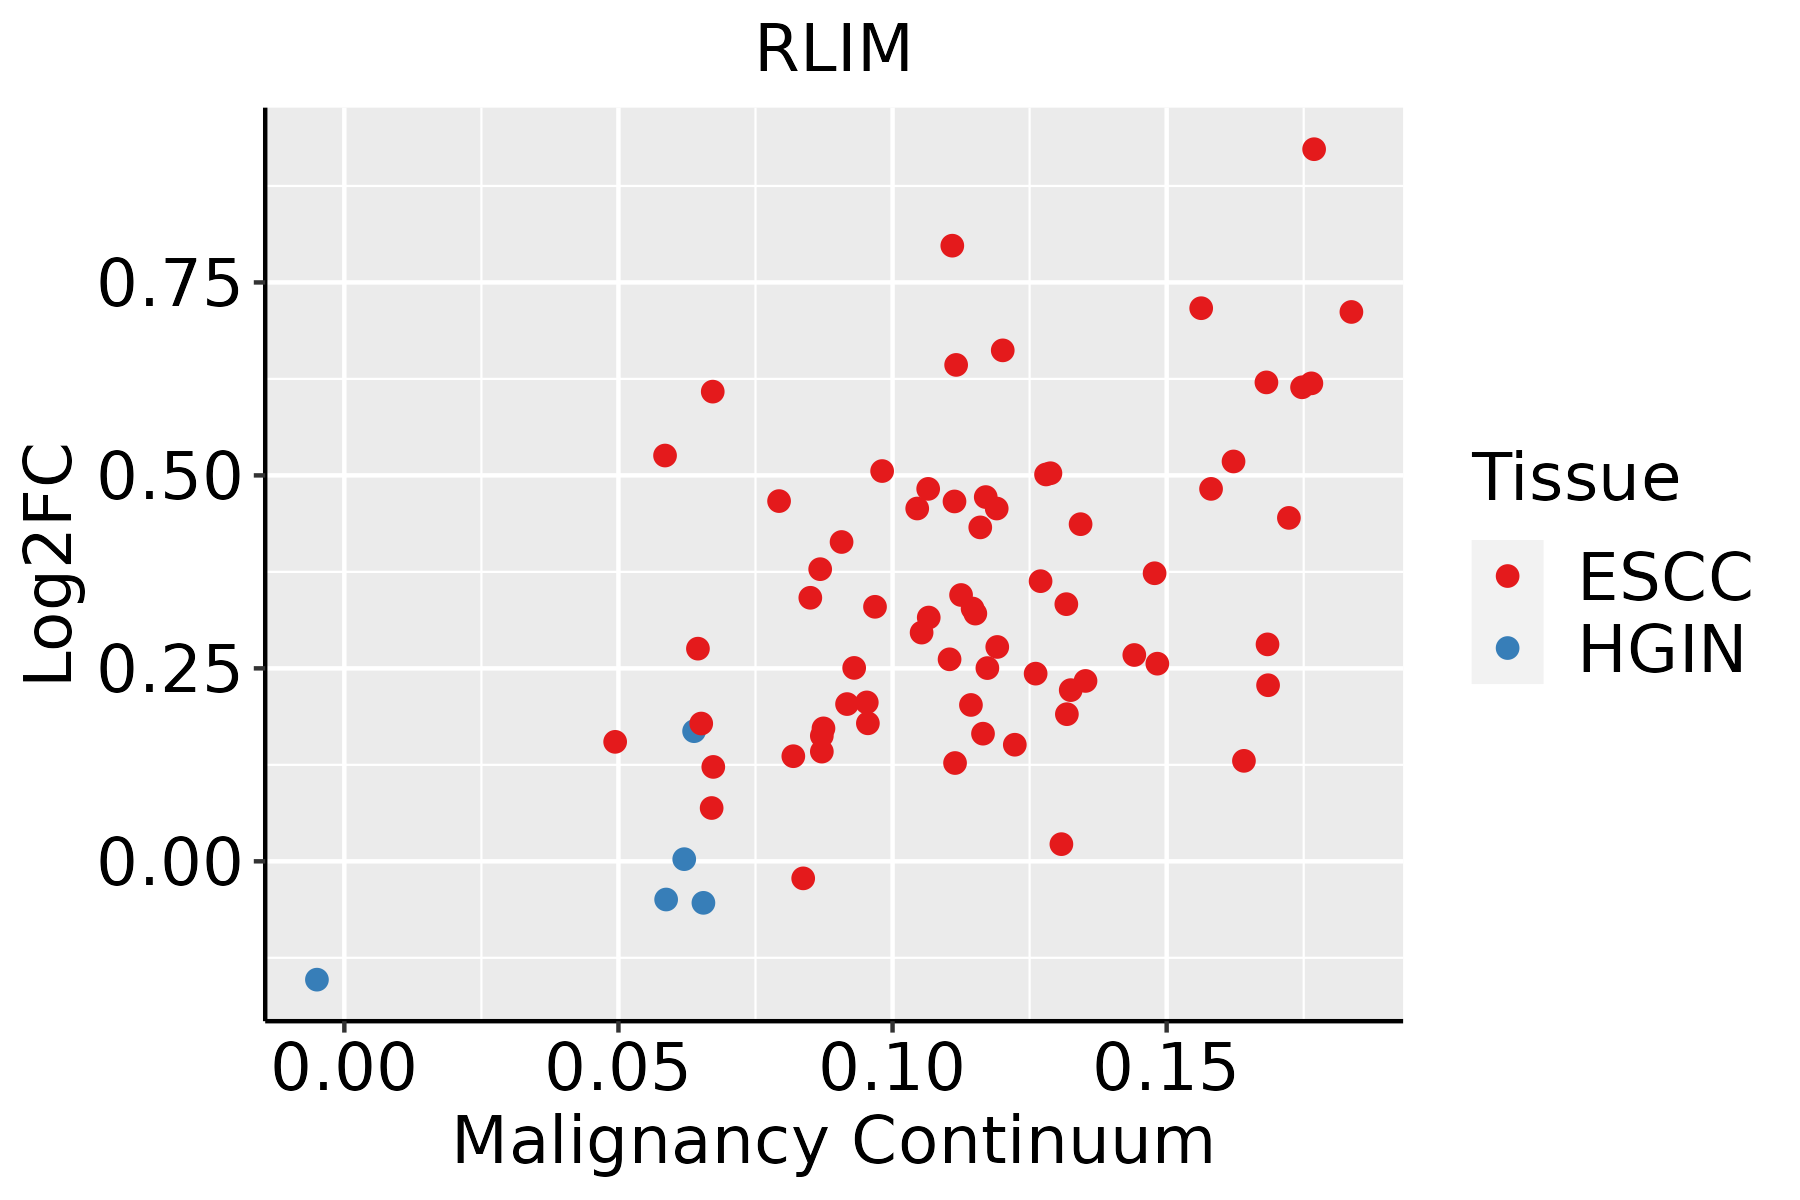 | ESCC: Esophageal squamous cell carcinoma |
| HGIN: High-grade intraepithelial neoplasias | ||
| LGIN: Low-grade intraepithelial neoplasias | ||
| Liver | 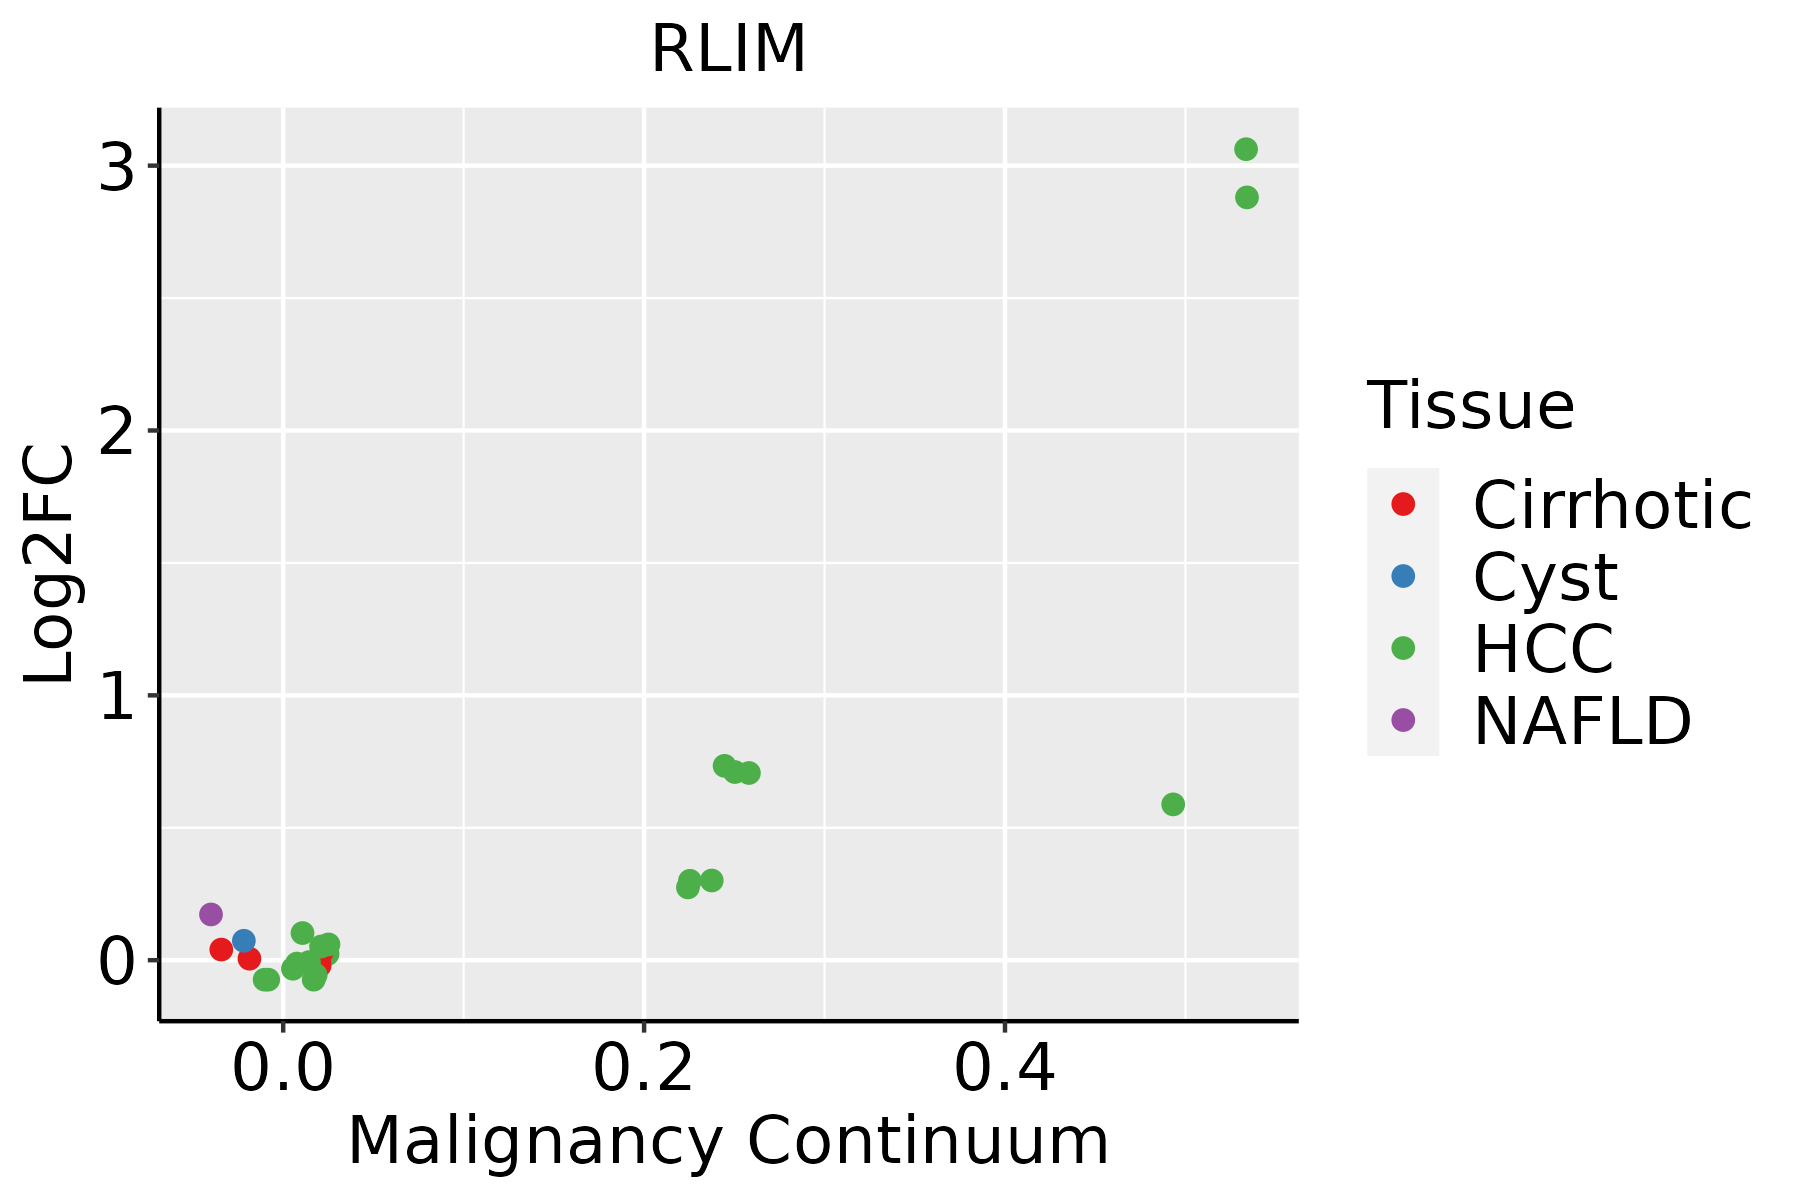 | HCC: Hepatocellular carcinoma |
| NAFLD: Non-alcoholic fatty liver disease |
| ∗log2FC in expression of this searched gene in stem-like cells from each diseased tissue sample relative to stem-like cells in normal samples in each tissue plotted against the malignancy continuum. Samples are colored based on if they are from different disease stage. |
Top |
Malignant transformation related pathway analysis |
| Find out the enriched GO biological processes and KEGG pathways involved in transition from healthy to precancer to cancer |
| Tissue | Disease Stage | Enriched GO biological Processes |
| Colorectum | AD |  |
| Colorectum | SER |  |
| Colorectum | MSS |  |
| Colorectum | MSI-H |  |
| Colorectum | FAP |  |
| ∗Top 15 enriched GO BP terms are showed in the bar plot of each disease state in each tissue. Each row represents a significant GO biological process which is colored according to the -log10(p.adjust). |
| Page: 1 2 3 4 5 6 7 8 9 |
| GO ID | Tissue | Disease Stage | Description | Gene Ratio | Bg Ratio | pvalue | p.adjust | Count |
| GO:00400295 | Esophagus | ESCC | regulation of gene expression, epigenetic | 74/8552 | 105/18723 | 2.24e-07 | 3.42e-06 | 74 |
| GO:00510908 | Esophagus | ESCC | regulation of DNA-binding transcription factor activity | 252/8552 | 440/18723 | 5.22e-07 | 6.97e-06 | 252 |
| GO:00090484 | Esophagus | ESCC | dosage compensation by inactivation of X chromosome | 14/8552 | 16/18723 | 6.78e-04 | 3.56e-03 | 14 |
| GO:00434332 | Esophagus | ESCC | negative regulation of DNA-binding transcription factor activity | 103/8552 | 185/18723 | 3.86e-03 | 1.57e-02 | 103 |
| GO:00075494 | Esophagus | ESCC | dosage compensation | 14/8552 | 18/18723 | 5.77e-03 | 2.14e-02 | 14 |
| GO:00510902 | Liver | HCC | regulation of DNA-binding transcription factor activity | 220/7958 | 440/18723 | 8.04e-04 | 4.82e-03 | 220 |
| GO:0040029 | Liver | HCC | regulation of gene expression, epigenetic | 61/7958 | 105/18723 | 9.02e-04 | 5.31e-03 | 61 |
| GO:0009048 | Liver | HCC | dosage compensation by inactivation of X chromosome | 13/7958 | 16/18723 | 1.84e-03 | 9.42e-03 | 13 |
| GO:0007549 | Liver | HCC | dosage compensation | 13/7958 | 18/18723 | 1.05e-02 | 3.89e-02 | 13 |
| Page: 1 |
| Pathway ID | Tissue | Disease Stage | Description | Gene Ratio | Bg Ratio | pvalue | p.adjust | qvalue | Count |
| Page: 1 |
Top |
Cell-cell communication analysis |
| Identification of potential cell-cell interactions between two cell types and their ligand-receptor pairs for different disease states |
| Ligand | Receptor | LRpair | Pathway | Tissue | Disease Stage |
| Page: 1 |
Top |
Single-cell gene regulatory network inference analysis |
| Find out the significant the regulons (TFs) and the target genes of each regulon across cell types for different disease states |
| TF | Cell Type | Tissue | Disease Stage | Target Gene | RSS | Regulon Activity |
| ∗The dot plots of a searched regulon are shown for all cell subpopulations in each disease state of each tissue based on the regulon specific score inferred using pySCENIC and by calculating the average expression. |
| Page: 1 |
Top |
Somatic mutation of malignant transformation related genes |
| Annotation of somatic variants for genes involved in malignant transformation |
| Hugo Symbol | Variant Class | Variant Classification | dbSNP RS | HGVSc | HGVSp | HGVSp Short | SWISSPROT | BIOTYPE | SIFT | PolyPhen | Tumor Sample Barcode | Tissue | Histology | Sex | Age | Stage | Therapy Types | Drugs | Outcome |
| RLIM | SNV | Missense_Mutation | c.796N>T | p.Arg266Trp | p.R266W | Q9NVW2 | protein_coding | deleterious(0.04) | probably_damaging(0.981) | TCGA-D8-A1XK-01 | Breast | breast invasive carcinoma | Female | <65 | I/II | Chemotherapy | doxorubicine+cyclophosphamide | SD | |
| RLIM | insertion | Frame_Shift_Ins | novel | c.674_675insCGGAGAACCAGAGCAAGAGC | p.Glu226GlyfsTer17 | p.E226Gfs*17 | Q9NVW2 | protein_coding | TCGA-BH-A1F5-01 | Breast | breast invasive carcinoma | Female | <65 | I/II | Unknown | Unknown | SD | ||
| RLIM | SNV | Missense_Mutation | c.776C>T | p.Thr259Met | p.T259M | Q9NVW2 | protein_coding | tolerated(0.09) | benign(0.003) | TCGA-A6-2681-01 | Colorectum | colon adenocarcinoma | Female | >=65 | I/II | Unknown | Unknown | PD | |
| RLIM | SNV | Missense_Mutation | c.1094N>A | p.Arg365His | p.R365H | Q9NVW2 | protein_coding | tolerated(0.64) | probably_damaging(0.996) | TCGA-A6-6651-01 | Colorectum | colon adenocarcinoma | Female | <65 | III/IV | Ancillary | leucovorin | SD | |
| RLIM | SNV | Missense_Mutation | c.1160N>A | p.Arg387His | p.R387H | Q9NVW2 | protein_coding | tolerated(0.89) | probably_damaging(0.996) | TCGA-AA-3678-01 | Colorectum | colon adenocarcinoma | Female | <65 | III/IV | Chemotherapy | folinic | CR | |
| RLIM | SNV | Missense_Mutation | c.1000N>T | p.Arg334Trp | p.R334W | Q9NVW2 | protein_coding | tolerated(0.07) | probably_damaging(0.998) | TCGA-AA-3947-01 | Colorectum | colon adenocarcinoma | Female | <65 | I/II | Unknown | Unknown | SD | |
| RLIM | SNV | Missense_Mutation | c.1306N>G | p.Asn436Asp | p.N436D | Q9NVW2 | protein_coding | tolerated(0.08) | benign(0.054) | TCGA-AA-A00O-01 | Colorectum | colon adenocarcinoma | Female | >=65 | III/IV | Unknown | Unknown | SD | |
| RLIM | SNV | Missense_Mutation | novel | c.200N>A | p.Arg67Gln | p.R67Q | Q9NVW2 | protein_coding | deleterious(0) | probably_damaging(0.992) | TCGA-G4-6304-01 | Colorectum | colon adenocarcinoma | Female | >=65 | I/II | Chemotherapy | fluorouracil | PD |
| RLIM | SNV | Missense_Mutation | novel | c.1819T>C | p.Cys607Arg | p.C607R | Q9NVW2 | protein_coding | deleterious(0) | probably_damaging(1) | TCGA-A5-A0G1-01 | Endometrium | uterine corpus endometrioid carcinoma | Female | >=65 | I/II | Unknown | Unknown | SD |
| RLIM | SNV | Missense_Mutation | novel | c.1327N>T | p.Arg443Trp | p.R443W | Q9NVW2 | protein_coding | deleterious(0.01) | benign(0.249) | TCGA-A5-A0G2-01 | Endometrium | uterine corpus endometrioid carcinoma | Female | <65 | III/IV | Unknown | Unknown | SD |
| Page: 1 2 3 4 5 6 7 8 |
Top |
Related drugs of malignant transformation related genes |
| Identification of chemicals and drugs interact with genes involved in malignant transfromation |
| (DGIdb 4.0) |
| Entrez ID | Symbol | Category | Interaction Types | Drug Claim Name | Drug Name | PMIDs |
| Page: 1 |

Copyright 2023-Present -The University of Texas Health Science Center at Houston |