
|
|||||
|
 | |
| |
| |
| |
| |
| |
|
Gene: RHOF |
Gene summary for RHOF |
| Gene information | Species | Human | Gene symbol | RHOF | Gene ID | 54509 |
| Gene name | ras homolog family member F, filopodia associated | |
| Gene Alias | ARHF | |
| Cytomap | 12q24.31 | |
| Gene Type | protein-coding | GO ID | GO:0000902 | UniProtAcc | Q9HBH0 |
Top |
Malignant transformation analysis |
| Identification of the aberrant gene expression in precancerous and cancerous lesions by comparing the gene expression of stem-like cells in diseased tissues with normal stem cells |
| Entrez ID | Symbol | Replicates | Species | Organ | Tissue | Adj P-value | Log2FC | Malignancy |
| 54509 | RHOF | P22T-E | Human | Esophagus | ESCC | 2.16e-06 | 1.11e-01 | 0.1236 |
| 54509 | RHOF | P23T-E | Human | Esophagus | ESCC | 1.99e-08 | 2.19e-01 | 0.108 |
| 54509 | RHOF | P24T-E | Human | Esophagus | ESCC | 1.85e-02 | 1.64e-01 | 0.1287 |
| 54509 | RHOF | P26T-E | Human | Esophagus | ESCC | 2.94e-02 | 1.32e-01 | 0.1276 |
| 54509 | RHOF | P27T-E | Human | Esophagus | ESCC | 1.31e-03 | 1.29e-01 | 0.1055 |
| 54509 | RHOF | P28T-E | Human | Esophagus | ESCC | 4.81e-17 | 4.02e-01 | 0.1149 |
| 54509 | RHOF | P30T-E | Human | Esophagus | ESCC | 4.84e-02 | 1.52e-01 | 0.137 |
| 54509 | RHOF | P31T-E | Human | Esophagus | ESCC | 2.19e-12 | 3.45e-01 | 0.1251 |
| 54509 | RHOF | P32T-E | Human | Esophagus | ESCC | 9.02e-05 | 1.45e-01 | 0.1666 |
| 54509 | RHOF | P36T-E | Human | Esophagus | ESCC | 7.27e-21 | 5.95e-01 | 0.1187 |
| 54509 | RHOF | P37T-E | Human | Esophagus | ESCC | 4.78e-22 | 5.09e-01 | 0.1371 |
| 54509 | RHOF | P38T-E | Human | Esophagus | ESCC | 3.86e-14 | 5.70e-01 | 0.127 |
| 54509 | RHOF | P39T-E | Human | Esophagus | ESCC | 3.11e-02 | 7.48e-02 | 0.0894 |
| 54509 | RHOF | P40T-E | Human | Esophagus | ESCC | 1.70e-03 | 1.43e-01 | 0.109 |
| 54509 | RHOF | P42T-E | Human | Esophagus | ESCC | 3.60e-12 | 3.49e-01 | 0.1175 |
| 54509 | RHOF | P47T-E | Human | Esophagus | ESCC | 1.91e-08 | 2.87e-01 | 0.1067 |
| 54509 | RHOF | P48T-E | Human | Esophagus | ESCC | 9.32e-05 | 1.34e-01 | 0.0959 |
| 54509 | RHOF | P49T-E | Human | Esophagus | ESCC | 1.65e-10 | 7.82e-01 | 0.1768 |
| 54509 | RHOF | P52T-E | Human | Esophagus | ESCC | 3.42e-05 | 1.44e-01 | 0.1555 |
| 54509 | RHOF | P54T-E | Human | Esophagus | ESCC | 4.63e-10 | 2.66e-01 | 0.0975 |
| Page: 1 2 3 4 5 |
| Tissue | Expression Dynamics | Abbreviation |
| Esophagus |  | ESCC: Esophageal squamous cell carcinoma |
| HGIN: High-grade intraepithelial neoplasias | ||
| LGIN: Low-grade intraepithelial neoplasias | ||
| Liver | 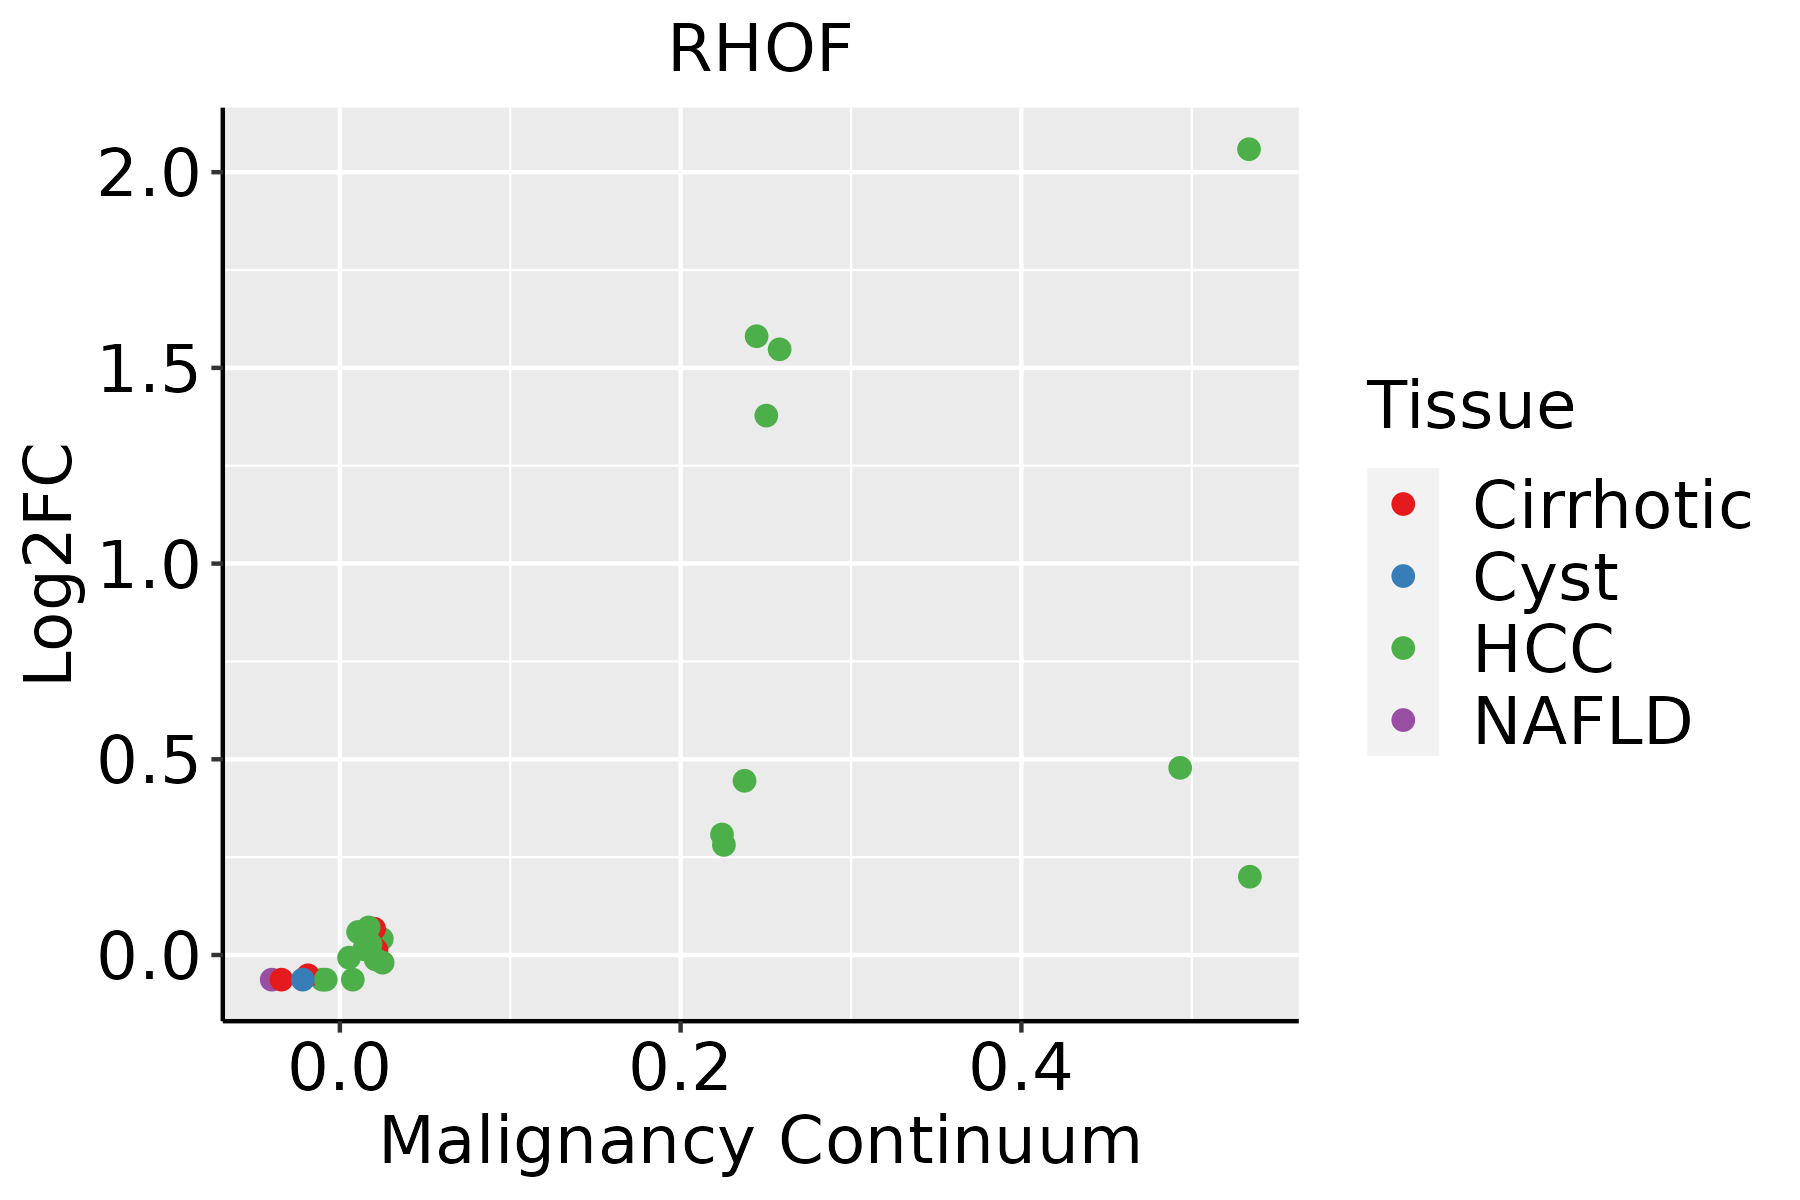 | HCC: Hepatocellular carcinoma |
| NAFLD: Non-alcoholic fatty liver disease | ||
| Oral Cavity |  | EOLP: Erosive Oral lichen planus |
| LP: leukoplakia | ||
| NEOLP: Non-erosive oral lichen planus | ||
| OSCC: Oral squamous cell carcinoma | ||
| Thyroid |  | ATC: Anaplastic thyroid cancer |
| HT: Hashimoto's thyroiditis | ||
| PTC: Papillary thyroid cancer |
| ∗log2FC in expression of this searched gene in stem-like cells from each diseased tissue sample relative to stem-like cells in normal samples in each tissue plotted against the malignancy continuum. Samples are colored based on if they are from different disease stage. |
Top |
Malignant transformation related pathway analysis |
| Find out the enriched GO biological processes and KEGG pathways involved in transition from healthy to precancer to cancer |
| Tissue | Disease Stage | Enriched GO biological Processes |
| Colorectum | AD |  |
| Colorectum | SER |  |
| Colorectum | MSS |  |
| Colorectum | MSI-H |  |
| Colorectum | FAP |  |
| ∗Top 15 enriched GO BP terms are showed in the bar plot of each disease state in each tissue. Each row represents a significant GO biological process which is colored according to the -log10(p.adjust). |
| Page: 1 2 3 4 5 6 7 8 9 |
| GO ID | Tissue | Disease Stage | Description | Gene Ratio | Bg Ratio | pvalue | p.adjust | Count |
| GO:000716320 | Esophagus | ESCC | establishment or maintenance of cell polarity | 143/8552 | 218/18723 | 2.05e-09 | 4.65e-08 | 143 |
| GO:000701527 | Esophagus | ESCC | actin filament organization | 259/8552 | 442/18723 | 2.37e-08 | 4.50e-07 | 259 |
| GO:0032970111 | Esophagus | ESCC | regulation of actin filament-based process | 231/8552 | 397/18723 | 2.91e-07 | 4.20e-06 | 231 |
| GO:0032956111 | Esophagus | ESCC | regulation of actin cytoskeleton organization | 210/8552 | 358/18723 | 4.40e-07 | 6.00e-06 | 210 |
| GO:002260420 | Esophagus | ESCC | regulation of cell morphogenesis | 180/8552 | 309/18723 | 5.19e-06 | 5.45e-05 | 180 |
| GO:003086517 | Esophagus | ESCC | cortical cytoskeleton organization | 44/8552 | 61/18723 | 2.50e-05 | 2.13e-04 | 44 |
| GO:000836018 | Esophagus | ESCC | regulation of cell shape | 92/8552 | 154/18723 | 3.00e-04 | 1.81e-03 | 92 |
| GO:005105610 | Esophagus | ESCC | regulation of small GTPase mediated signal transduction | 157/8552 | 302/18723 | 1.55e-02 | 4.98e-02 | 157 |
| GO:002260422 | Liver | HCC | regulation of cell morphogenesis | 188/7958 | 309/18723 | 4.84e-11 | 1.82e-09 | 188 |
| GO:000701522 | Liver | HCC | actin filament organization | 252/7958 | 442/18723 | 3.83e-10 | 1.25e-08 | 252 |
| GO:000716322 | Liver | HCC | establishment or maintenance of cell polarity | 133/7958 | 218/18723 | 2.48e-08 | 5.73e-07 | 133 |
| GO:003297022 | Liver | HCC | regulation of actin filament-based process | 222/7958 | 397/18723 | 3.81e-08 | 8.30e-07 | 222 |
| GO:003086512 | Liver | HCC | cortical cytoskeleton organization | 47/7958 | 61/18723 | 4.03e-08 | 8.69e-07 | 47 |
| GO:003295622 | Liver | HCC | regulation of actin cytoskeleton organization | 202/7958 | 358/18723 | 6.18e-08 | 1.29e-06 | 202 |
| GO:000836022 | Liver | HCC | regulation of cell shape | 92/7958 | 154/18723 | 1.15e-05 | 1.31e-04 | 92 |
| GO:000716318 | Oral cavity | OSCC | establishment or maintenance of cell polarity | 129/7305 | 218/18723 | 1.16e-09 | 2.86e-08 | 129 |
| GO:000701520 | Oral cavity | OSCC | actin filament organization | 230/7305 | 442/18723 | 1.37e-08 | 2.77e-07 | 230 |
| GO:003297020 | Oral cavity | OSCC | regulation of actin filament-based process | 209/7305 | 397/18723 | 1.89e-08 | 3.72e-07 | 209 |
| GO:003295620 | Oral cavity | OSCC | regulation of actin cytoskeleton organization | 189/7305 | 358/18723 | 6.81e-08 | 1.21e-06 | 189 |
| GO:002260419 | Oral cavity | OSCC | regulation of cell morphogenesis | 163/7305 | 309/18723 | 5.66e-07 | 8.19e-06 | 163 |
| Page: 1 2 3 |
| Pathway ID | Tissue | Disease Stage | Description | Gene Ratio | Bg Ratio | pvalue | p.adjust | qvalue | Count |
| Page: 1 |
Top |
Cell-cell communication analysis |
| Identification of potential cell-cell interactions between two cell types and their ligand-receptor pairs for different disease states |
| Ligand | Receptor | LRpair | Pathway | Tissue | Disease Stage |
| Page: 1 |
Top |
Single-cell gene regulatory network inference analysis |
| Find out the significant the regulons (TFs) and the target genes of each regulon across cell types for different disease states |
| TF | Cell Type | Tissue | Disease Stage | Target Gene | RSS | Regulon Activity |
| ∗The dot plots of a searched regulon are shown for all cell subpopulations in each disease state of each tissue based on the regulon specific score inferred using pySCENIC and by calculating the average expression. |
| Page: 1 |
Top |
Somatic mutation of malignant transformation related genes |
| Annotation of somatic variants for genes involved in malignant transformation |
| Hugo Symbol | Variant Class | Variant Classification | dbSNP RS | HGVSc | HGVSp | HGVSp Short | SWISSPROT | BIOTYPE | SIFT | PolyPhen | Tumor Sample Barcode | Tissue | Histology | Sex | Age | Stage | Therapy Types | Drugs | Outcome |
| RHOF | SNV | Missense_Mutation | c.495N>G | p.Ile165Met | p.I165M | Q9HBH0 | protein_coding | tolerated(0.26) | benign(0.013) | TCGA-D8-A1JG-01 | Breast | breast invasive carcinoma | Female | <65 | I/II | Chemotherapy | doxorubicin | SD | |
| RHOF | insertion | Frame_Shift_Ins | novel | c.227-1_227insAAACT | p.Gly76GlufsTer28 | p.G76Efs*28 | Q9HBH0 | protein_coding | TCGA-BH-A0E0-01 | Breast | breast invasive carcinoma | Female | <65 | III/IV | Chemotherapy | docetaxel | SD | ||
| RHOF | SNV | Missense_Mutation | rs746745426 | c.251N>A | p.Arg84Gln | p.R84Q | Q9HBH0 | protein_coding | deleterious(0) | probably_damaging(1) | TCGA-EI-6507-01 | Colorectum | rectum adenocarcinoma | Male | <65 | I/II | Unknown | Unknown | SD |
| RHOF | SNV | Missense_Mutation | novel | c.455C>T | p.Pro152Leu | p.P152L | Q9HBH0 | protein_coding | deleterious(0) | probably_damaging(0.993) | TCGA-PG-A915-01 | Endometrium | uterine corpus endometrioid carcinoma | Female | <65 | I/II | Unknown | Unknown | SD |
| RHOF | SNV | Missense_Mutation | rs765693209 | c.556N>T | p.Arg186Trp | p.R186W | Q9HBH0 | protein_coding | deleterious(0) | probably_damaging(0.986) | TCGA-BR-6452-01 | Stomach | stomach adenocarcinoma | Female | >=65 | I/II | Unknown | Unknown | SD |
| RHOF | SNV | Missense_Mutation | rs551990941 | c.523G>A | p.Ala175Thr | p.A175T | Q9HBH0 | protein_coding | deleterious(0) | probably_damaging(0.999) | TCGA-BR-8372-01 | Stomach | stomach adenocarcinoma | Male | <65 | III/IV | Chemotherapy | etoposide | CR |
| RHOF | SNV | Missense_Mutation | rs551990941 | c.523N>A | p.Ala175Thr | p.A175T | Q9HBH0 | protein_coding | deleterious(0) | probably_damaging(0.999) | TCGA-BR-8487-01 | Stomach | stomach adenocarcinoma | Female | <65 | I/II | Unknown | Unknown | SD |
| RHOF | SNV | Missense_Mutation | c.295N>A | p.Asp99Asn | p.D99N | Q9HBH0 | protein_coding | deleterious(0.01) | probably_damaging(0.999) | TCGA-CG-4442-01 | Stomach | stomach adenocarcinoma | Male | >=65 | I/II | Unknown | Unknown | SD |
| Page: 1 |
Top |
Related drugs of malignant transformation related genes |
| Identification of chemicals and drugs interact with genes involved in malignant transfromation |
| (DGIdb 4.0) |
| Entrez ID | Symbol | Category | Interaction Types | Drug Claim Name | Drug Name | PMIDs |
| Page: 1 |

Copyright 2023-Present -The University of Texas Health Science Center at Houston |