
|
|||||
|
 | |
| |
| |
| |
| |
| |
|
Gene: RFX5 |
Gene summary for RFX5 |
| Gene information | Species | Human | Gene symbol | RFX5 | Gene ID | 5993 |
| Gene name | regulatory factor X5 | |
| Gene Alias | RFX5 | |
| Cytomap | 1q21.3 | |
| Gene Type | protein-coding | GO ID | GO:0000122 | UniProtAcc | P48382 |
Top |
Malignant transformation analysis |
| Identification of the aberrant gene expression in precancerous and cancerous lesions by comparing the gene expression of stem-like cells in diseased tissues with normal stem cells |
| Entrez ID | Symbol | Replicates | Species | Organ | Tissue | Adj P-value | Log2FC | Malignancy |
| 5993 | RFX5 | P23T-E | Human | Esophagus | ESCC | 9.43e-19 | 5.12e-01 | 0.108 |
| 5993 | RFX5 | P24T-E | Human | Esophagus | ESCC | 1.64e-18 | 4.90e-01 | 0.1287 |
| 5993 | RFX5 | P26T-E | Human | Esophagus | ESCC | 1.16e-13 | 2.52e-01 | 0.1276 |
| 5993 | RFX5 | P27T-E | Human | Esophagus | ESCC | 2.25e-11 | 3.01e-01 | 0.1055 |
| 5993 | RFX5 | P28T-E | Human | Esophagus | ESCC | 1.87e-05 | 1.41e-01 | 0.1149 |
| 5993 | RFX5 | P30T-E | Human | Esophagus | ESCC | 1.00e-11 | 4.62e-01 | 0.137 |
| 5993 | RFX5 | P31T-E | Human | Esophagus | ESCC | 4.95e-18 | 2.17e-01 | 0.1251 |
| 5993 | RFX5 | P32T-E | Human | Esophagus | ESCC | 3.27e-11 | 1.75e-01 | 0.1666 |
| 5993 | RFX5 | P36T-E | Human | Esophagus | ESCC | 1.03e-15 | 5.57e-01 | 0.1187 |
| 5993 | RFX5 | P37T-E | Human | Esophagus | ESCC | 1.88e-11 | 2.27e-01 | 0.1371 |
| 5993 | RFX5 | P39T-E | Human | Esophagus | ESCC | 2.00e-09 | 6.56e-02 | 0.0894 |
| 5993 | RFX5 | P40T-E | Human | Esophagus | ESCC | 3.87e-09 | 2.69e-01 | 0.109 |
| 5993 | RFX5 | P42T-E | Human | Esophagus | ESCC | 4.10e-10 | 3.04e-01 | 0.1175 |
| 5993 | RFX5 | P47T-E | Human | Esophagus | ESCC | 8.46e-10 | 1.63e-01 | 0.1067 |
| 5993 | RFX5 | P48T-E | Human | Esophagus | ESCC | 3.87e-10 | 2.05e-01 | 0.0959 |
| 5993 | RFX5 | P49T-E | Human | Esophagus | ESCC | 1.29e-09 | 9.63e-01 | 0.1768 |
| 5993 | RFX5 | P52T-E | Human | Esophagus | ESCC | 1.31e-19 | 4.18e-01 | 0.1555 |
| 5993 | RFX5 | P54T-E | Human | Esophagus | ESCC | 3.04e-14 | 3.41e-01 | 0.0975 |
| 5993 | RFX5 | P56T-E | Human | Esophagus | ESCC | 9.83e-03 | 4.91e-01 | 0.1613 |
| 5993 | RFX5 | P57T-E | Human | Esophagus | ESCC | 2.31e-08 | 1.43e-01 | 0.0926 |
| Page: 1 2 3 4 |
| Tissue | Expression Dynamics | Abbreviation |
| Esophagus | 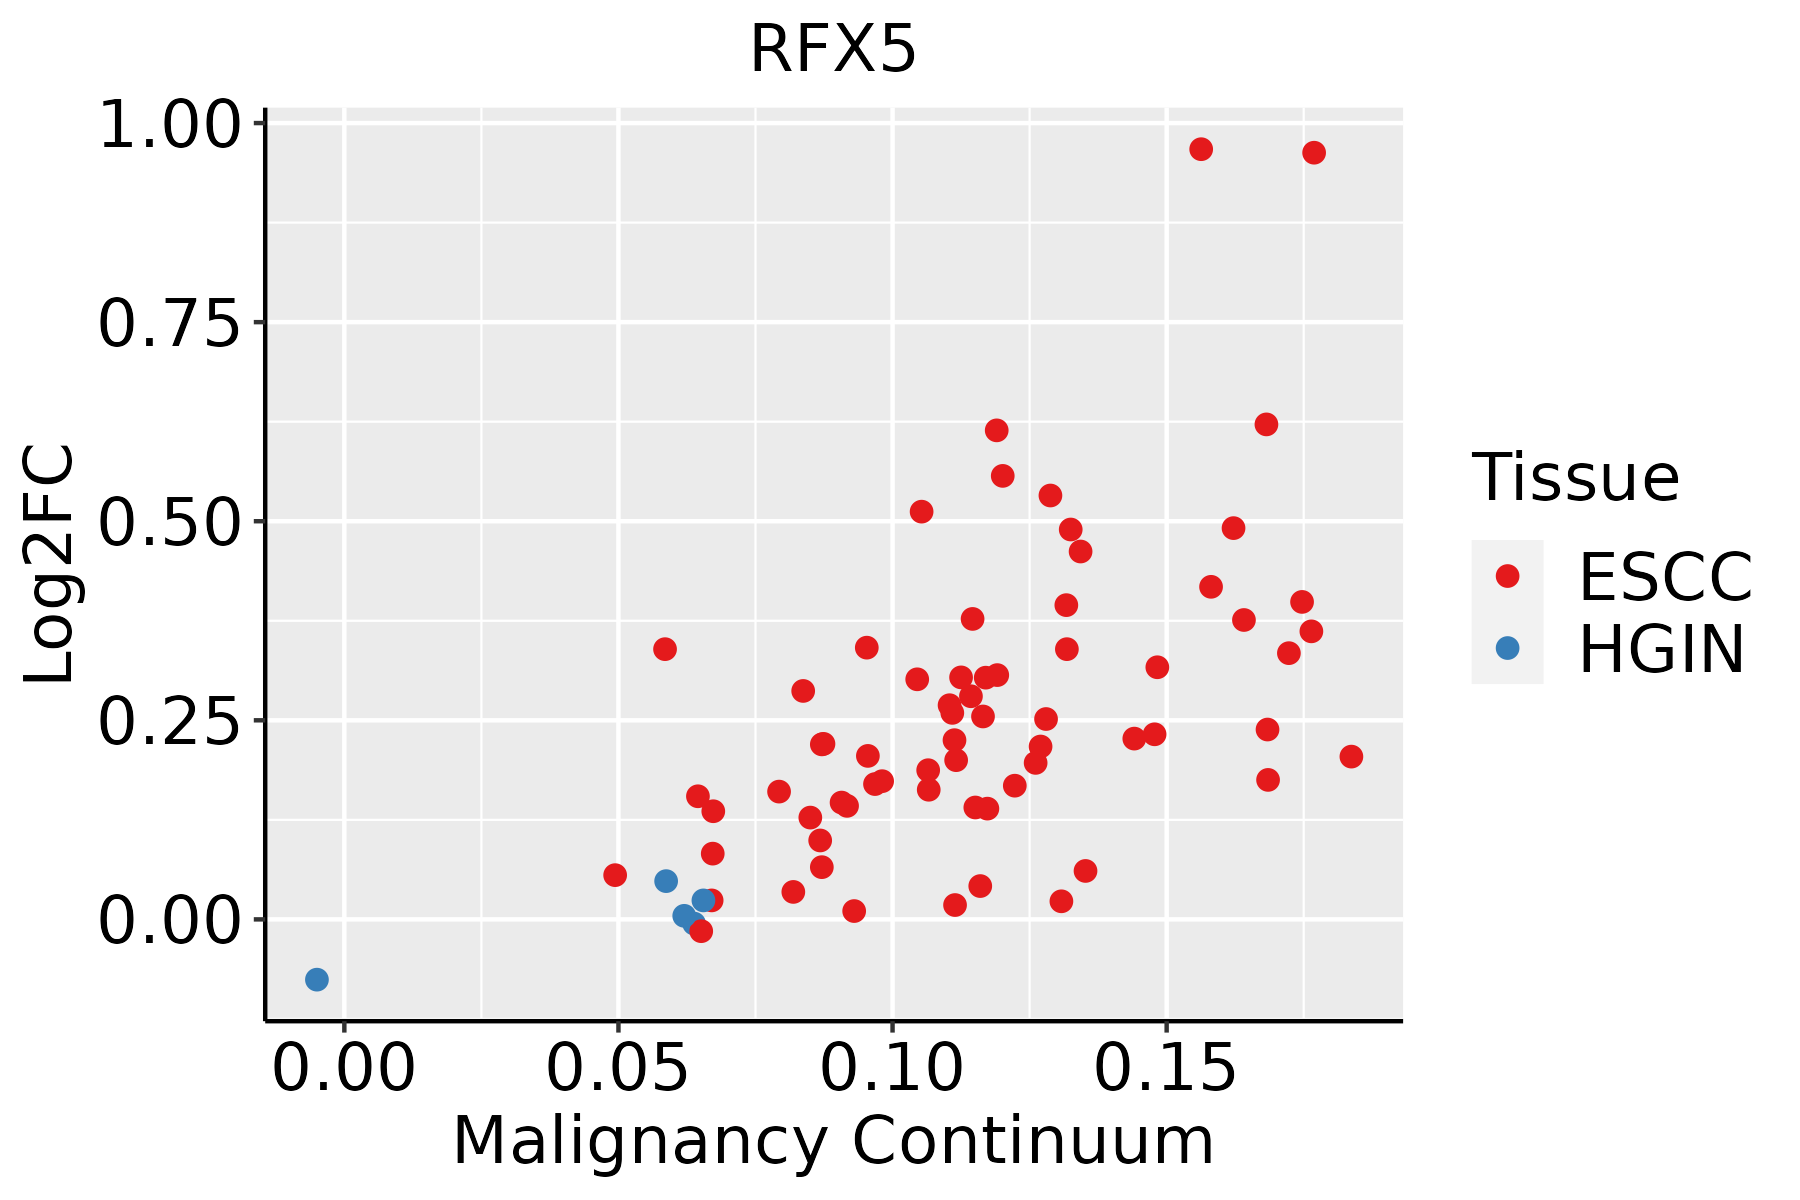 | ESCC: Esophageal squamous cell carcinoma |
| HGIN: High-grade intraepithelial neoplasias | ||
| LGIN: Low-grade intraepithelial neoplasias | ||
| Liver |  | HCC: Hepatocellular carcinoma |
| NAFLD: Non-alcoholic fatty liver disease | ||
| Oral Cavity | 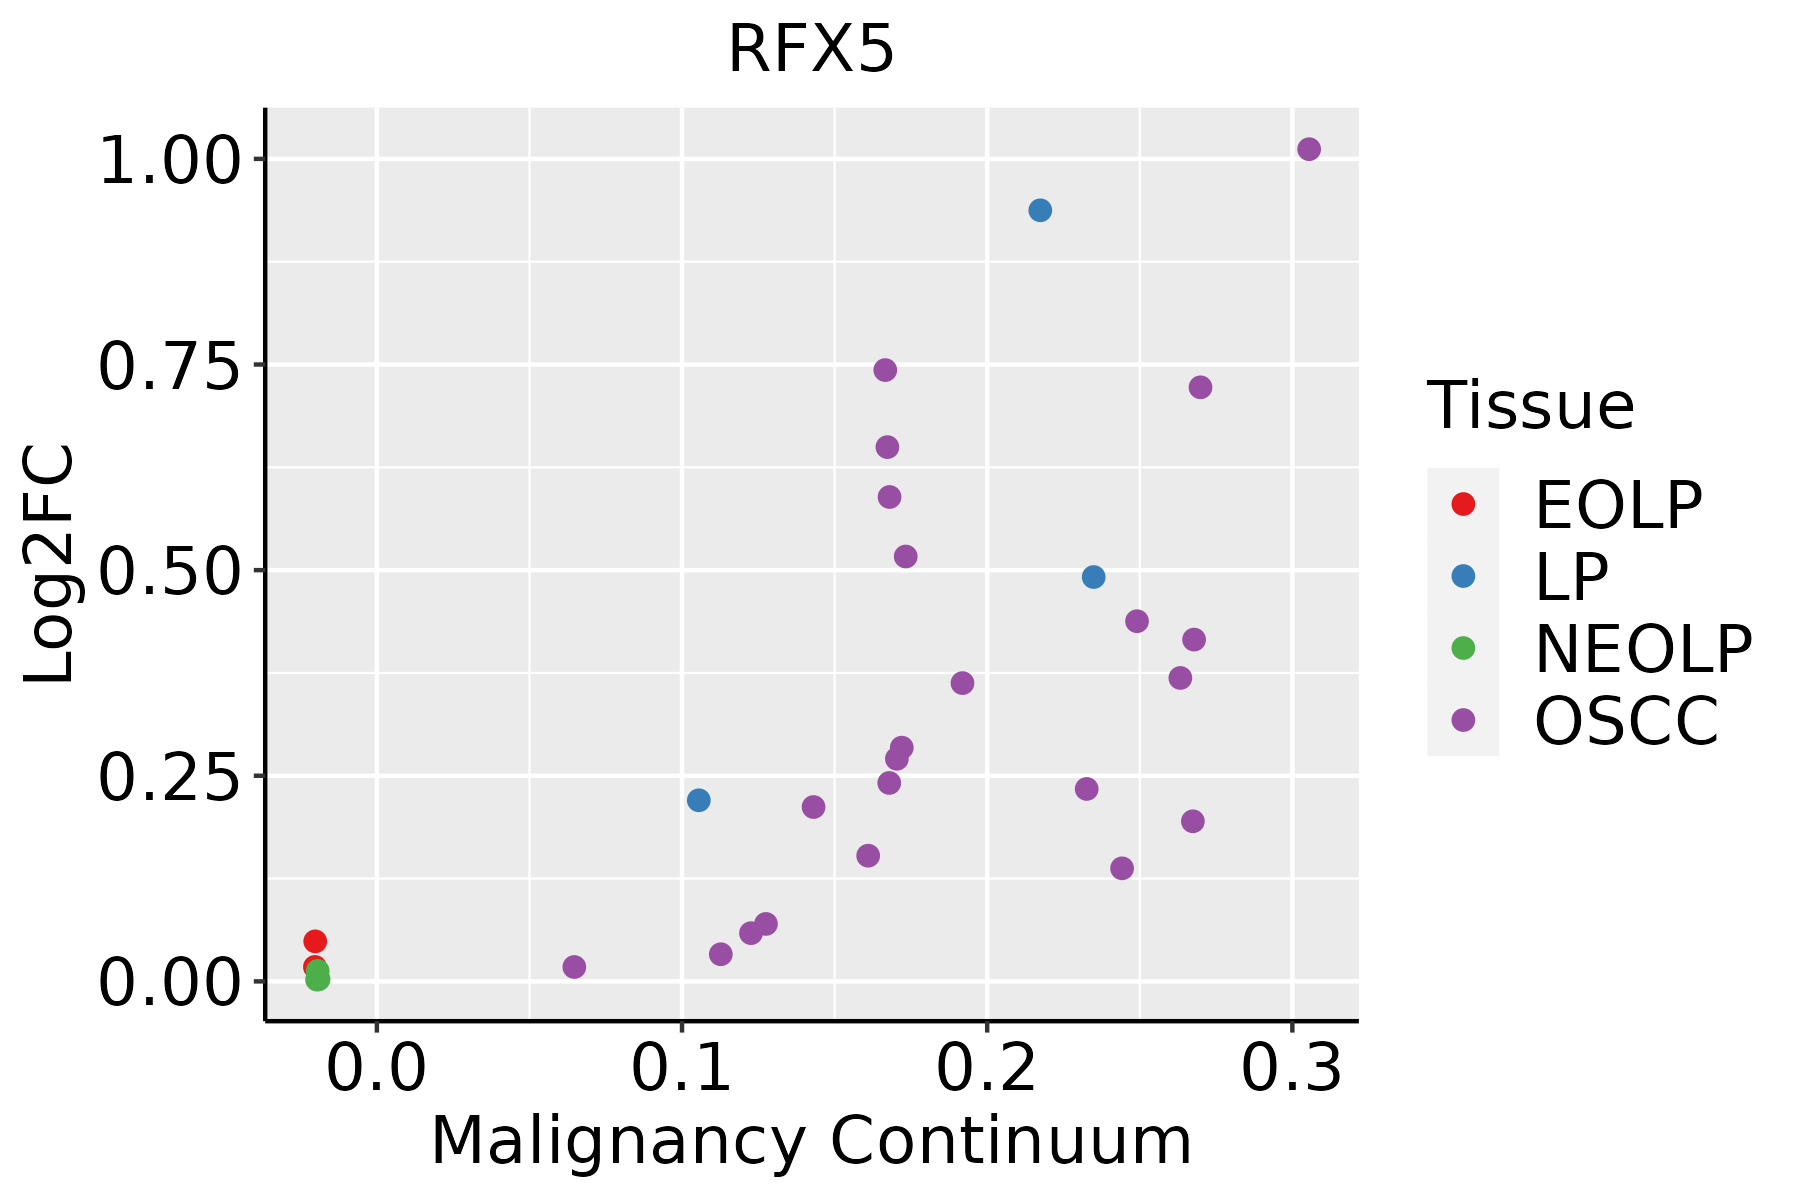 | EOLP: Erosive Oral lichen planus |
| LP: leukoplakia | ||
| NEOLP: Non-erosive oral lichen planus | ||
| OSCC: Oral squamous cell carcinoma |
| ∗log2FC in expression of this searched gene in stem-like cells from each diseased tissue sample relative to stem-like cells in normal samples in each tissue plotted against the malignancy continuum. Samples are colored based on if they are from different disease stage. |
Top |
Malignant transformation related pathway analysis |
| Find out the enriched GO biological processes and KEGG pathways involved in transition from healthy to precancer to cancer |
| Tissue | Disease Stage | Enriched GO biological Processes |
| Colorectum | AD |  |
| Colorectum | SER |  |
| Colorectum | MSS |  |
| Colorectum | MSI-H |  |
| Colorectum | FAP |  |
| ∗Top 15 enriched GO BP terms are showed in the bar plot of each disease state in each tissue. Each row represents a significant GO biological process which is colored according to the -log10(p.adjust). |
| Page: 1 2 3 4 5 6 7 8 9 |
| GO ID | Tissue | Disease Stage | Description | Gene Ratio | Bg Ratio | pvalue | p.adjust | Count |
| Page: 1 |
| Pathway ID | Tissue | Disease Stage | Description | Gene Ratio | Bg Ratio | pvalue | p.adjust | qvalue | Count |
| hsa051527 | Esophagus | ESCC | Tuberculosis | 111/4205 | 180/8465 | 7.14e-04 | 2.32e-03 | 1.19e-03 | 111 |
| hsa0461230 | Esophagus | ESCC | Antigen processing and presentation | 51/4205 | 78/8465 | 3.57e-03 | 9.34e-03 | 4.78e-03 | 51 |
| hsa0515212 | Esophagus | ESCC | Tuberculosis | 111/4205 | 180/8465 | 7.14e-04 | 2.32e-03 | 1.19e-03 | 111 |
| hsa04612114 | Esophagus | ESCC | Antigen processing and presentation | 51/4205 | 78/8465 | 3.57e-03 | 9.34e-03 | 4.78e-03 | 51 |
| hsa051526 | Oral cavity | OSCC | Tuberculosis | 105/3704 | 180/8465 | 5.00e-05 | 2.04e-04 | 1.04e-04 | 105 |
| hsa0461229 | Oral cavity | OSCC | Antigen processing and presentation | 47/3704 | 78/8465 | 2.37e-03 | 6.35e-03 | 3.23e-03 | 47 |
| hsa0515211 | Oral cavity | OSCC | Tuberculosis | 105/3704 | 180/8465 | 5.00e-05 | 2.04e-04 | 1.04e-04 | 105 |
| hsa04612113 | Oral cavity | OSCC | Antigen processing and presentation | 47/3704 | 78/8465 | 2.37e-03 | 6.35e-03 | 3.23e-03 | 47 |
| hsa04612210 | Oral cavity | LP | Antigen processing and presentation | 37/2418 | 78/8465 | 2.98e-04 | 1.60e-03 | 1.03e-03 | 37 |
| hsa0515221 | Oral cavity | LP | Tuberculosis | 65/2418 | 180/8465 | 1.60e-02 | 4.92e-02 | 3.17e-02 | 65 |
| hsa0461237 | Oral cavity | LP | Antigen processing and presentation | 37/2418 | 78/8465 | 2.98e-04 | 1.60e-03 | 1.03e-03 | 37 |
| hsa0515231 | Oral cavity | LP | Tuberculosis | 65/2418 | 180/8465 | 1.60e-02 | 4.92e-02 | 3.17e-02 | 65 |
| Page: 1 |
Top |
Cell-cell communication analysis |
| Identification of potential cell-cell interactions between two cell types and their ligand-receptor pairs for different disease states |
| Ligand | Receptor | LRpair | Pathway | Tissue | Disease Stage |
| Page: 1 |
Top |
Single-cell gene regulatory network inference analysis |
| Find out the significant the regulons (TFs) and the target genes of each regulon across cell types for different disease states |
| TF | Cell Type | Tissue | Disease Stage | Target Gene | RSS | Regulon Activity |
| RFX5 | BN | Breast | DCIS | IGFBP6,ABHD10,GON7, etc. | 2.97e-01 |  |
| RFX5 | FIB | Breast | IDC | RFC5,UBLCP1,C9orf114, etc. | 3.17e-01 |  |
| RFX5 | CD8TEREX | Endometrium | ADJ | ZNF184,RP5-1171I10.5,F3, etc. | 8.87e-03 |  |
| RFX5 | CD8TEX | Endometrium | EEC | ZNF184,RP5-1171I10.5,F3, etc. | 2.81e-02 |  |
| RFX5 | PVA | Esophagus | ADJ | CST1,AHRR,DACH1, etc. | 3.31e-01 |  |
| RFX5 | FIB | Lung | Healthy | MTATP6P1,ZSCAN29,SLC30A1, etc. | 4.43e-01 |  |
| RFX5 | MVA | Oral cavity | ADJ | EXOG,AADAT,TATDN2, etc. | 1.07e-01 |  |
| RFX5 | PVA | Oral cavity | EOLP | EXOG,AADAT,TATDN2, etc. | 4.25e-02 |  |
| RFX5 | STM | Pancreas | PanIN | TUBA1A,TACC2,OLFM4, etc. | 2.94e-01 |  |
| RFX5 | BN | Pancreas | Healthy | BYSL,ZNF547,AC090971.2, etc. | 4.59e-01 |  |
| ∗The dot plots of a searched regulon are shown for all cell subpopulations in each disease state of each tissue based on the regulon specific score inferred using pySCENIC and by calculating the average expression. |
| Page: 1 2 3 4 |
Top |
Somatic mutation of malignant transformation related genes |
| Annotation of somatic variants for genes involved in malignant transformation |
| Hugo Symbol | Variant Class | Variant Classification | dbSNP RS | HGVSc | HGVSp | HGVSp Short | SWISSPROT | BIOTYPE | SIFT | PolyPhen | Tumor Sample Barcode | Tissue | Histology | Sex | Age | Stage | Therapy Types | Drugs | Outcome |
| RFX5 | SNV | Missense_Mutation | rs751429455 | c.460C>T | p.Arg154Trp | p.R154W | P48382 | protein_coding | deleterious(0) | probably_damaging(1) | TCGA-A2-A3XW-01 | Breast | breast invasive carcinoma | Female | <65 | I/II | Chemotherapy | adriamyicin | CR |
| RFX5 | SNV | Missense_Mutation | novel | c.484N>T | p.Ser162Cys | p.S162C | P48382 | protein_coding | deleterious(0.03) | probably_damaging(0.99) | TCGA-A2-A3Y0-01 | Breast | breast invasive carcinoma | Female | <65 | I/II | Chemotherapy | adriamycin | CR |
| RFX5 | SNV | Missense_Mutation | novel | c.1270N>A | p.Gly424Arg | p.G424R | P48382 | protein_coding | tolerated_low_confidence(0.35) | benign(0.09) | TCGA-A8-A06X-01 | Breast | breast invasive carcinoma | Female | >=65 | I/II | Unknown | Unknown | SD |
| RFX5 | SNV | Missense_Mutation | c.1096N>A | p.Pro366Thr | p.P366T | P48382 | protein_coding | deleterious_low_confidence(0.02) | probably_damaging(0.996) | TCGA-A8-A09Z-01 | Breast | breast invasive carcinoma | Female | >=65 | I/II | Unknown | Unknown | SD | |
| RFX5 | SNV | Missense_Mutation | c.1598N>A | p.Gly533Asp | p.G533D | P48382 | protein_coding | tolerated_low_confidence(0.07) | benign(0.007) | TCGA-AN-A0AK-01 | Breast | breast invasive carcinoma | Female | >=65 | I/II | Unknown | Unknown | SD | |
| RFX5 | SNV | Missense_Mutation | c.535N>A | p.Asp179Asn | p.D179N | P48382 | protein_coding | deleterious(0.01) | probably_damaging(0.997) | TCGA-AO-A0JC-01 | Breast | breast invasive carcinoma | Female | <65 | I/II | Chemotherapy | fluorouracil | SD | |
| RFX5 | SNV | Missense_Mutation | c.794N>G | p.Lys265Arg | p.K265R | P48382 | protein_coding | tolerated(0.13) | benign(0.196) | TCGA-BH-A1FC-01 | Breast | breast invasive carcinoma | Female | >=65 | I/II | Unknown | Unknown | SD | |
| RFX5 | SNV | Missense_Mutation | c.791N>G | p.Ser264Cys | p.S264C | P48382 | protein_coding | tolerated(0.08) | benign(0.033) | TCGA-GM-A2D9-01 | Breast | breast invasive carcinoma | Female | >=65 | I/II | Hormone Therapy | arimidex | SD | |
| RFX5 | SNV | Missense_Mutation | novel | c.1780N>C | p.Asp594His | p.D594H | P48382 | protein_coding | deleterious_low_confidence(0) | possibly_damaging(0.733) | TCGA-UU-A93S-01 | Breast | breast invasive carcinoma | Female | <65 | III/IV | Unknown | Unknown | PD |
| RFX5 | insertion | Frame_Shift_Ins | novel | c.34_35insTGTACAGAAATTTTCTGACAATGACAAGCTGTATCTCTACCTTCAGC | p.Lys12MetfsTer51 | p.K12Mfs*51 | P48382 | protein_coding | TCGA-A2-A0CQ-01 | Breast | breast invasive carcinoma | Female | <65 | I/II | Chemotherapy | adriamycin | SD |
| Page: 1 2 3 4 5 6 7 8 9 |
Top |
Related drugs of malignant transformation related genes |
| Identification of chemicals and drugs interact with genes involved in malignant transfromation |
| (DGIdb 4.0) |
| Entrez ID | Symbol | Category | Interaction Types | Drug Claim Name | Drug Name | PMIDs |
| Page: 1 |

Copyright 2023-Present -The University of Texas Health Science Center at Houston |