
|
|||||
|
 | |
| |
| |
| |
| |
| |
|
Gene: RFC5 |
Gene summary for RFC5 |
| Gene information | Species | Human | Gene symbol | RFC5 | Gene ID | 5985 |
| Gene name | replication factor C subunit 5 | |
| Gene Alias | RFC36 | |
| Cytomap | 12q24.23 | |
| Gene Type | protein-coding | GO ID | GO:0006139 | UniProtAcc | P40937 |
Top |
Malignant transformation analysis |
| Identification of the aberrant gene expression in precancerous and cancerous lesions by comparing the gene expression of stem-like cells in diseased tissues with normal stem cells |
| Entrez ID | Symbol | Replicates | Species | Organ | Tissue | Adj P-value | Log2FC | Malignancy |
| 5985 | RFC5 | P31T-E | Human | Esophagus | ESCC | 5.54e-14 | 3.85e-01 | 0.1251 |
| 5985 | RFC5 | P32T-E | Human | Esophagus | ESCC | 6.78e-13 | 3.95e-01 | 0.1666 |
| 5985 | RFC5 | P36T-E | Human | Esophagus | ESCC | 9.23e-07 | 2.67e-01 | 0.1187 |
| 5985 | RFC5 | P37T-E | Human | Esophagus | ESCC | 6.14e-11 | 3.22e-01 | 0.1371 |
| 5985 | RFC5 | P39T-E | Human | Esophagus | ESCC | 1.44e-05 | 9.66e-02 | 0.0894 |
| 5985 | RFC5 | P42T-E | Human | Esophagus | ESCC | 2.65e-03 | 3.02e-01 | 0.1175 |
| 5985 | RFC5 | P47T-E | Human | Esophagus | ESCC | 1.09e-05 | 1.43e-01 | 0.1067 |
| 5985 | RFC5 | P48T-E | Human | Esophagus | ESCC | 3.03e-08 | 1.87e-01 | 0.0959 |
| 5985 | RFC5 | P49T-E | Human | Esophagus | ESCC | 1.26e-04 | 5.98e-01 | 0.1768 |
| 5985 | RFC5 | P52T-E | Human | Esophagus | ESCC | 6.99e-22 | 4.95e-01 | 0.1555 |
| 5985 | RFC5 | P54T-E | Human | Esophagus | ESCC | 7.20e-06 | 2.23e-01 | 0.0975 |
| 5985 | RFC5 | P57T-E | Human | Esophagus | ESCC | 1.20e-02 | 7.03e-02 | 0.0926 |
| 5985 | RFC5 | P61T-E | Human | Esophagus | ESCC | 1.51e-05 | 2.39e-01 | 0.099 |
| 5985 | RFC5 | P62T-E | Human | Esophagus | ESCC | 5.70e-17 | 4.31e-01 | 0.1302 |
| 5985 | RFC5 | P65T-E | Human | Esophagus | ESCC | 5.29e-03 | 1.64e-01 | 0.0978 |
| 5985 | RFC5 | P74T-E | Human | Esophagus | ESCC | 1.70e-17 | 5.13e-01 | 0.1479 |
| 5985 | RFC5 | P75T-E | Human | Esophagus | ESCC | 7.85e-17 | 4.23e-01 | 0.1125 |
| 5985 | RFC5 | P76T-E | Human | Esophagus | ESCC | 9.52e-21 | 4.82e-01 | 0.1207 |
| 5985 | RFC5 | P79T-E | Human | Esophagus | ESCC | 1.37e-30 | 6.80e-01 | 0.1154 |
| 5985 | RFC5 | P80T-E | Human | Esophagus | ESCC | 1.88e-19 | 6.32e-01 | 0.155 |
| Page: 1 2 3 4 |
| Tissue | Expression Dynamics | Abbreviation |
| Esophagus |  | ESCC: Esophageal squamous cell carcinoma |
| HGIN: High-grade intraepithelial neoplasias | ||
| LGIN: Low-grade intraepithelial neoplasias | ||
| Oral Cavity | 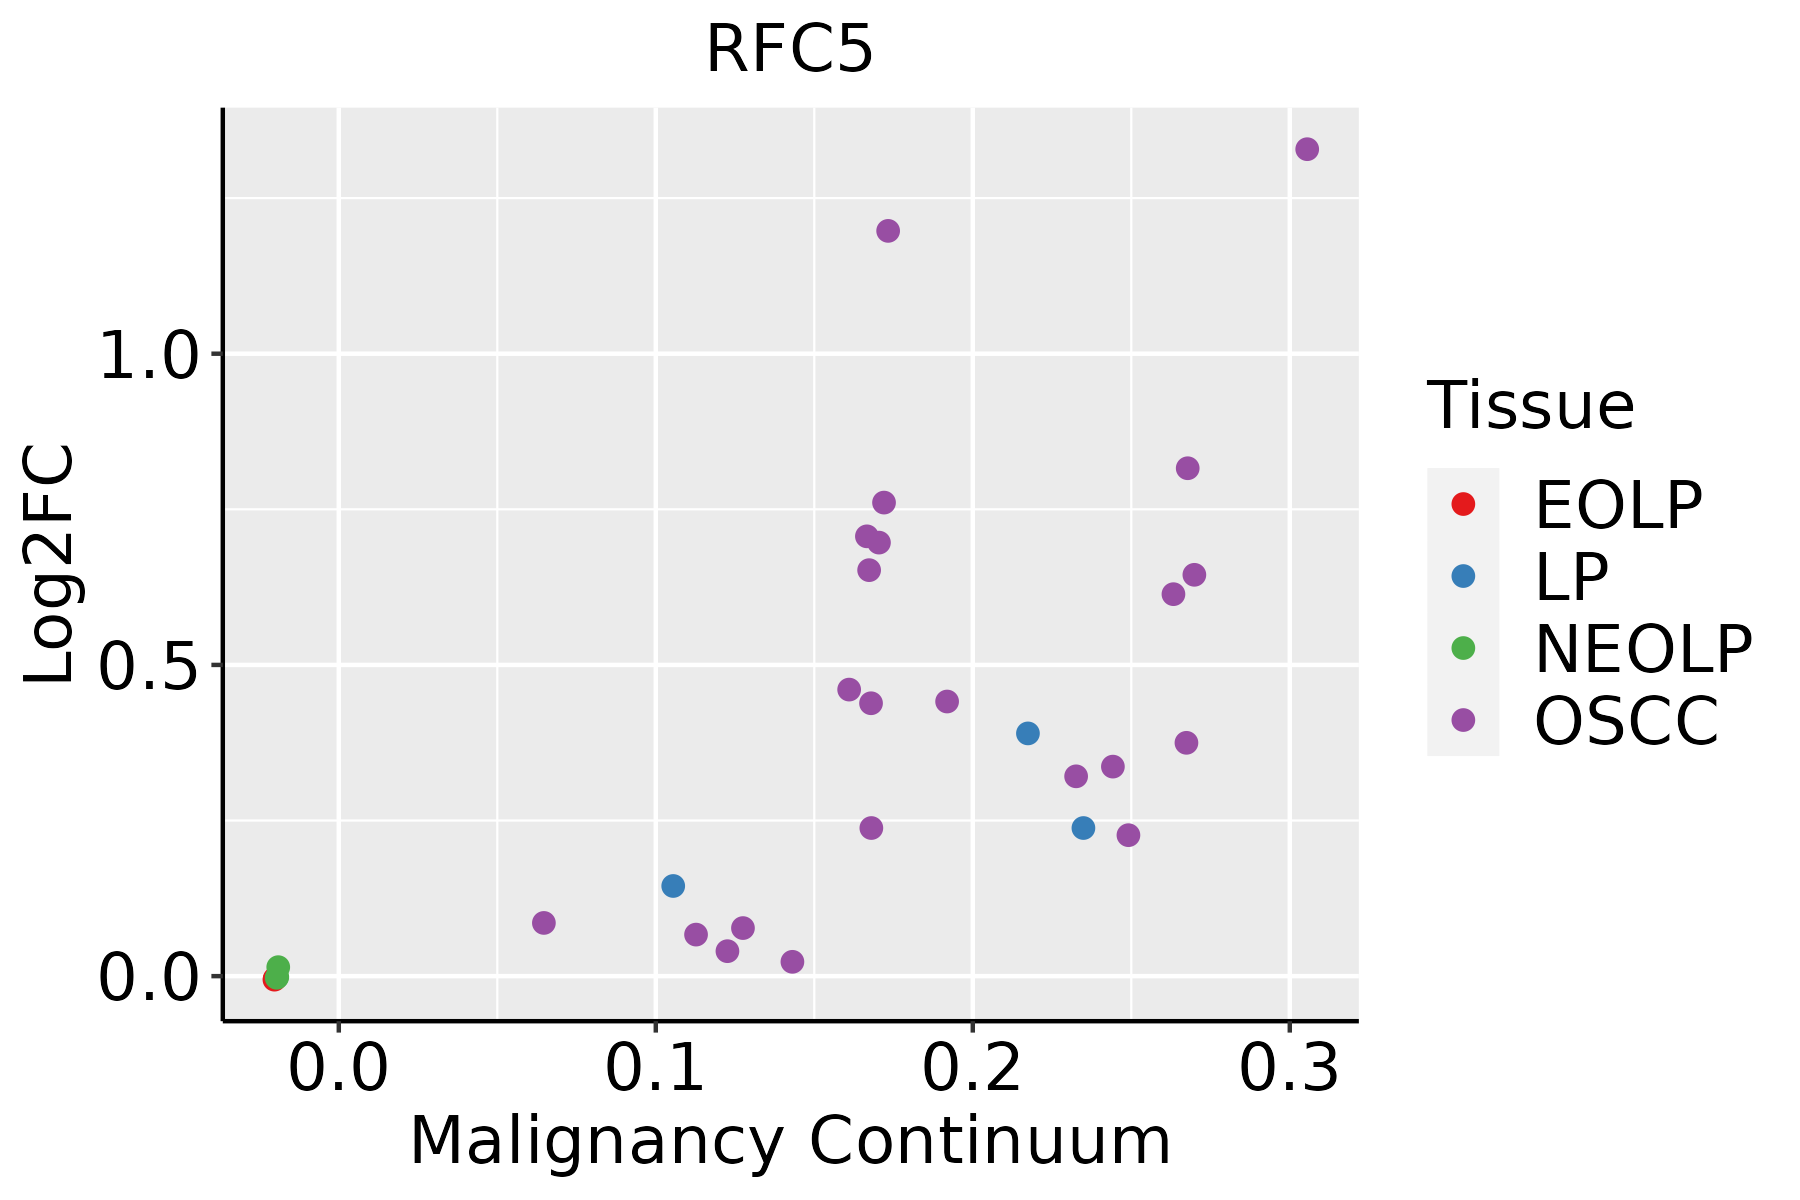 | EOLP: Erosive Oral lichen planus |
| LP: leukoplakia | ||
| NEOLP: Non-erosive oral lichen planus | ||
| OSCC: Oral squamous cell carcinoma | ||
| Skin | 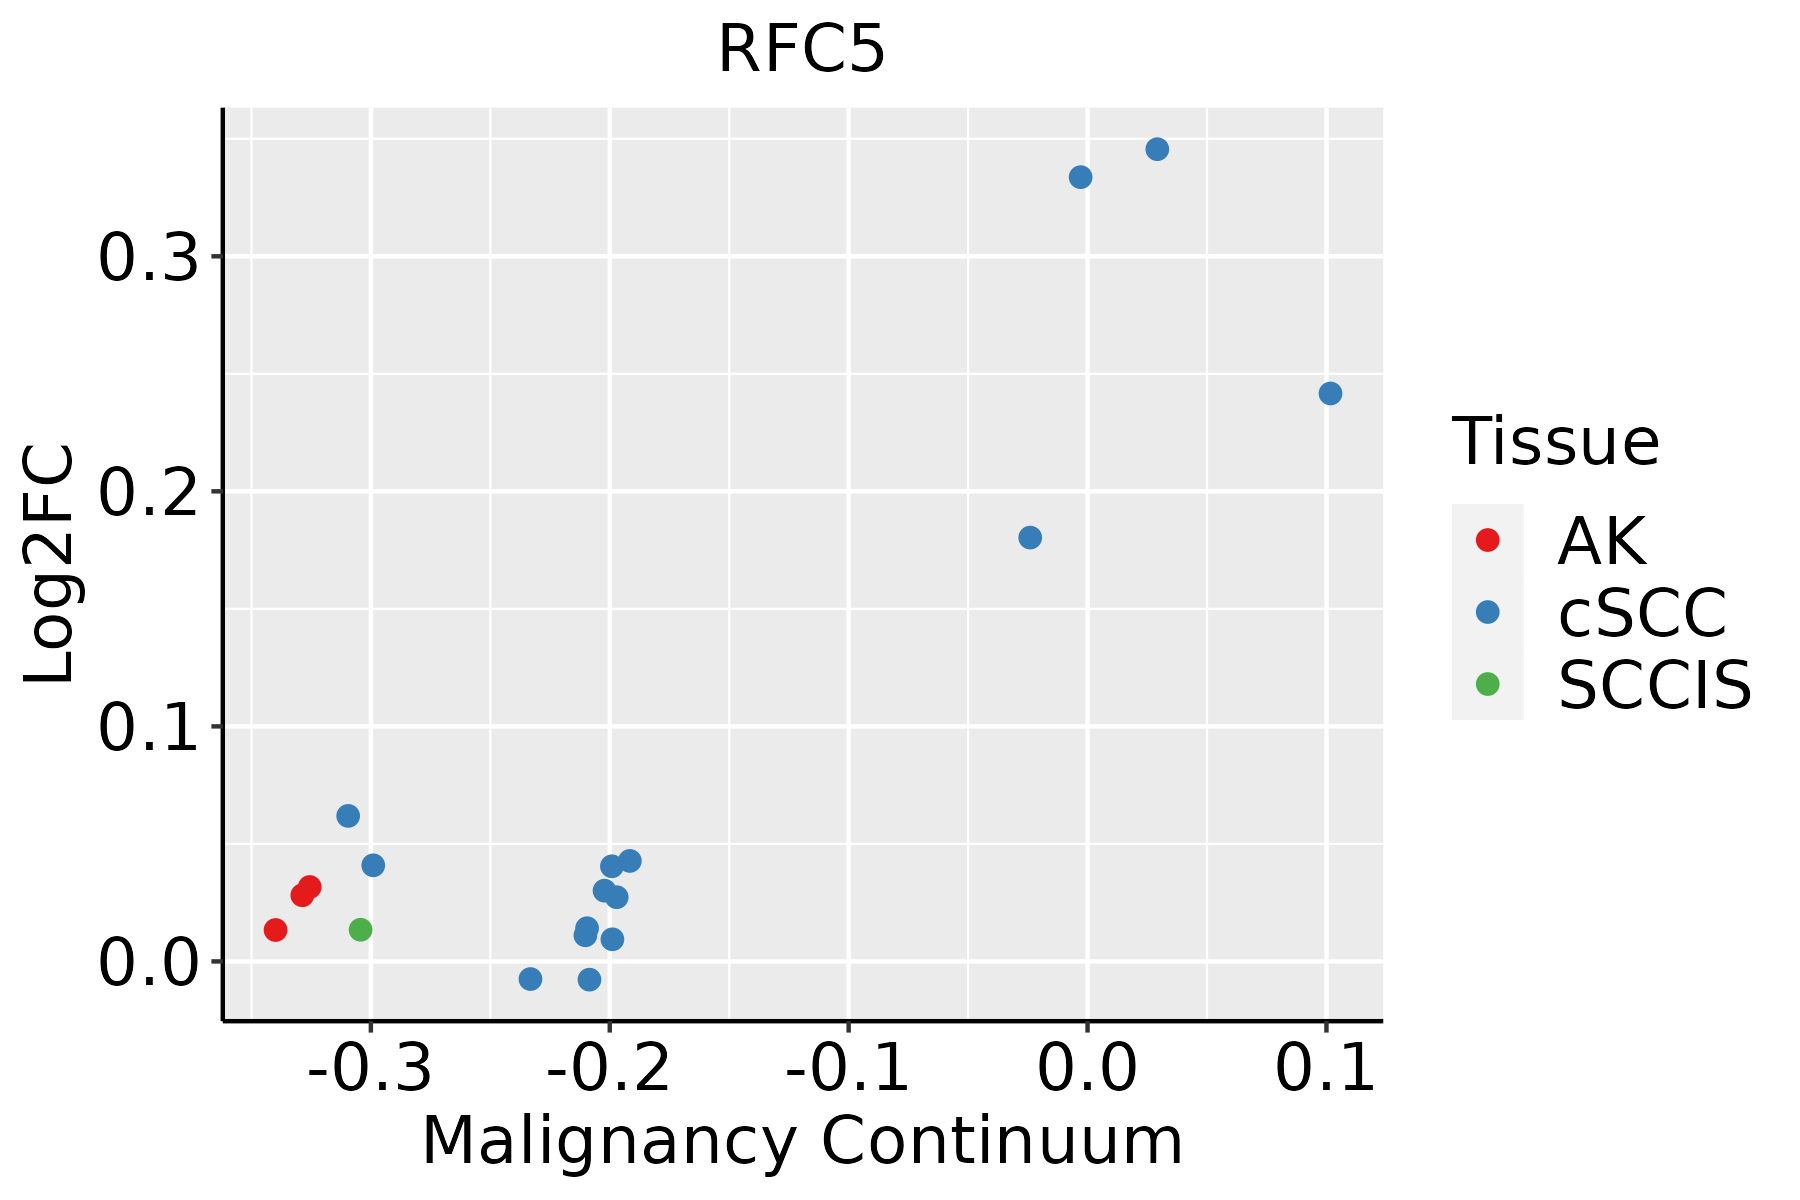 | AK: Actinic keratosis |
| cSCC: Cutaneous squamous cell carcinoma | ||
| SCCIS:squamous cell carcinoma in situ |
| ∗log2FC in expression of this searched gene in stem-like cells from each diseased tissue sample relative to stem-like cells in normal samples in each tissue plotted against the malignancy continuum. Samples are colored based on if they are from different disease stage. |
Top |
Malignant transformation related pathway analysis |
| Find out the enriched GO biological processes and KEGG pathways involved in transition from healthy to precancer to cancer |
| Tissue | Disease Stage | Enriched GO biological Processes |
| Colorectum | AD |  |
| Colorectum | SER |  |
| Colorectum | MSS |  |
| Colorectum | MSI-H |  |
| Colorectum | FAP |  |
| ∗Top 15 enriched GO BP terms are showed in the bar plot of each disease state in each tissue. Each row represents a significant GO biological process which is colored according to the -log10(p.adjust). |
| Page: 1 2 3 4 5 6 7 8 9 |
| GO ID | Tissue | Disease Stage | Description | Gene Ratio | Bg Ratio | pvalue | p.adjust | Count |
| GO:00062604 | Esophagus | ESCC | DNA replication | 181/8552 | 260/18723 | 3.55e-15 | 2.05e-13 | 181 |
| GO:005105215 | Esophagus | ESCC | regulation of DNA metabolic process | 232/8552 | 359/18723 | 2.40e-13 | 1.13e-11 | 232 |
| GO:007189716 | Esophagus | ESCC | DNA biosynthetic process | 127/8552 | 180/18723 | 1.04e-11 | 3.85e-10 | 127 |
| GO:005105417 | Esophagus | ESCC | positive regulation of DNA metabolic process | 139/8552 | 201/18723 | 1.20e-11 | 4.33e-10 | 139 |
| GO:200057319 | Esophagus | ESCC | positive regulation of DNA biosynthetic process | 56/8552 | 66/18723 | 4.51e-11 | 1.45e-09 | 56 |
| GO:2000278110 | Esophagus | ESCC | regulation of DNA biosynthetic process | 81/8552 | 106/18723 | 9.81e-11 | 2.96e-09 | 81 |
| GO:00062612 | Esophagus | ESCC | DNA-dependent DNA replication | 100/8552 | 151/18723 | 2.61e-07 | 3.94e-06 | 100 |
| GO:00062754 | Esophagus | ESCC | regulation of DNA replication | 73/8552 | 107/18723 | 1.97e-06 | 2.28e-05 | 73 |
| GO:003239214 | Esophagus | ESCC | DNA geometric change | 62/8552 | 90/18723 | 7.02e-06 | 7.04e-05 | 62 |
| GO:003250813 | Esophagus | ESCC | DNA duplex unwinding | 58/8552 | 84/18723 | 1.23e-05 | 1.14e-04 | 58 |
| GO:0090329 | Esophagus | ESCC | regulation of DNA-dependent DNA replication | 30/8552 | 46/18723 | 5.91e-03 | 2.18e-02 | 30 |
| GO:00062603 | Oral cavity | OSCC | DNA replication | 159/7305 | 260/18723 | 3.25e-13 | 1.59e-11 | 159 |
| GO:005105210 | Oral cavity | OSCC | regulation of DNA metabolic process | 207/7305 | 359/18723 | 4.45e-13 | 2.17e-11 | 207 |
| GO:005105414 | Oral cavity | OSCC | positive regulation of DNA metabolic process | 126/7305 | 201/18723 | 8.12e-12 | 3.01e-10 | 126 |
| GO:00718979 | Oral cavity | OSCC | DNA biosynthetic process | 106/7305 | 180/18723 | 4.86e-08 | 8.95e-07 | 106 |
| GO:00323925 | Oral cavity | OSCC | DNA geometric change | 59/7305 | 90/18723 | 3.03e-07 | 4.63e-06 | 59 |
| GO:200027817 | Oral cavity | OSCC | regulation of DNA biosynthetic process | 67/7305 | 106/18723 | 3.85e-07 | 5.75e-06 | 67 |
| GO:00325083 | Oral cavity | OSCC | DNA duplex unwinding | 55/7305 | 84/18723 | 8.05e-07 | 1.12e-05 | 55 |
| GO:200057316 | Oral cavity | OSCC | positive regulation of DNA biosynthetic process | 44/7305 | 66/18723 | 4.91e-06 | 5.57e-05 | 44 |
| GO:00062611 | Oral cavity | OSCC | DNA-dependent DNA replication | 84/7305 | 151/18723 | 2.46e-05 | 2.30e-04 | 84 |
| Page: 1 2 |
| Pathway ID | Tissue | Disease Stage | Description | Gene Ratio | Bg Ratio | pvalue | p.adjust | qvalue | Count |
| hsa0342022 | Esophagus | ESCC | Nucleotide excision repair | 54/4205 | 63/8465 | 2.01e-09 | 2.17e-08 | 1.11e-08 | 54 |
| hsa034104 | Esophagus | ESCC | Base excision repair | 38/4205 | 44/8465 | 3.59e-07 | 2.62e-06 | 1.34e-06 | 38 |
| hsa030304 | Esophagus | ESCC | DNA replication | 32/4205 | 36/8465 | 7.71e-07 | 5.06e-06 | 2.59e-06 | 32 |
| hsa034304 | Esophagus | ESCC | Mismatch repair | 21/4205 | 23/8465 | 2.85e-05 | 1.35e-04 | 6.90e-05 | 21 |
| hsa0342032 | Esophagus | ESCC | Nucleotide excision repair | 54/4205 | 63/8465 | 2.01e-09 | 2.17e-08 | 1.11e-08 | 54 |
| hsa0341011 | Esophagus | ESCC | Base excision repair | 38/4205 | 44/8465 | 3.59e-07 | 2.62e-06 | 1.34e-06 | 38 |
| hsa0303011 | Esophagus | ESCC | DNA replication | 32/4205 | 36/8465 | 7.71e-07 | 5.06e-06 | 2.59e-06 | 32 |
| hsa0343011 | Esophagus | ESCC | Mismatch repair | 21/4205 | 23/8465 | 2.85e-05 | 1.35e-04 | 6.90e-05 | 21 |
| hsa034204 | Oral cavity | OSCC | Nucleotide excision repair | 49/3704 | 63/8465 | 3.48e-08 | 2.91e-07 | 1.48e-07 | 49 |
| hsa03030 | Oral cavity | OSCC | DNA replication | 31/3704 | 36/8465 | 1.70e-07 | 1.19e-06 | 6.03e-07 | 31 |
| hsa03410 | Oral cavity | OSCC | Base excision repair | 32/3704 | 44/8465 | 9.11e-05 | 3.25e-04 | 1.65e-04 | 32 |
| hsa03430 | Oral cavity | OSCC | Mismatch repair | 19/3704 | 23/8465 | 1.55e-04 | 5.34e-04 | 2.72e-04 | 19 |
| hsa0342011 | Oral cavity | OSCC | Nucleotide excision repair | 49/3704 | 63/8465 | 3.48e-08 | 2.91e-07 | 1.48e-07 | 49 |
| hsa030301 | Oral cavity | OSCC | DNA replication | 31/3704 | 36/8465 | 1.70e-07 | 1.19e-06 | 6.03e-07 | 31 |
| hsa034101 | Oral cavity | OSCC | Base excision repair | 32/3704 | 44/8465 | 9.11e-05 | 3.25e-04 | 1.65e-04 | 32 |
| hsa034301 | Oral cavity | OSCC | Mismatch repair | 19/3704 | 23/8465 | 1.55e-04 | 5.34e-04 | 2.72e-04 | 19 |
| Page: 1 |
Top |
Cell-cell communication analysis |
| Identification of potential cell-cell interactions between two cell types and their ligand-receptor pairs for different disease states |
| Ligand | Receptor | LRpair | Pathway | Tissue | Disease Stage |
| Page: 1 |
Top |
Single-cell gene regulatory network inference analysis |
| Find out the significant the regulons (TFs) and the target genes of each regulon across cell types for different disease states |
| TF | Cell Type | Tissue | Disease Stage | Target Gene | RSS | Regulon Activity |
| ∗The dot plots of a searched regulon are shown for all cell subpopulations in each disease state of each tissue based on the regulon specific score inferred using pySCENIC and by calculating the average expression. |
| Page: 1 |
Top |
Somatic mutation of malignant transformation related genes |
| Annotation of somatic variants for genes involved in malignant transformation |
| Hugo Symbol | Variant Class | Variant Classification | dbSNP RS | HGVSc | HGVSp | HGVSp Short | SWISSPROT | BIOTYPE | SIFT | PolyPhen | Tumor Sample Barcode | Tissue | Histology | Sex | Age | Stage | Therapy Types | Drugs | Outcome |
| RFC5 | SNV | Missense_Mutation | novel | c.938N>T | p.Ser313Phe | p.S313F | P40937 | protein_coding | deleterious(0) | possibly_damaging(0.891) | TCGA-C8-A8HQ-01 | Breast | breast invasive carcinoma | Female | <65 | I/II | Unknown | Unknown | SD |
| RFC5 | insertion | Nonsense_Mutation | novel | c.181_182insTACAGTCCAGTGGGTAAGTCACAAACATGAG | p.Pro61LeufsTer6 | p.P61Lfs*6 | P40937 | protein_coding | TCGA-A8-A09T-01 | Breast | breast invasive carcinoma | Female | >=65 | I/II | Hormone Therapy | anastrozole | SD | ||
| RFC5 | deletion | Frame_Shift_Del | novel | c.844_845delNN | p.Thr282ArgfsTer8 | p.T282Rfs*8 | P40937 | protein_coding | TCGA-OL-A97C-01 | Breast | breast invasive carcinoma | Female | >=65 | I/II | Unknown | Unknown | PD | ||
| RFC5 | SNV | Missense_Mutation | rs754606469 | c.893G>A | p.Arg298Gln | p.R298Q | P40937 | protein_coding | tolerated(0.07) | benign(0.318) | TCGA-FU-A3HZ-01 | Cervix | cervical & endocervical cancer | Female | <65 | I/II | Chemotherapy | cisplatin | CR |
| RFC5 | SNV | Missense_Mutation | novel | c.848N>C | p.Glu283Ala | p.E283A | P40937 | protein_coding | tolerated(0.26) | possibly_damaging(0.842) | TCGA-AA-3950-01 | Colorectum | colon adenocarcinoma | Female | >=65 | I/II | Unknown | Unknown | SD |
| RFC5 | SNV | Missense_Mutation | rs370871299 | c.451N>G | p.Phe151Val | p.F151V | P40937 | protein_coding | deleterious(0) | probably_damaging(0.995) | TCGA-AA-3984-01 | Colorectum | colon adenocarcinoma | Female | <65 | I/II | Unknown | Unknown | SD |
| RFC5 | SNV | Missense_Mutation | rs760544254 | c.568N>A | p.Val190Met | p.V190M | P40937 | protein_coding | deleterious(0) | benign(0.042) | TCGA-CI-6621-01 | Colorectum | rectum adenocarcinoma | Male | <65 | III/IV | Unknown | Unknown | SD |
| RFC5 | SNV | Missense_Mutation | c.664N>T | p.Ser222Cys | p.S222C | P40937 | protein_coding | deleterious(0.01) | probably_damaging(0.995) | TCGA-A5-A0GH-01 | Endometrium | uterine corpus endometrioid carcinoma | Female | <65 | I/II | Unknown | Unknown | SD | |
| RFC5 | SNV | Missense_Mutation | c.503N>A | p.Arg168His | p.R168H | P40937 | protein_coding | deleterious(0) | probably_damaging(0.997) | TCGA-A5-A2K3-01 | Endometrium | uterine corpus endometrioid carcinoma | Female | >=65 | I/II | Chemotherapy | carboplatin | SD | |
| RFC5 | SNV | Missense_Mutation | rs749146675 | c.400N>A | p.Ala134Thr | p.A134T | P40937 | protein_coding | deleterious(0) | possibly_damaging(0.801) | TCGA-AP-A051-01 | Endometrium | uterine corpus endometrioid carcinoma | Female | >=65 | I/II | Unknown | Unknown | SD |
| Page: 1 2 3 |
Top |
Related drugs of malignant transformation related genes |
| Identification of chemicals and drugs interact with genes involved in malignant transfromation |
| (DGIdb 4.0) |
| Entrez ID | Symbol | Category | Interaction Types | Drug Claim Name | Drug Name | PMIDs |
| Page: 1 |

Copyright 2023-Present -The University of Texas Health Science Center at Houston |