
|
|||||
|
 | |
| |
| |
| |
| |
| |
|
Gene: REPIN1 |
Gene summary for REPIN1 |
| Gene information | Species | Human | Gene symbol | REPIN1 | Gene ID | 29803 |
| Gene name | replication initiator 1 | |
| Gene Alias | AP4 | |
| Cytomap | 7q36.1 | |
| Gene Type | protein-coding | GO ID | GO:0006139 | UniProtAcc | Q9BWE0 |
Top |
Malignant transformation analysis |
| Identification of the aberrant gene expression in precancerous and cancerous lesions by comparing the gene expression of stem-like cells in diseased tissues with normal stem cells |
| Entrez ID | Symbol | Replicates | Species | Organ | Tissue | Adj P-value | Log2FC | Malignancy |
| 29803 | REPIN1 | HTA11_4255_2000001011 | Human | Colorectum | SER | 1.39e-19 | 8.37e-01 | 0.0446 |
| 29803 | REPIN1 | HTA11_9408_2000001011 | Human | Colorectum | AD | 6.41e-12 | 9.13e-01 | 0.0451 |
| 29803 | REPIN1 | HTA11_8622_2000001021 | Human | Colorectum | SER | 1.28e-31 | 1.16e+00 | 0.0528 |
| 29803 | REPIN1 | HTA11_7663_2000001011 | Human | Colorectum | SER | 1.23e-25 | 1.19e+00 | 0.0131 |
| 29803 | REPIN1 | HTA11_10623_2000001011 | Human | Colorectum | AD | 2.37e-25 | 1.05e+00 | -0.0177 |
| 29803 | REPIN1 | HTA11_6801_2000001011 | Human | Colorectum | SER | 2.10e-14 | 7.81e-01 | 0.0171 |
| 29803 | REPIN1 | HTA11_10711_2000001011 | Human | Colorectum | AD | 2.28e-31 | 7.90e-01 | 0.0338 |
| 29803 | REPIN1 | HTA11_7696_3000711011 | Human | Colorectum | AD | 3.76e-78 | 1.33e+00 | 0.0674 |
| 29803 | REPIN1 | HTA11_6818_2000001011 | Human | Colorectum | AD | 7.84e-25 | 1.15e+00 | 0.0112 |
| 29803 | REPIN1 | HTA11_7469_2000001011 | Human | Colorectum | AD | 1.13e-22 | 1.20e+00 | -0.0124 |
| 29803 | REPIN1 | HTA11_11156_2000001011 | Human | Colorectum | AD | 8.06e-16 | 1.10e+00 | 0.0397 |
| 29803 | REPIN1 | HTA11_6818_2000001021 | Human | Colorectum | AD | 9.99e-41 | 1.03e+00 | 0.0588 |
| 29803 | REPIN1 | HTA11_99999970781_79442 | Human | Colorectum | MSS | 1.49e-43 | 7.56e-01 | 0.294 |
| 29803 | REPIN1 | HTA11_99999965062_69753 | Human | Colorectum | MSI-H | 2.60e-16 | 1.10e+00 | 0.3487 |
| 29803 | REPIN1 | HTA11_99999965104_69814 | Human | Colorectum | MSS | 1.63e-41 | 1.14e+00 | 0.281 |
| 29803 | REPIN1 | HTA11_99999971662_82457 | Human | Colorectum | MSS | 4.88e-69 | 1.33e+00 | 0.3859 |
| 29803 | REPIN1 | HTA11_99999973899_84307 | Human | Colorectum | MSS | 1.96e-43 | 1.37e+00 | 0.2585 |
| 29803 | REPIN1 | HTA11_99999974143_84620 | Human | Colorectum | MSS | 3.88e-70 | 1.19e+00 | 0.3005 |
| 29803 | REPIN1 | LZE2T | Human | Esophagus | ESCC | 9.27e-03 | 3.25e-01 | 0.082 |
| 29803 | REPIN1 | LZE7T | Human | Esophagus | ESCC | 2.86e-08 | 3.56e-01 | 0.0667 |
| Page: 1 2 3 4 5 6 7 |
| Tissue | Expression Dynamics | Abbreviation |
| Colorectum (GSE201348) |  | FAP: Familial adenomatous polyposis |
| CRC: Colorectal cancer | ||
| Colorectum (HTA11) |  | AD: Adenomas |
| SER: Sessile serrated lesions | ||
| MSI-H: Microsatellite-high colorectal cancer | ||
| MSS: Microsatellite stable colorectal cancer | ||
| Esophagus | 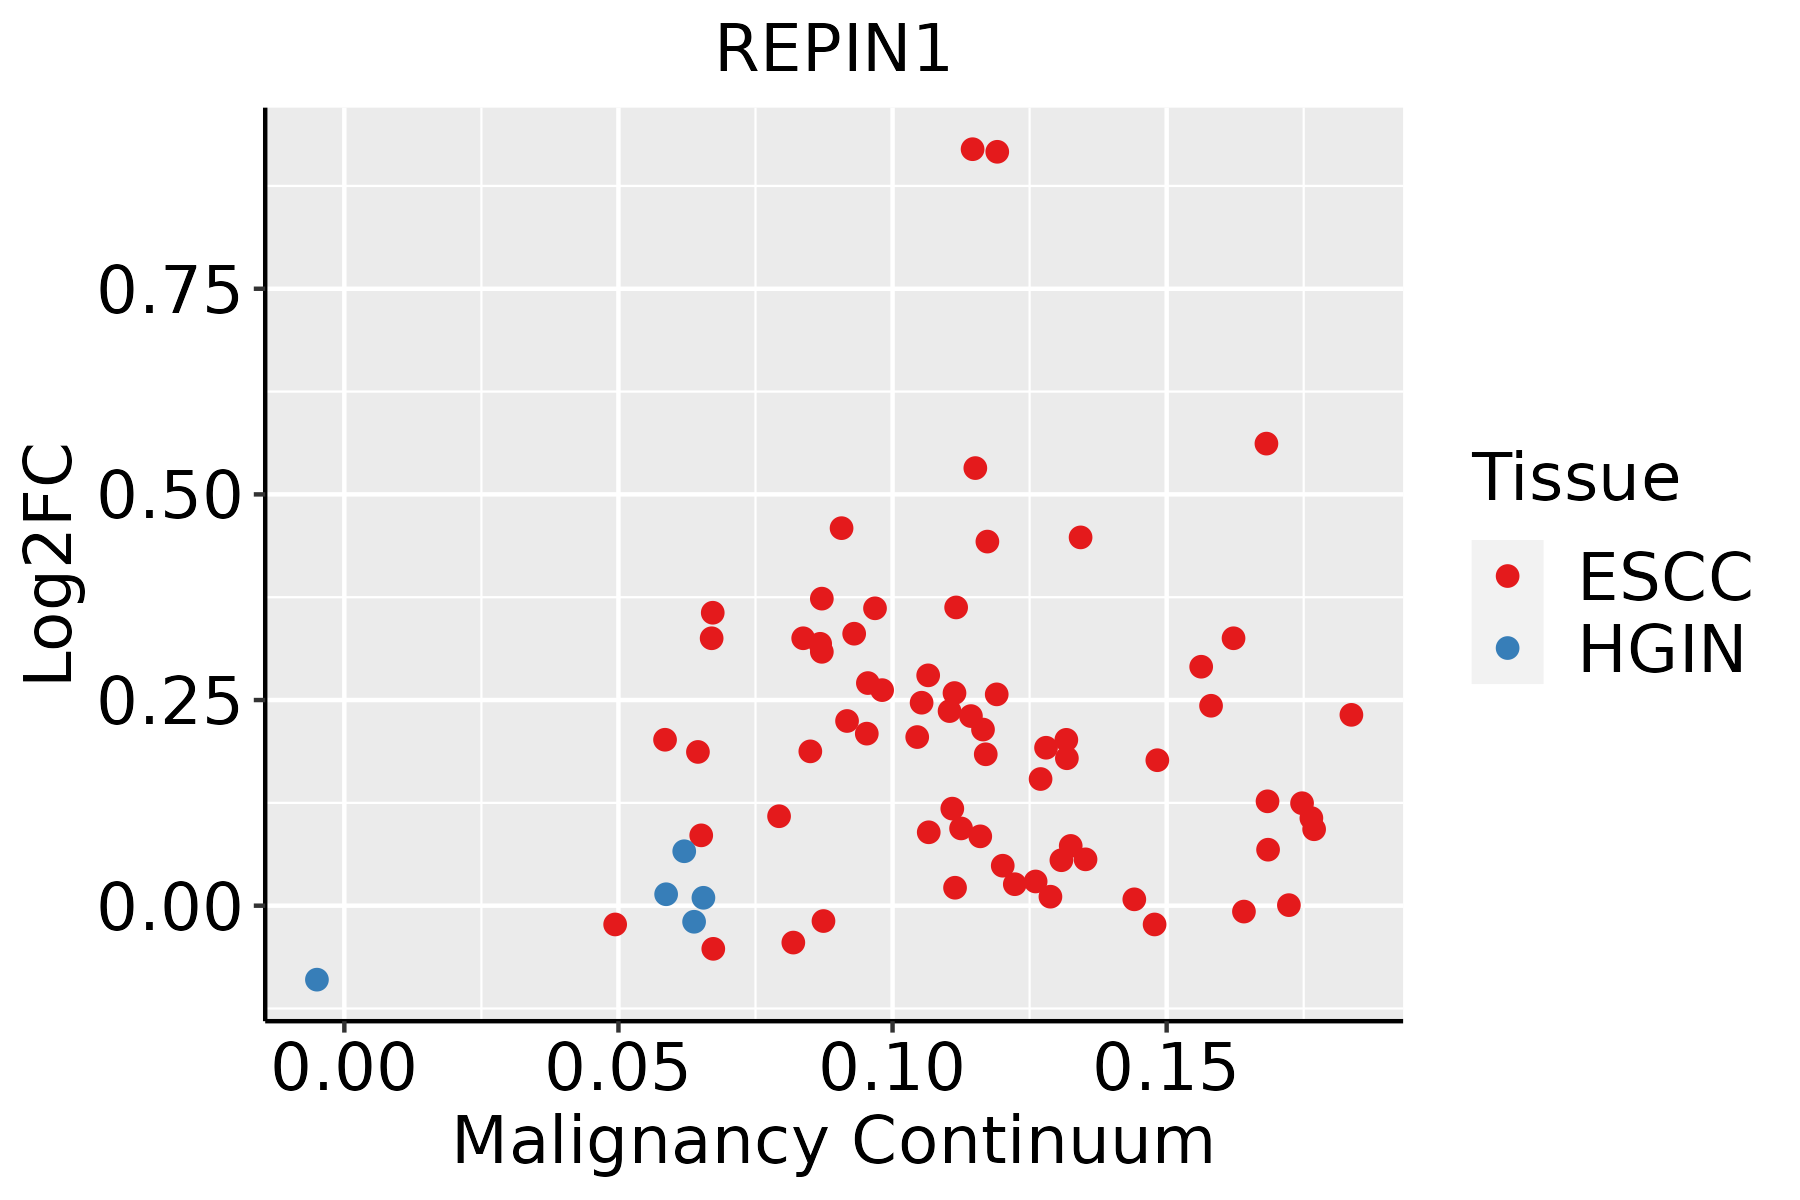 | ESCC: Esophageal squamous cell carcinoma |
| HGIN: High-grade intraepithelial neoplasias | ||
| LGIN: Low-grade intraepithelial neoplasias | ||
| Liver |  | HCC: Hepatocellular carcinoma |
| NAFLD: Non-alcoholic fatty liver disease | ||
| Oral Cavity | 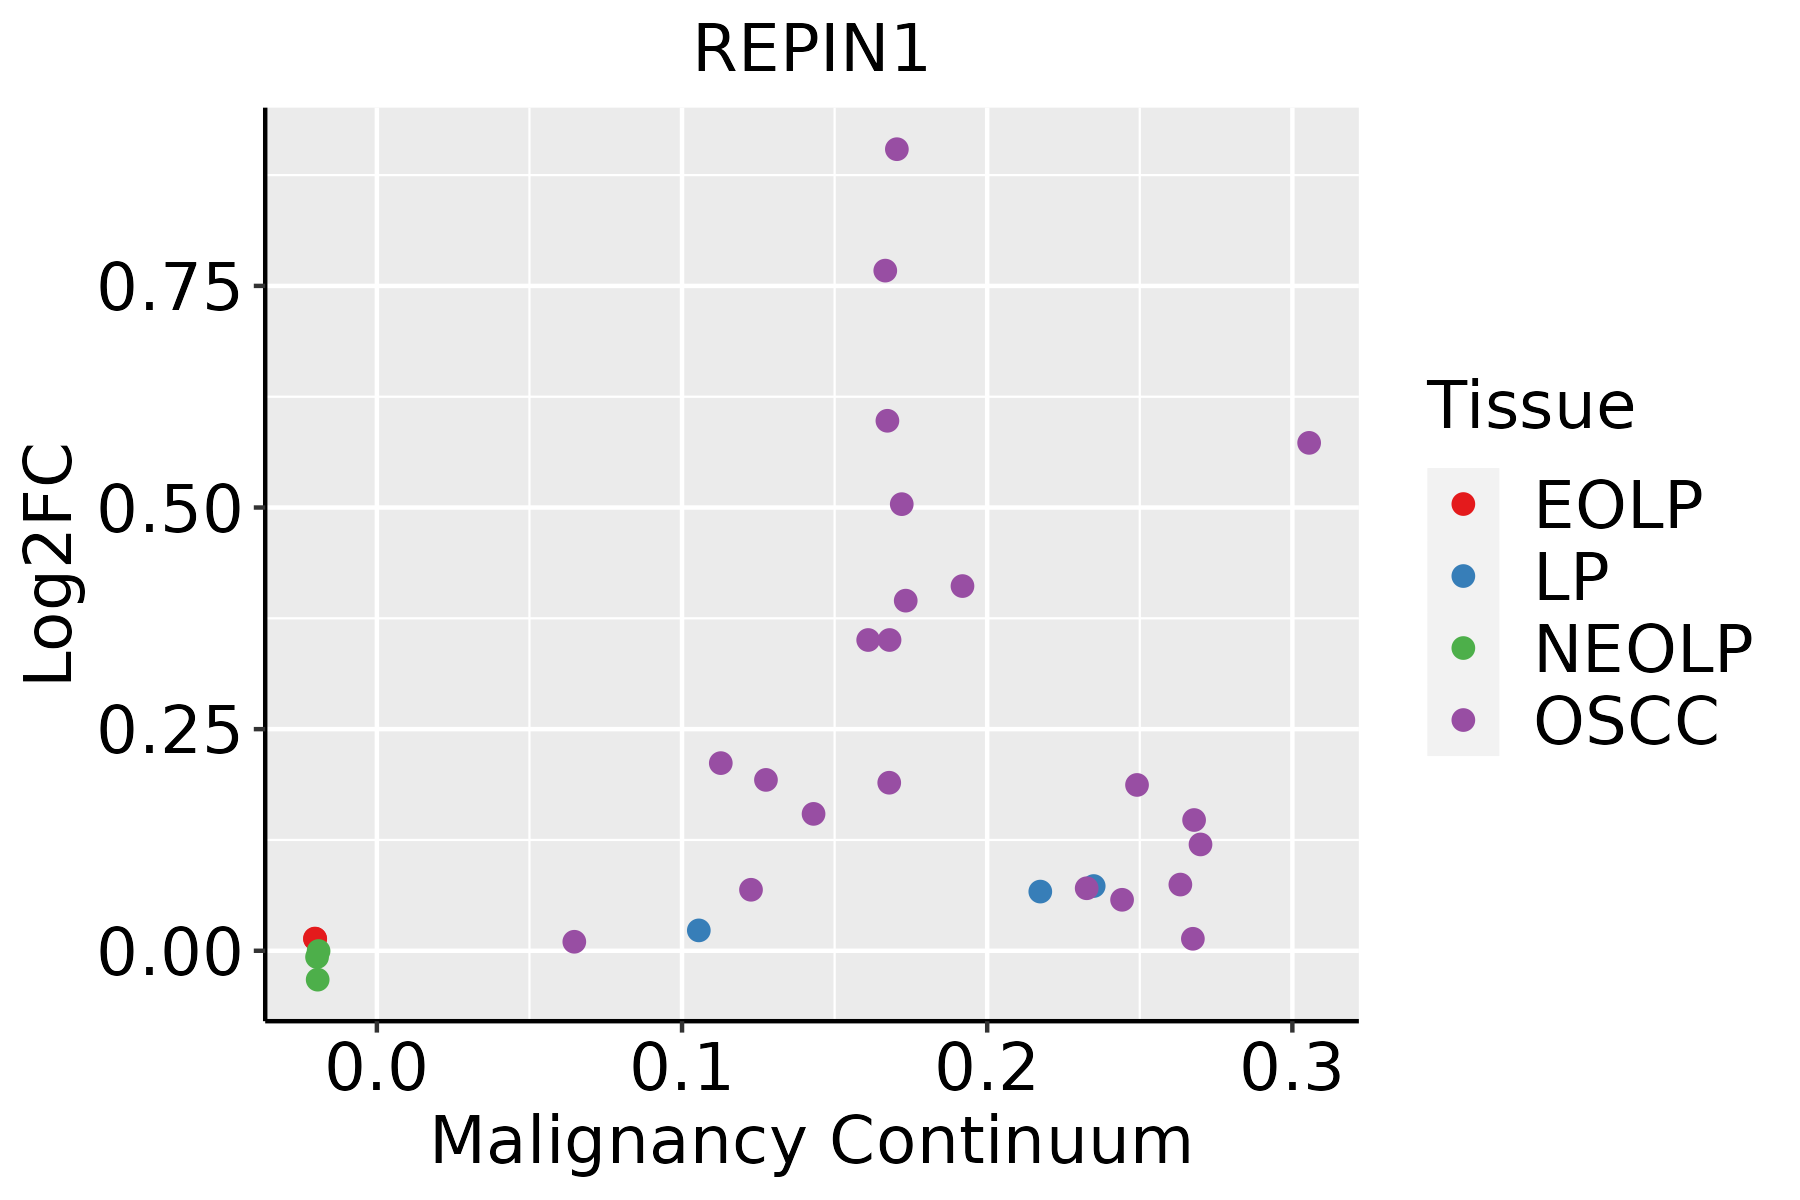 | EOLP: Erosive Oral lichen planus |
| LP: leukoplakia | ||
| NEOLP: Non-erosive oral lichen planus | ||
| OSCC: Oral squamous cell carcinoma | ||
| Prostate | 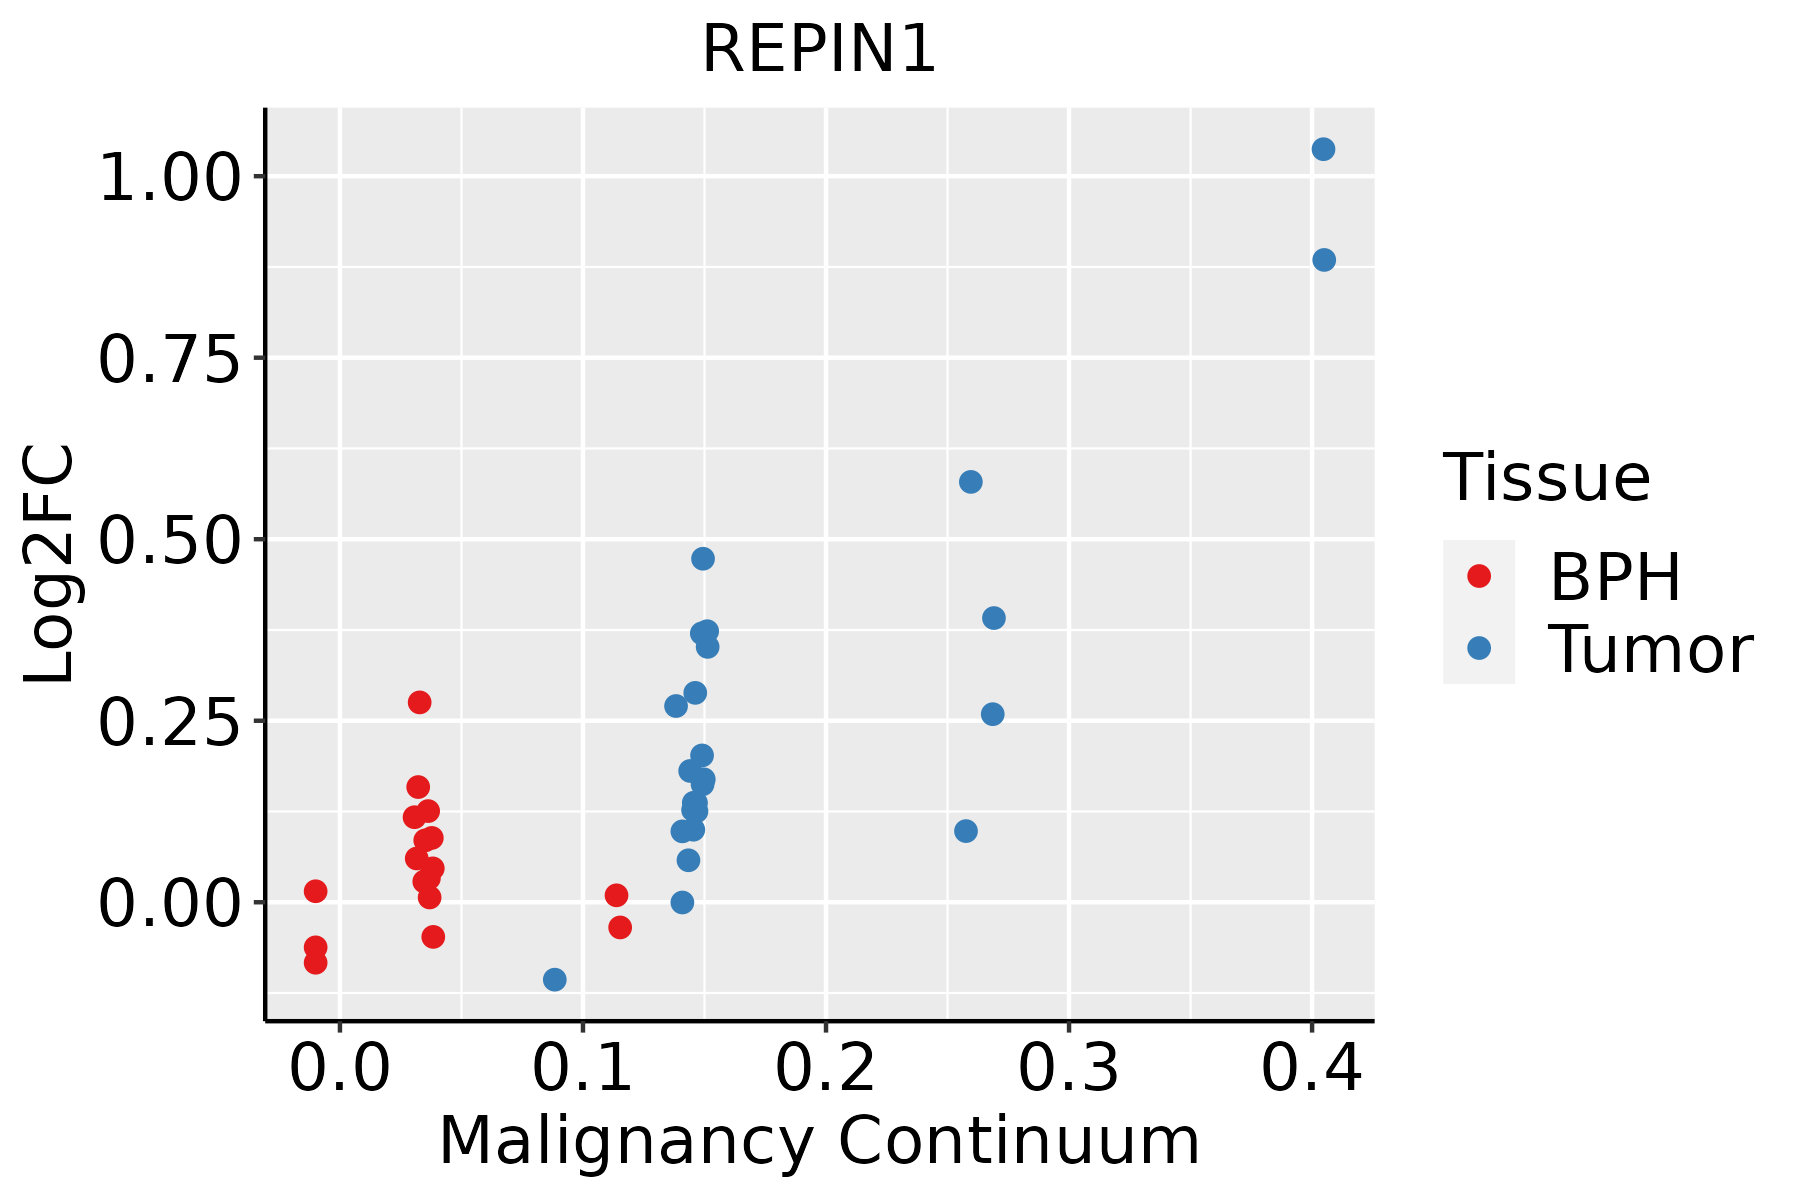 | BPH: Benign Prostatic Hyperplasia |
| Thyroid | 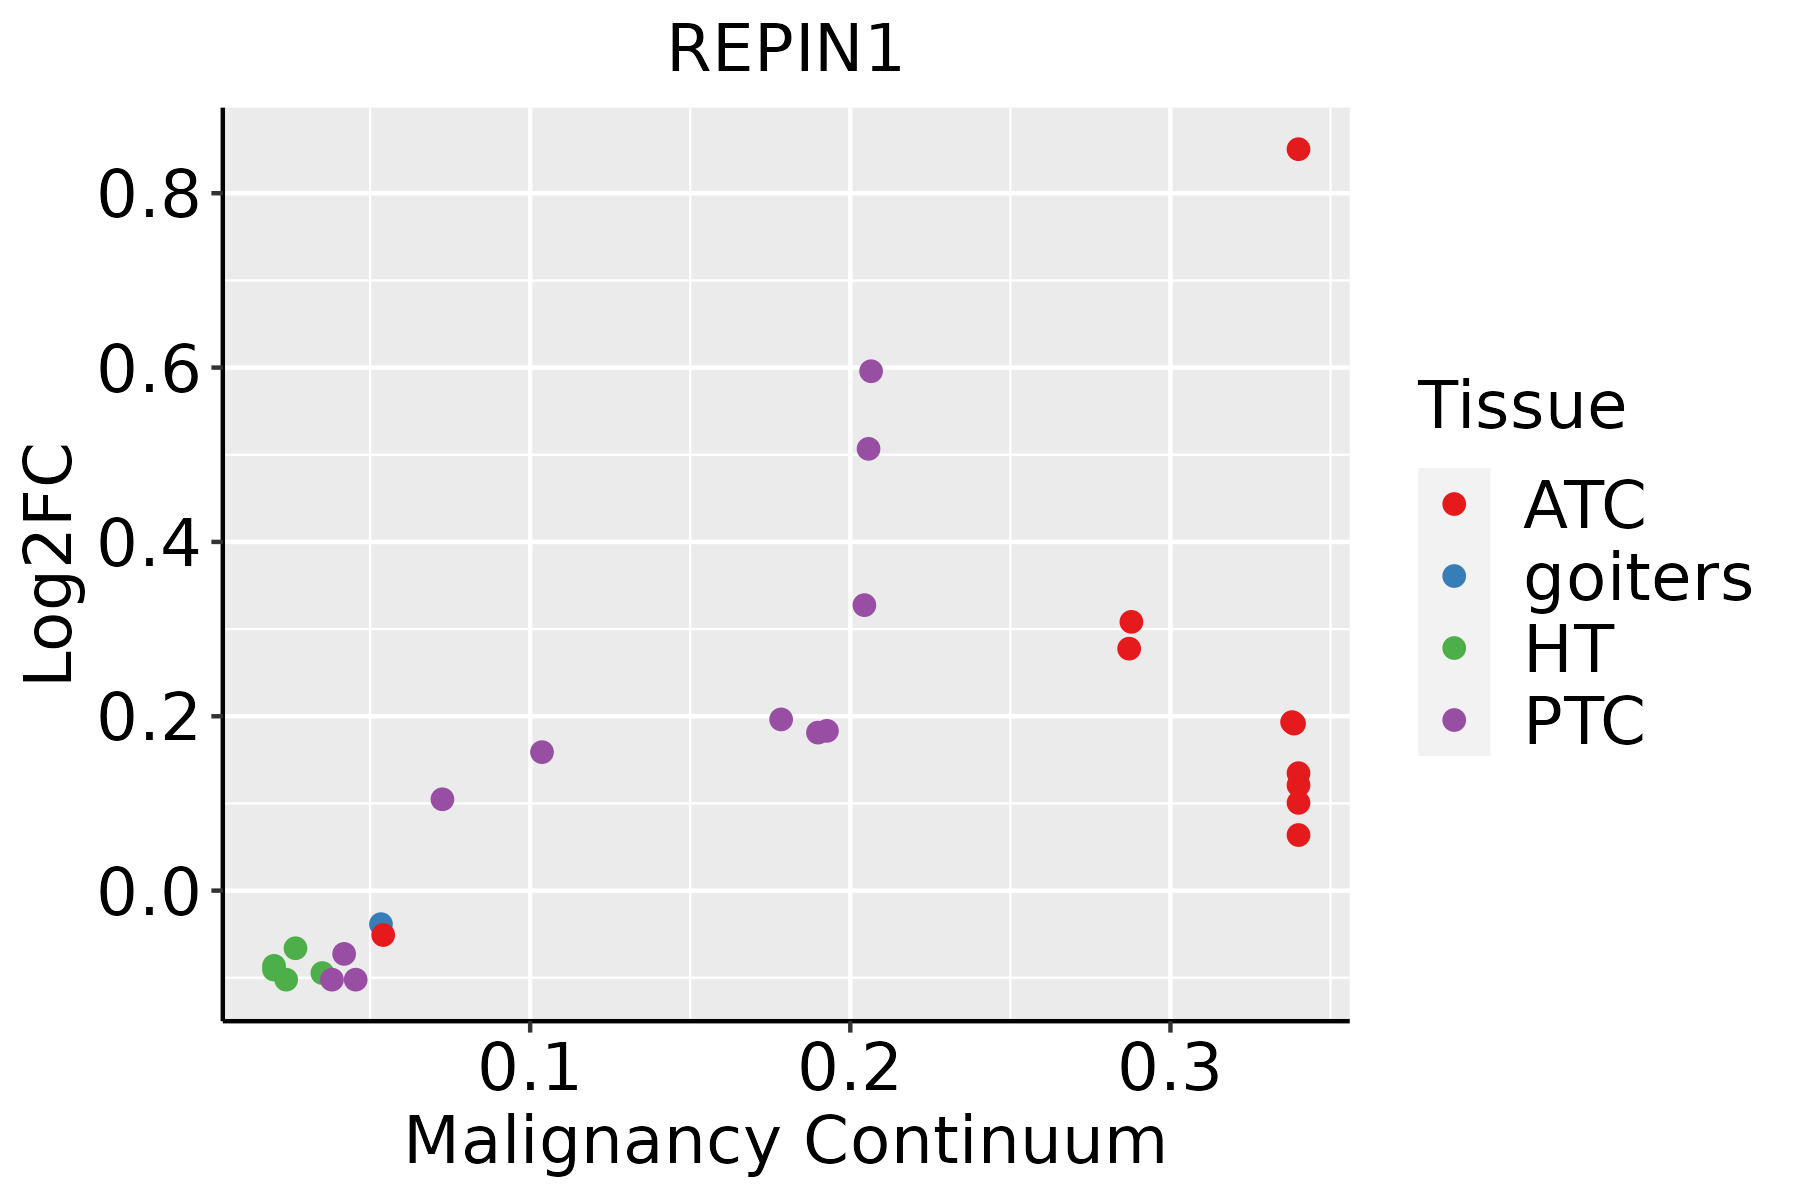 | ATC: Anaplastic thyroid cancer |
| HT: Hashimoto's thyroiditis | ||
| PTC: Papillary thyroid cancer |
| ∗log2FC in expression of this searched gene in stem-like cells from each diseased tissue sample relative to stem-like cells in normal samples in each tissue plotted against the malignancy continuum. Samples are colored based on if they are from different disease stage. |
Top |
Malignant transformation related pathway analysis |
| Find out the enriched GO biological processes and KEGG pathways involved in transition from healthy to precancer to cancer |
| Tissue | Disease Stage | Enriched GO biological Processes |
| Colorectum | AD |  |
| Colorectum | SER |  |
| Colorectum | MSS |  |
| Colorectum | MSI-H |  |
| Colorectum | FAP |  |
| ∗Top 15 enriched GO BP terms are showed in the bar plot of each disease state in each tissue. Each row represents a significant GO biological process which is colored according to the -log10(p.adjust). |
| Page: 1 2 3 4 5 6 7 8 9 |
| GO ID | Tissue | Disease Stage | Description | Gene Ratio | Bg Ratio | pvalue | p.adjust | Count |
| GO:0006260 | Colorectum | MSI-H | DNA replication | 31/1319 | 260/18723 | 2.83e-03 | 3.63e-02 | 31 |
| GO:00062604 | Esophagus | ESCC | DNA replication | 181/8552 | 260/18723 | 3.55e-15 | 2.05e-13 | 181 |
| GO:00062601 | Liver | HCC | DNA replication | 146/7958 | 260/18723 | 5.68e-06 | 7.02e-05 | 146 |
| GO:00062603 | Oral cavity | OSCC | DNA replication | 159/7305 | 260/18723 | 3.25e-13 | 1.59e-11 | 159 |
| GO:00062606 | Thyroid | PTC | DNA replication | 114/5968 | 260/18723 | 3.09e-05 | 2.95e-04 | 114 |
| GO:000626013 | Thyroid | ATC | DNA replication | 124/6293 | 260/18723 | 1.58e-06 | 1.93e-05 | 124 |
| Page: 1 |
| Pathway ID | Tissue | Disease Stage | Description | Gene Ratio | Bg Ratio | pvalue | p.adjust | qvalue | Count |
| Page: 1 |
Top |
Cell-cell communication analysis |
| Identification of potential cell-cell interactions between two cell types and their ligand-receptor pairs for different disease states |
| Ligand | Receptor | LRpair | Pathway | Tissue | Disease Stage |
| Page: 1 |
Top |
Single-cell gene regulatory network inference analysis |
| Find out the significant the regulons (TFs) and the target genes of each regulon across cell types for different disease states |
| TF | Cell Type | Tissue | Disease Stage | Target Gene | RSS | Regulon Activity |
| ∗The dot plots of a searched regulon are shown for all cell subpopulations in each disease state of each tissue based on the regulon specific score inferred using pySCENIC and by calculating the average expression. |
| Page: 1 |
Top |
Somatic mutation of malignant transformation related genes |
| Annotation of somatic variants for genes involved in malignant transformation |
| Hugo Symbol | Variant Class | Variant Classification | dbSNP RS | HGVSc | HGVSp | HGVSp Short | SWISSPROT | BIOTYPE | SIFT | PolyPhen | Tumor Sample Barcode | Tissue | Histology | Sex | Age | Stage | Therapy Types | Drugs | Outcome |
| REPIN1 | SNV | Missense_Mutation | novel | c.166G>A | p.Glu56Lys | p.E56K | Q9BWE0 | protein_coding | tolerated_low_confidence(0.07) | benign(0.023) | TCGA-A7-A4SF-01 | Breast | breast invasive carcinoma | Female | <65 | I/II | Chemotherapy | carboplatin | CR |
| REPIN1 | SNV | Missense_Mutation | c.1637G>A | p.Cys546Tyr | p.C546Y | Q9BWE0 | protein_coding | deleterious(0) | probably_damaging(1) | TCGA-A8-A09Z-01 | Breast | breast invasive carcinoma | Female | >=65 | I/II | Unknown | Unknown | SD | |
| REPIN1 | SNV | Missense_Mutation | c.577N>T | p.Arg193Trp | p.R193W | Q9BWE0 | protein_coding | deleterious(0) | possibly_damaging(0.745) | TCGA-E9-A22H-01 | Breast | breast invasive carcinoma | Female | <65 | I/II | Chemotherapy | doxorubicin | SD | |
| REPIN1 | SNV | Missense_Mutation | novel | c.1668N>T | p.Lys556Asn | p.K556N | Q9BWE0 | protein_coding | tolerated(0.14) | possibly_damaging(0.851) | TCGA-LL-A441-01 | Breast | breast invasive carcinoma | Female | <65 | I/II | Chemotherapy | taxotere | CR |
| REPIN1 | SNV | Missense_Mutation | novel | c.1522C>T | p.Arg508Cys | p.R508C | Q9BWE0 | protein_coding | deleterious(0) | probably_damaging(0.999) | TCGA-OL-A6VO-01 | Breast | breast invasive carcinoma | Female | <65 | I/II | Chemotherapy | taxotere | CR |
| REPIN1 | SNV | Missense_Mutation | novel | c.1432C>T | p.His478Tyr | p.H478Y | Q9BWE0 | protein_coding | deleterious(0) | probably_damaging(0.999) | TCGA-2W-A8YY-01 | Cervix | cervical & endocervical cancer | Female | <65 | I/II | Chemotherapy | cisplatin | CR |
| REPIN1 | SNV | Missense_Mutation | c.1537N>A | p.Asp513Asn | p.D513N | Q9BWE0 | protein_coding | deleterious(0.01) | benign(0.159) | TCGA-BI-A0VR-01 | Cervix | cervical & endocervical cancer | Female | <65 | III/IV | Unknown | Unknown | SD | |
| REPIN1 | SNV | Missense_Mutation | rs759469837 | c.1018N>T | p.Arg340Trp | p.R340W | Q9BWE0 | protein_coding | deleterious(0) | probably_damaging(0.991) | TCGA-BI-A0VS-01 | Cervix | cervical & endocervical cancer | Female | <65 | I/II | Unknown | Unknown | SD |
| REPIN1 | deletion | Frame_Shift_Del | rs759247453 | c.1287delC | p.Ser430ProfsTer? | p.S430Pfs*? | Q9BWE0 | protein_coding | TCGA-VS-A94Z-01 | Cervix | cervical & endocervical cancer | Female | <65 | I/II | Chemotherapy | cisplatin | CR | ||
| REPIN1 | SNV | Missense_Mutation | rs376711625 | c.482N>A | p.Arg161His | p.R161H | Q9BWE0 | protein_coding | tolerated(0.16) | benign(0) | TCGA-A6-5661-01 | Colorectum | colon adenocarcinoma | Female | >=65 | I/II | Unknown | Unknown | SD |
| Page: 1 2 3 4 |
Top |
Related drugs of malignant transformation related genes |
| Identification of chemicals and drugs interact with genes involved in malignant transfromation |
| (DGIdb 4.0) |
| Entrez ID | Symbol | Category | Interaction Types | Drug Claim Name | Drug Name | PMIDs |
| Page: 1 |

Copyright 2023-Present -The University of Texas Health Science Center at Houston |