Schematic overview of the cellular and molecular mechanisms involved in the cancer progression, including the proposed cellular and molecular mechanisms in cancer cells trajectory. AT1: alveolar type 1 cells; AT2: alveolar type 2 cells; AAH: atypical adenomatous hyperplasia; AIS: adenocarcinoma in situ; MIA: minimally invasive adenocarcinoma; IA: invasive adenocarcinoma; EMT: epithelial-mesenchymal transition

Home

Download

Statistics

Help

Contact

Center for Computational Systems Medicine
leaf

Gene summary

leaf

Malignant transformation analysis

leaf

Malignant transformation related pathway analysis

leaf

Cell-cell communication analysis

leaf

Single-cell gene regulatory network inference analysis

leaf

Somatic mutation of malignant transformation related genes

leaf

Related drugs of malignant transformation related genes

Gene: RBM47

Gene summary for RBM47

check button Gene summary.

Gene informationSpeciesHuman
Gene symbol

RBM47

Gene ID

54502

Gene nameRNA binding motif protein 47
Gene AliasNET18
Cytomap4p14
Gene Typeprotein-coding
GO ID

GO:0002244

UniProtAcc

A0AV96


Top

Malignant transformation analysis

check button Identification of the aberrant gene expression in precancerous and cancerous lesions by comparing the gene expression of stem-like cells in diseased tissues with normal stem cells
check button Malignant transformation involving gene list.
Entrez IDSymbolReplicatesSpeciesOrganTissueAdj P-valueLog2FCMalignancy
54502RBM47HTA11_99999974143_84620HumanColorectumMSS5.34e-55-9.01e-010.3005
54502RBM47F007HumanColorectumFAP4.03e-10-5.07e-010.1176
54502RBM47A002-C-010HumanColorectumFAP2.16e-02-2.75e-010.242
54502RBM47A001-C-207HumanColorectumFAP3.40e-08-3.82e-010.1278
54502RBM47A015-C-203HumanColorectumFAP2.43e-39-5.65e-01-0.1294
54502RBM47A015-C-204HumanColorectumFAP2.35e-13-5.07e-01-0.0228
54502RBM47A014-C-040HumanColorectumFAP6.82e-12-7.05e-01-0.1184
54502RBM47A002-C-201HumanColorectumFAP3.00e-26-5.49e-010.0324
54502RBM47A002-C-203HumanColorectumFAP3.29e-03-2.39e-010.2786
54502RBM47A001-C-119HumanColorectumFAP1.24e-13-5.85e-01-0.1557
54502RBM47A001-C-108HumanColorectumFAP1.80e-29-5.56e-01-0.0272
54502RBM47A002-C-205HumanColorectumFAP3.33e-40-6.91e-01-0.1236
54502RBM47A001-C-104HumanColorectumFAP5.66e-12-4.14e-010.0184
54502RBM47A015-C-005HumanColorectumFAP3.10e-05-2.89e-01-0.0336
54502RBM47A015-C-006HumanColorectumFAP3.38e-34-8.75e-01-0.0994
54502RBM47A015-C-106HumanColorectumFAP9.84e-28-5.12e-01-0.0511
54502RBM47A002-C-114HumanColorectumFAP3.32e-37-7.53e-01-0.1561
54502RBM47A015-C-104HumanColorectumFAP4.25e-47-6.96e-01-0.1899
54502RBM47A001-C-014HumanColorectumFAP4.30e-28-5.43e-010.0135
54502RBM47A002-C-016HumanColorectumFAP1.11e-31-5.94e-010.0521
Page: 1 2 3 4 5 6 7 8 9 10 11 12 13 

check button Transcriptomic changes along malignancy continuum.
TissueExpression DynamicsAbbreviation
CervixThe image shows the transcriptomic changes along malignancy continuum.log2FC in expression of this searched gene in stem-like cells from each diseased tissue sample relative to stem-like cells in normal samples in each tissue plotted against the malignancy continuum. Samples are colored based on if they are from different disease stage.CC: Cervix cancer
HSIL_HPV: HPV-infected high-grade squamous intraepithelial lesions
N_HPV: HPV-infected normal cervix
Colorectum (GSE201348)The image shows the transcriptomic changes along malignancy continuum.log2FC in expression of this searched gene in stem-like cells from each diseased tissue sample relative to stem-like cells in normal samples in each tissue plotted against the malignancy continuum. Samples are colored based on if they are from different disease stage.
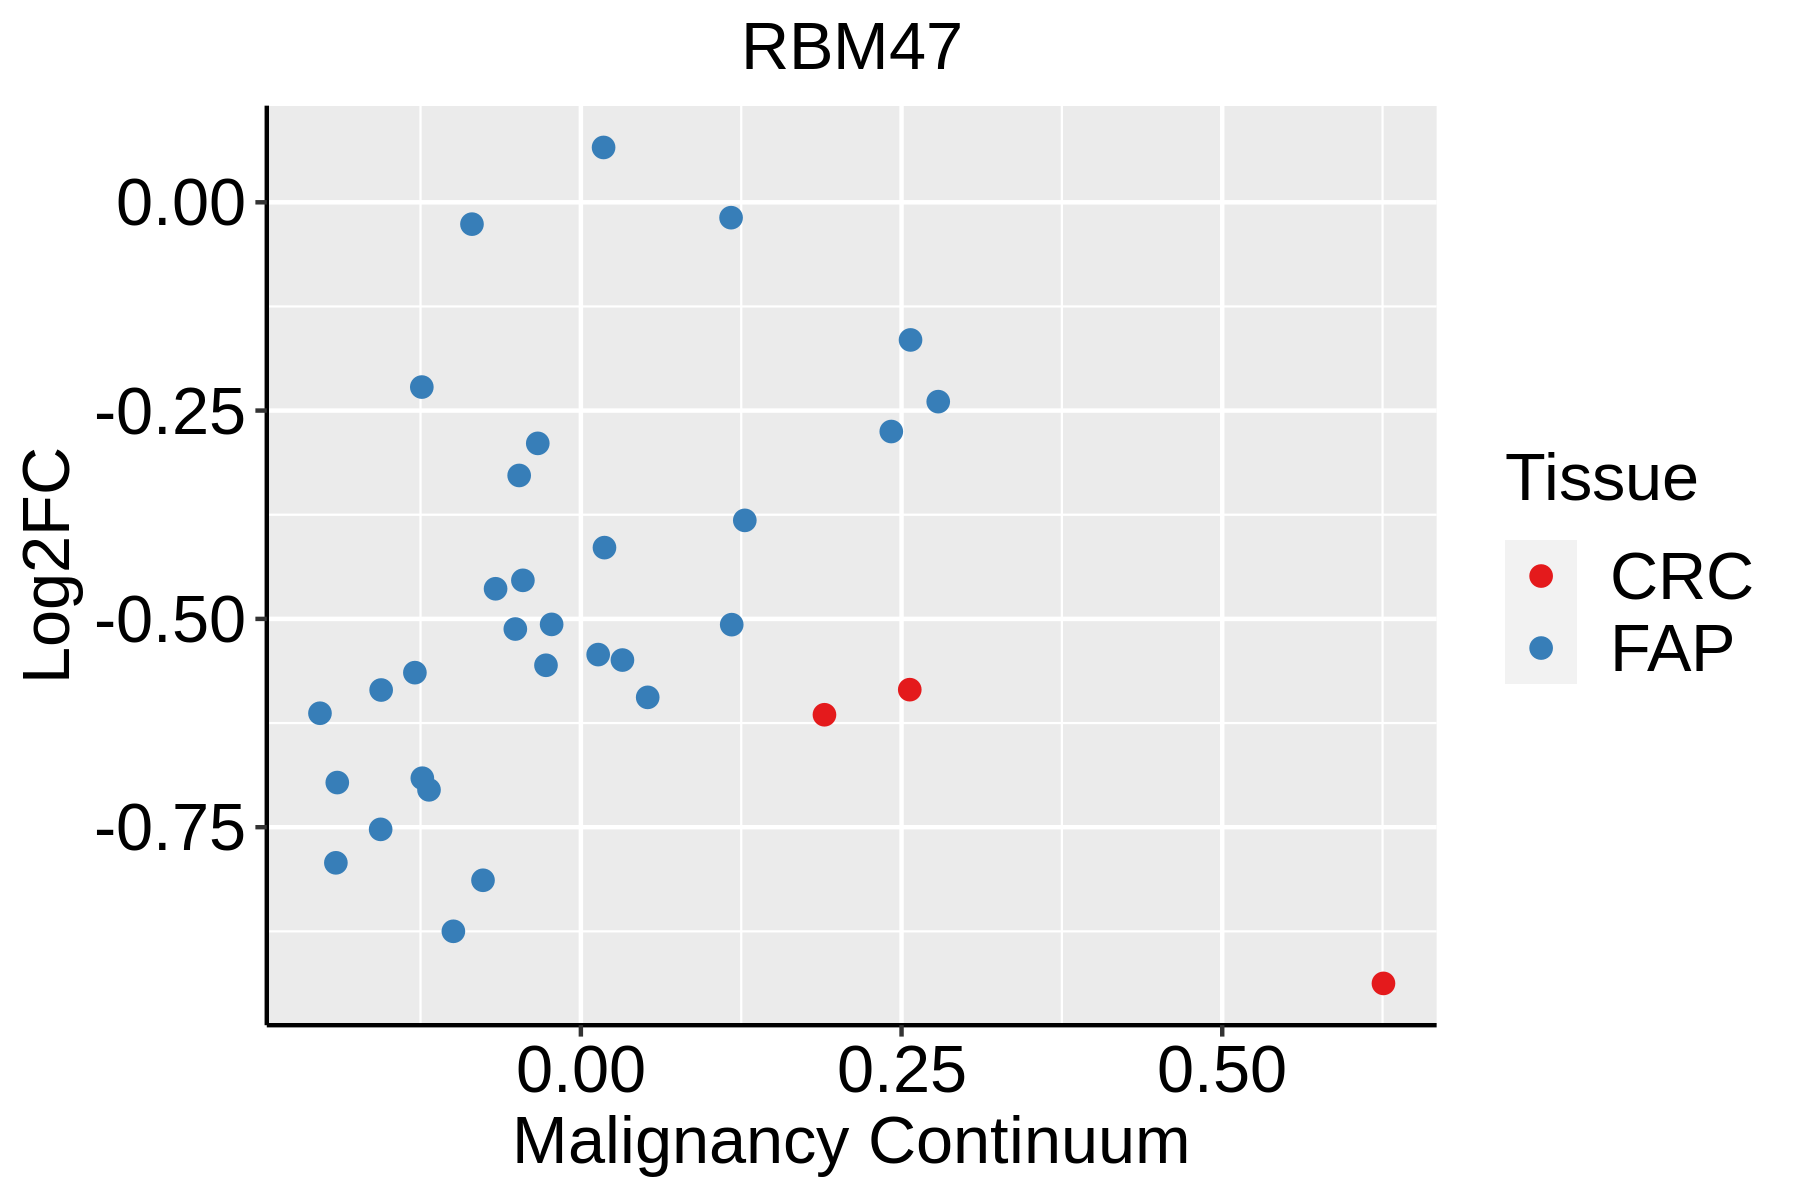
FAP: Familial adenomatous polyposis
CRC: Colorectal cancer
Colorectum (HTA11)The image shows the transcriptomic changes along malignancy continuum.log2FC in expression of this searched gene in stem-like cells from each diseased tissue sample relative to stem-like cells in normal samples in each tissue plotted against the malignancy continuum. Samples are colored based on if they are from different disease stage.AD: Adenomas
SER: Sessile serrated lesions
MSI-H: Microsatellite-high colorectal cancer
MSS: Microsatellite stable colorectal cancer
EndometriumThe image shows the transcriptomic changes along malignancy continuum.log2FC in expression of this searched gene in stem-like cells from each diseased tissue sample relative to stem-like cells in normal samples in each tissue plotted against the malignancy continuum. Samples are colored based on if they are from different disease stage.
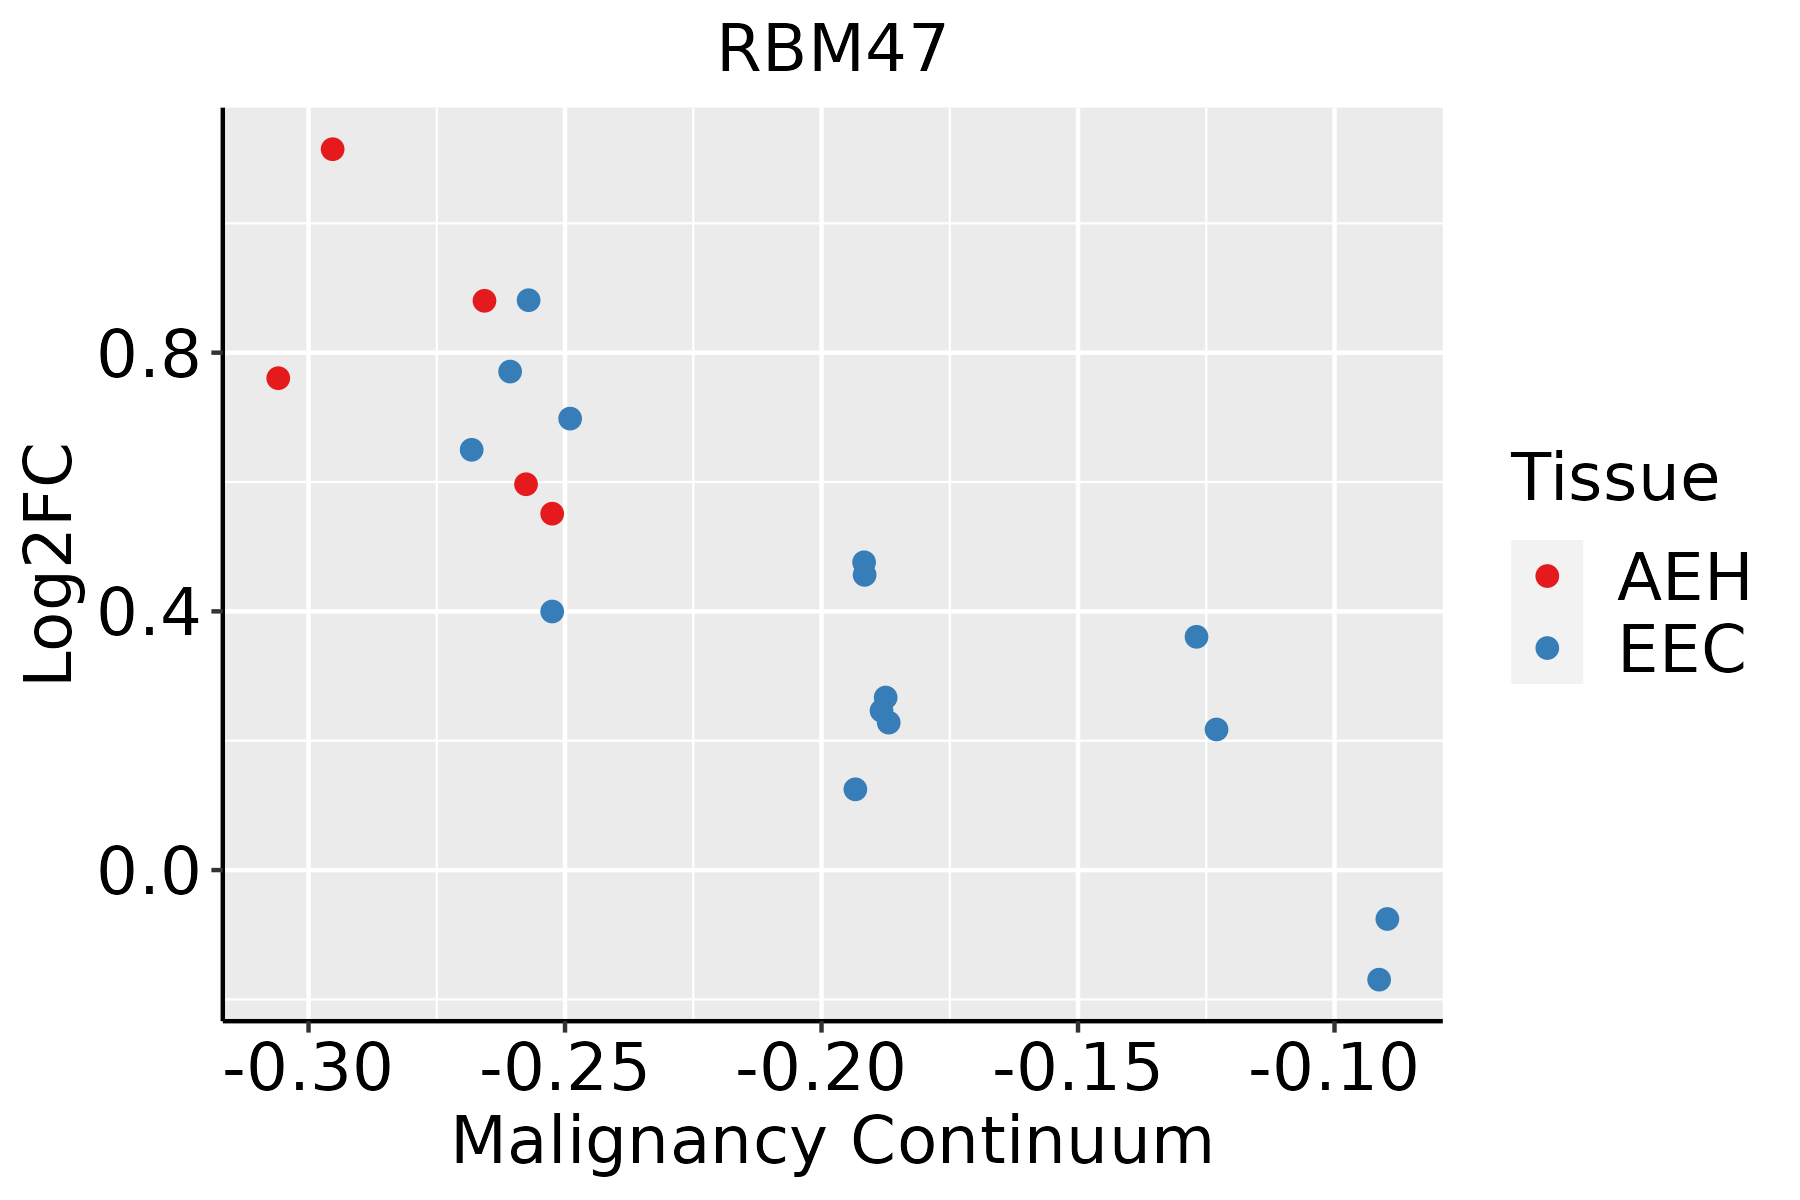
AEH: Atypical endometrial hyperplasia
EEC: Endometrioid Cancer
EsophagusThe image shows the transcriptomic changes along malignancy continuum.log2FC in expression of this searched gene in stem-like cells from each diseased tissue sample relative to stem-like cells in normal samples in each tissue plotted against the malignancy continuum. Samples are colored based on if they are from different disease stage.ESCC: Esophageal squamous cell carcinoma
HGIN: High-grade intraepithelial neoplasias
LGIN: Low-grade intraepithelial neoplasias
GCThe image shows the transcriptomic changes along malignancy continuum.log2FC in expression of this searched gene in stem-like cells from each diseased tissue sample relative to stem-like cells in normal samples in each tissue plotted against the malignancy continuum. Samples are colored based on if they are from different disease stage.CAG: Chronic atrophic gastritis
CAG with IM: Chronic atrophic gastritis with intestinal metaplasia
CSG: Chronic superficial gastritis
GC: Gastric cancer
SIM: Severe intestinal metaplasia
WIM: Wild intestinal metaplasia
LiverThe image shows the transcriptomic changes along malignancy continuum.log2FC in expression of this searched gene in stem-like cells from each diseased tissue sample relative to stem-like cells in normal samples in each tissue plotted against the malignancy continuum. Samples are colored based on if they are from different disease stage.
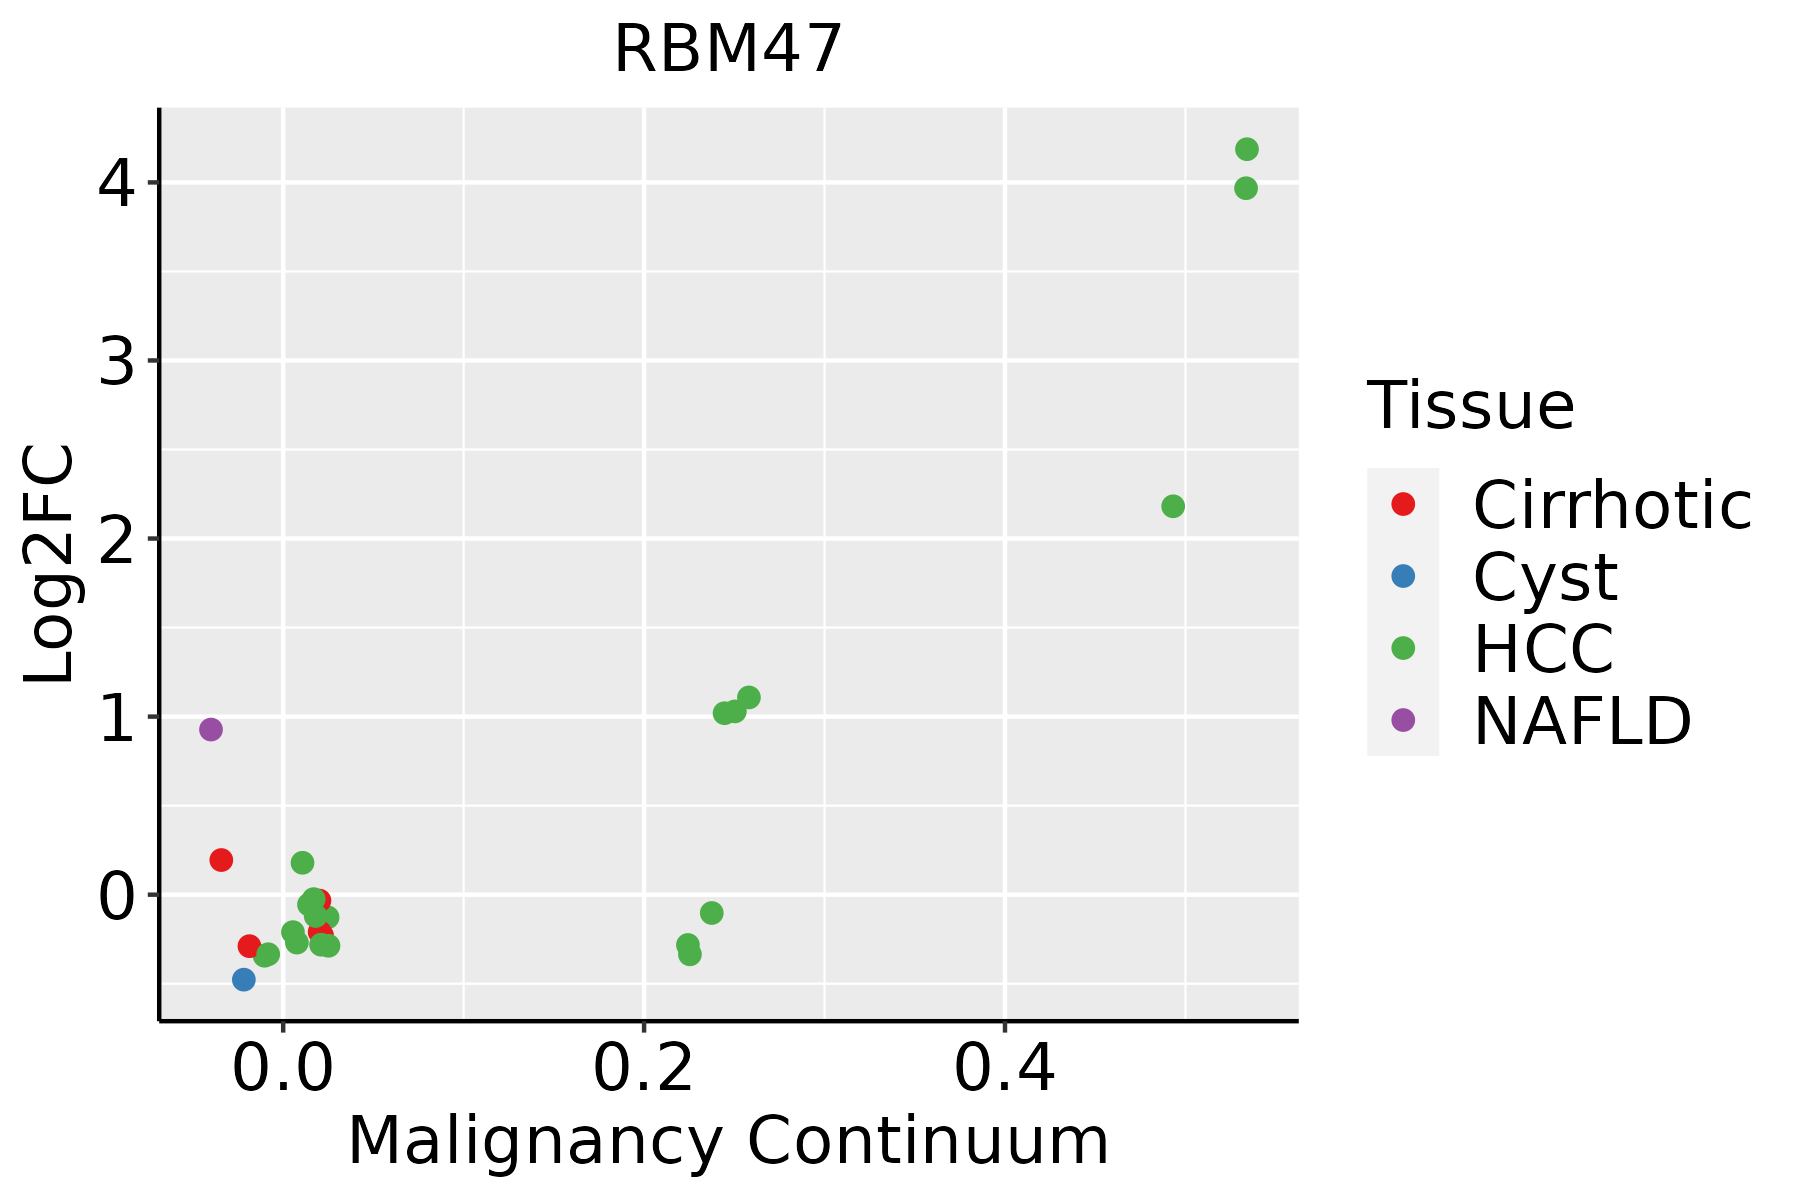
HCC: Hepatocellular carcinoma
NAFLD: Non-alcoholic fatty liver disease
LungThe image shows the transcriptomic changes along malignancy continuum.log2FC in expression of this searched gene in stem-like cells from each diseased tissue sample relative to stem-like cells in normal samples in each tissue plotted against the malignancy continuum. Samples are colored based on if they are from different disease stage.
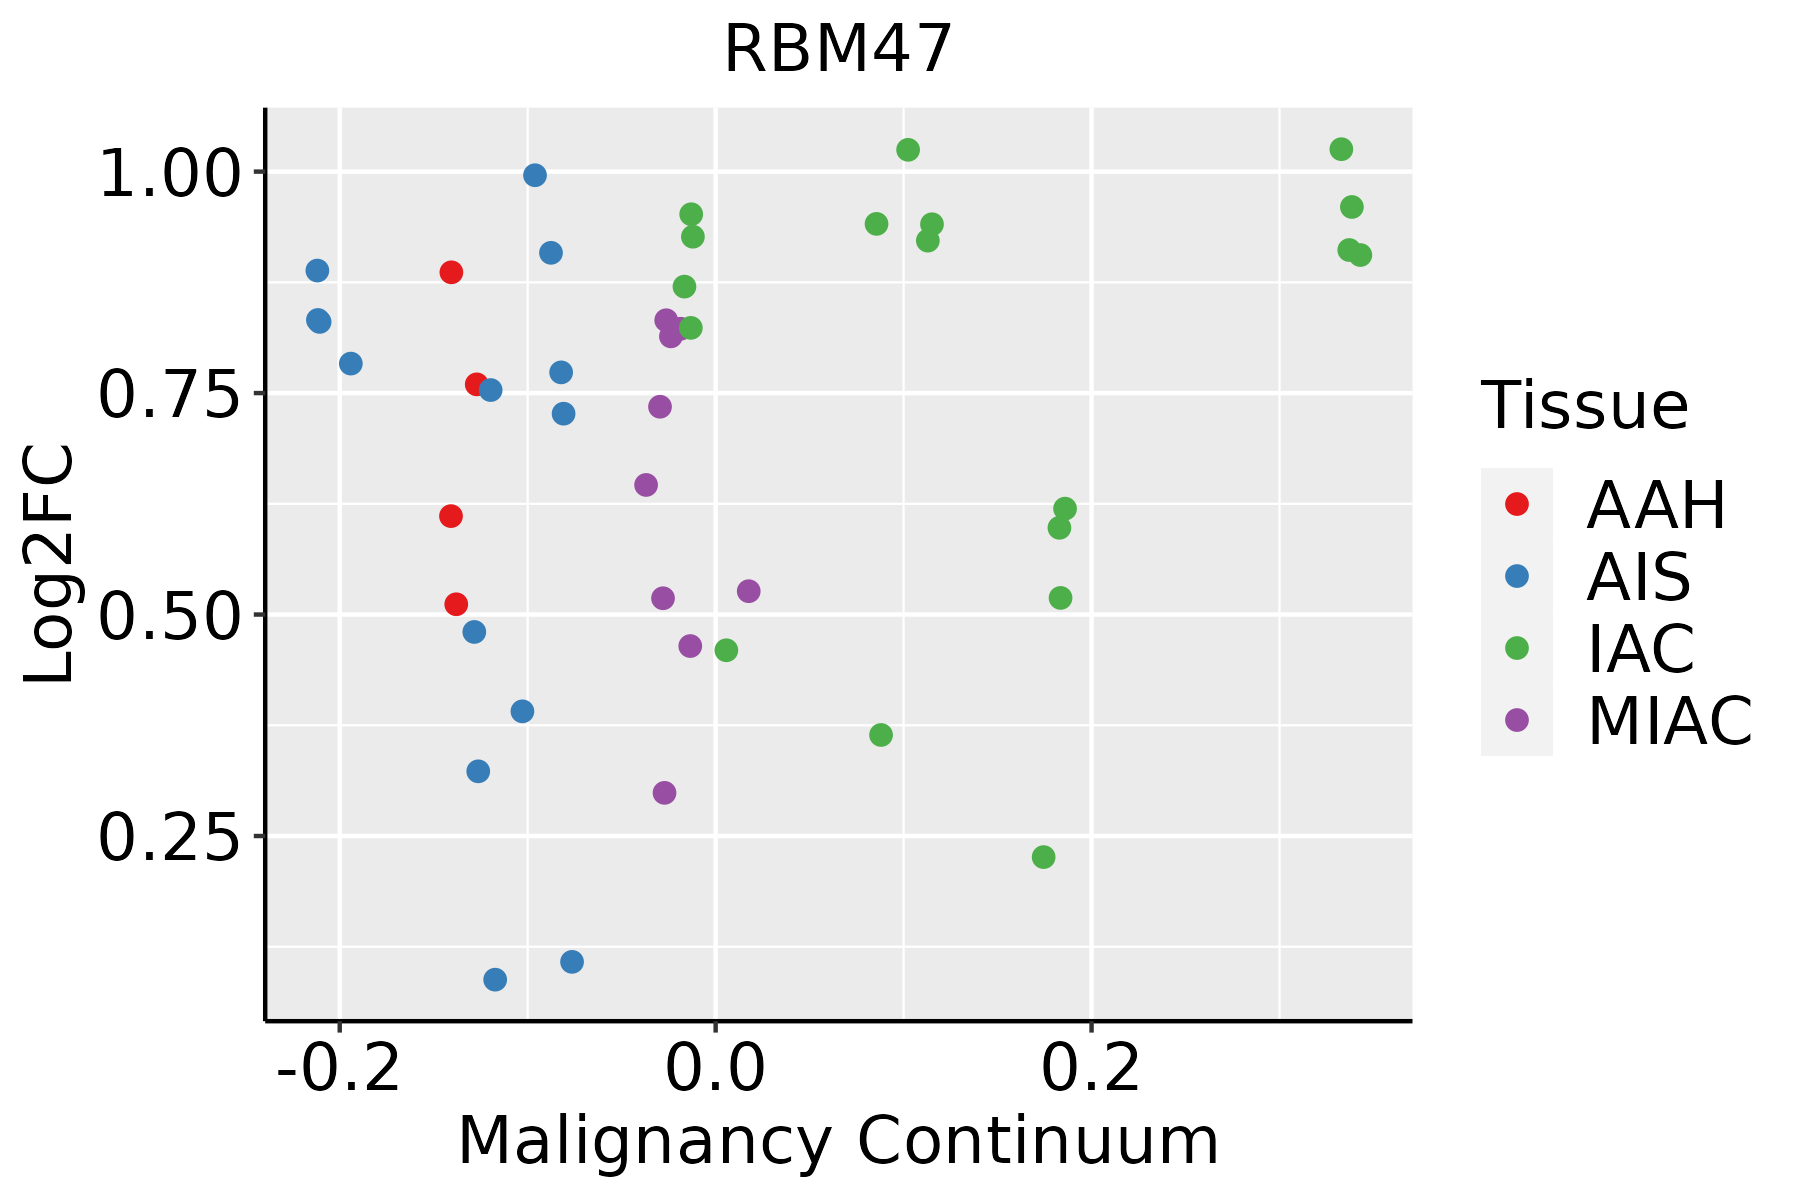
AAH: Atypical adenomatous hyperplasia
AIS: Adenocarcinoma in situ
IAC: Invasive lung adenocarcinoma
MIA: Minimally invasive adenocarcinoma
Oral CavityThe image shows the transcriptomic changes along malignancy continuum.log2FC in expression of this searched gene in stem-like cells from each diseased tissue sample relative to stem-like cells in normal samples in each tissue plotted against the malignancy continuum. Samples are colored based on if they are from different disease stage.
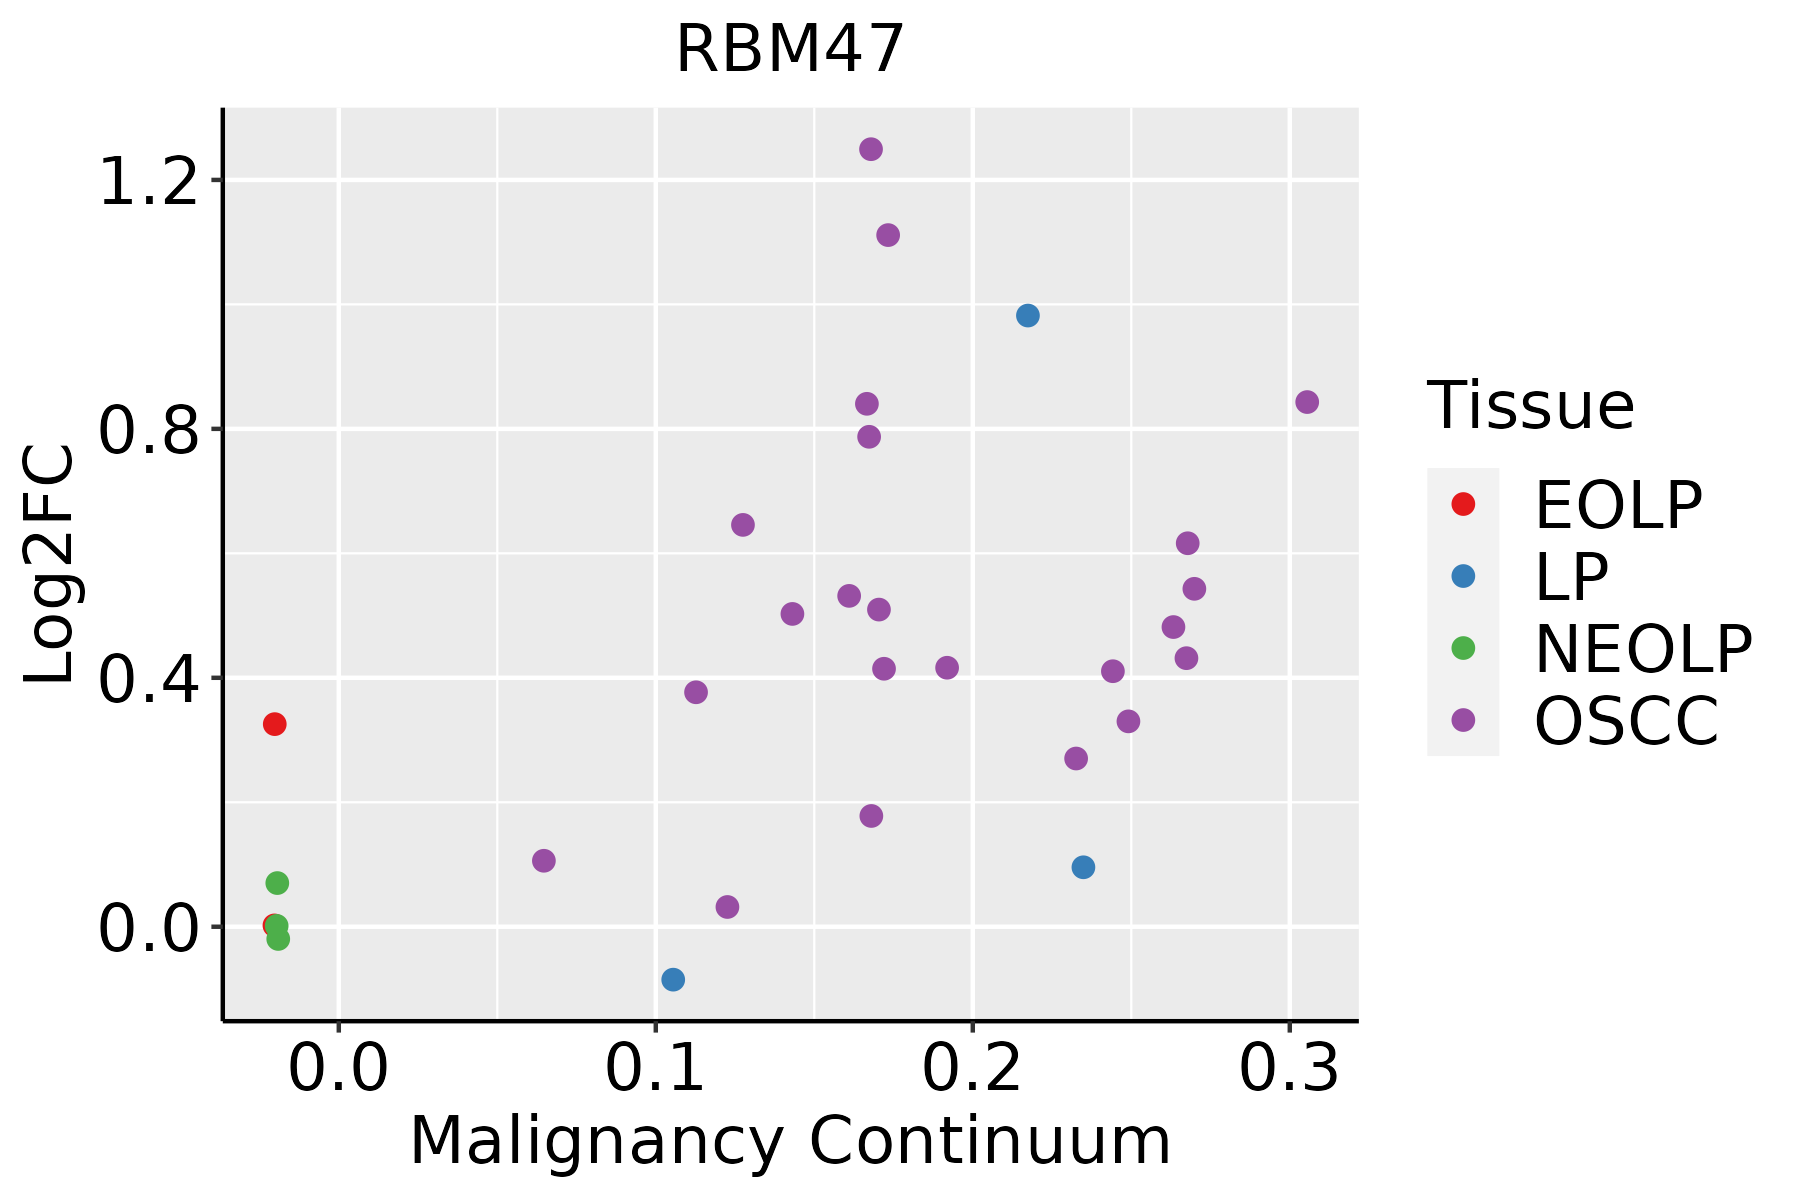
EOLP: Erosive Oral lichen planus
LP: leukoplakia
NEOLP: Non-erosive oral lichen planus
OSCC: Oral squamous cell carcinoma
ProstateThe image shows the transcriptomic changes along malignancy continuum.log2FC in expression of this searched gene in stem-like cells from each diseased tissue sample relative to stem-like cells in normal samples in each tissue plotted against the malignancy continuum. Samples are colored based on if they are from different disease stage.
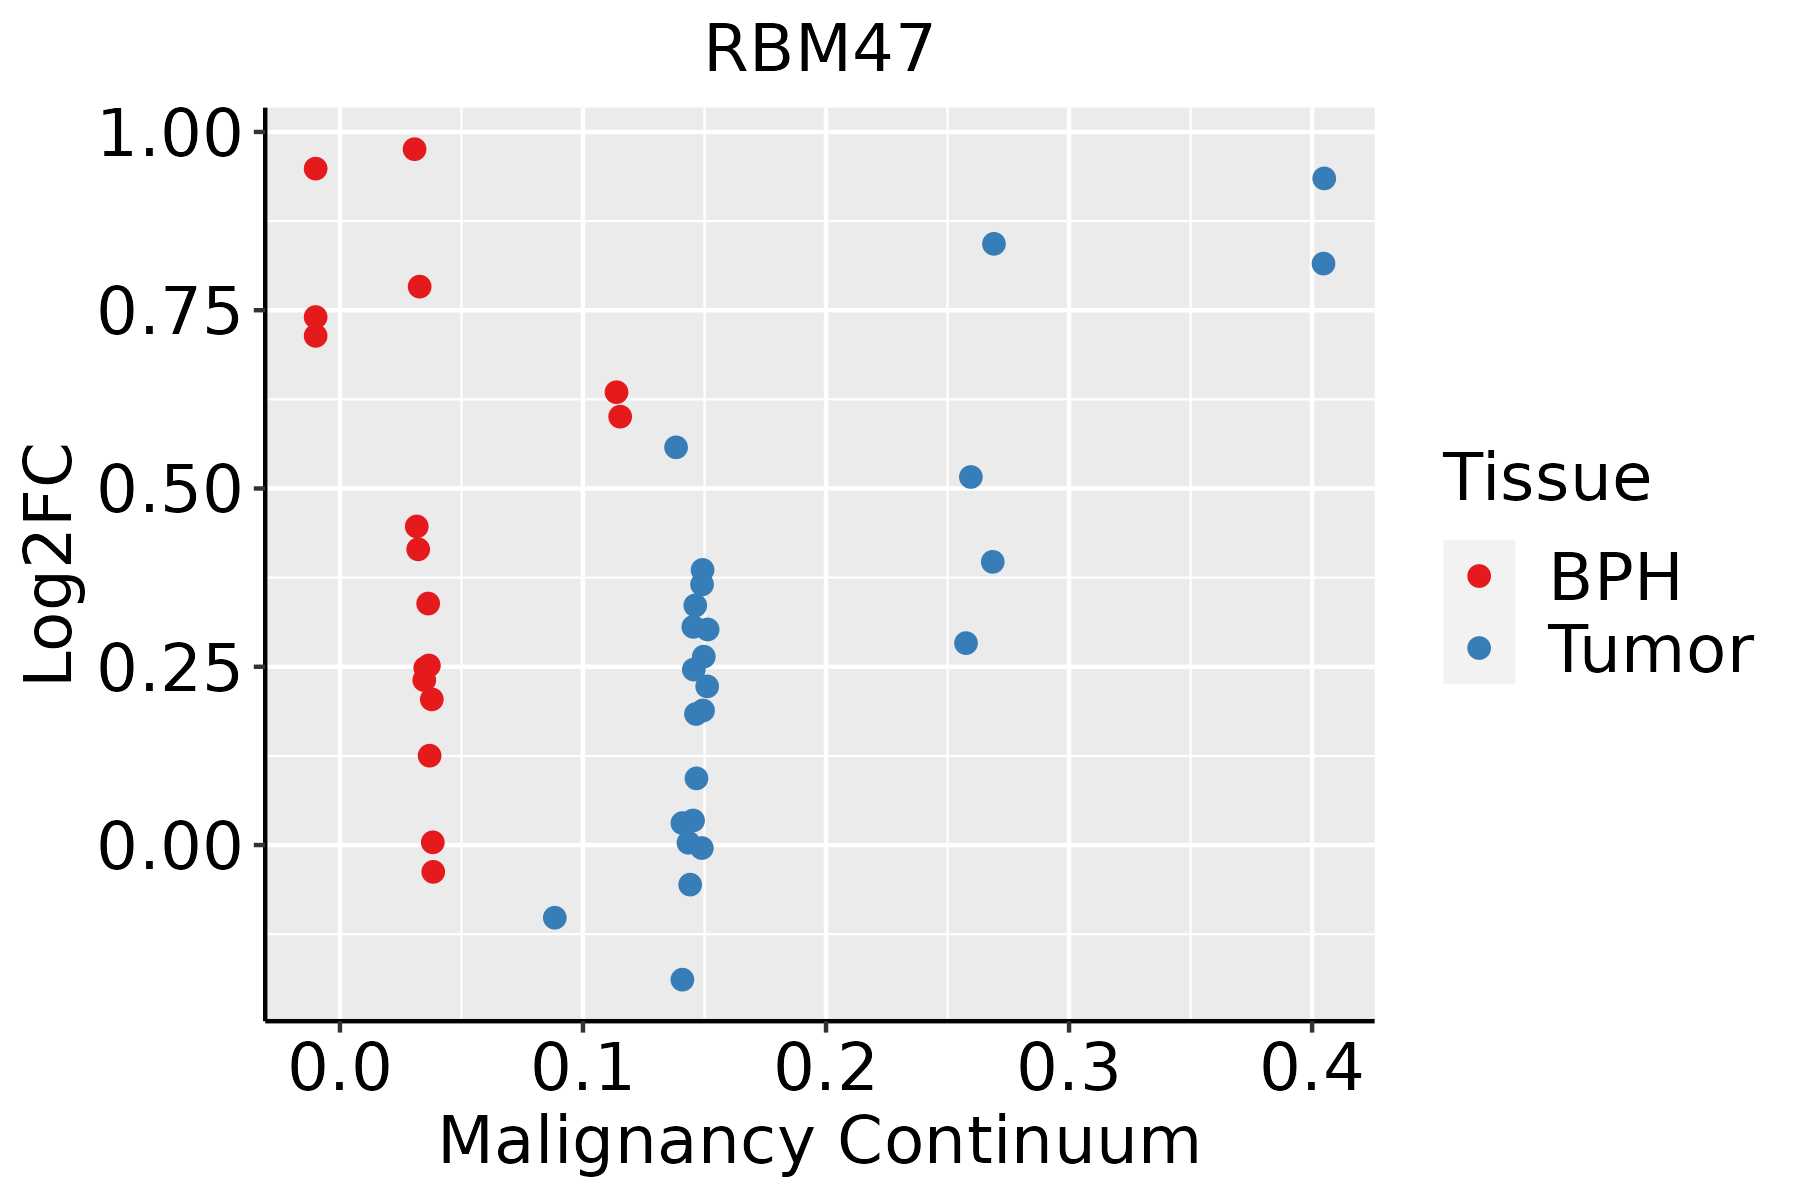
BPH: Benign Prostatic Hyperplasia
ThyroidThe image shows the transcriptomic changes along malignancy continuum.log2FC in expression of this searched gene in stem-like cells from each diseased tissue sample relative to stem-like cells in normal samples in each tissue plotted against the malignancy continuum. Samples are colored based on if they are from different disease stage.
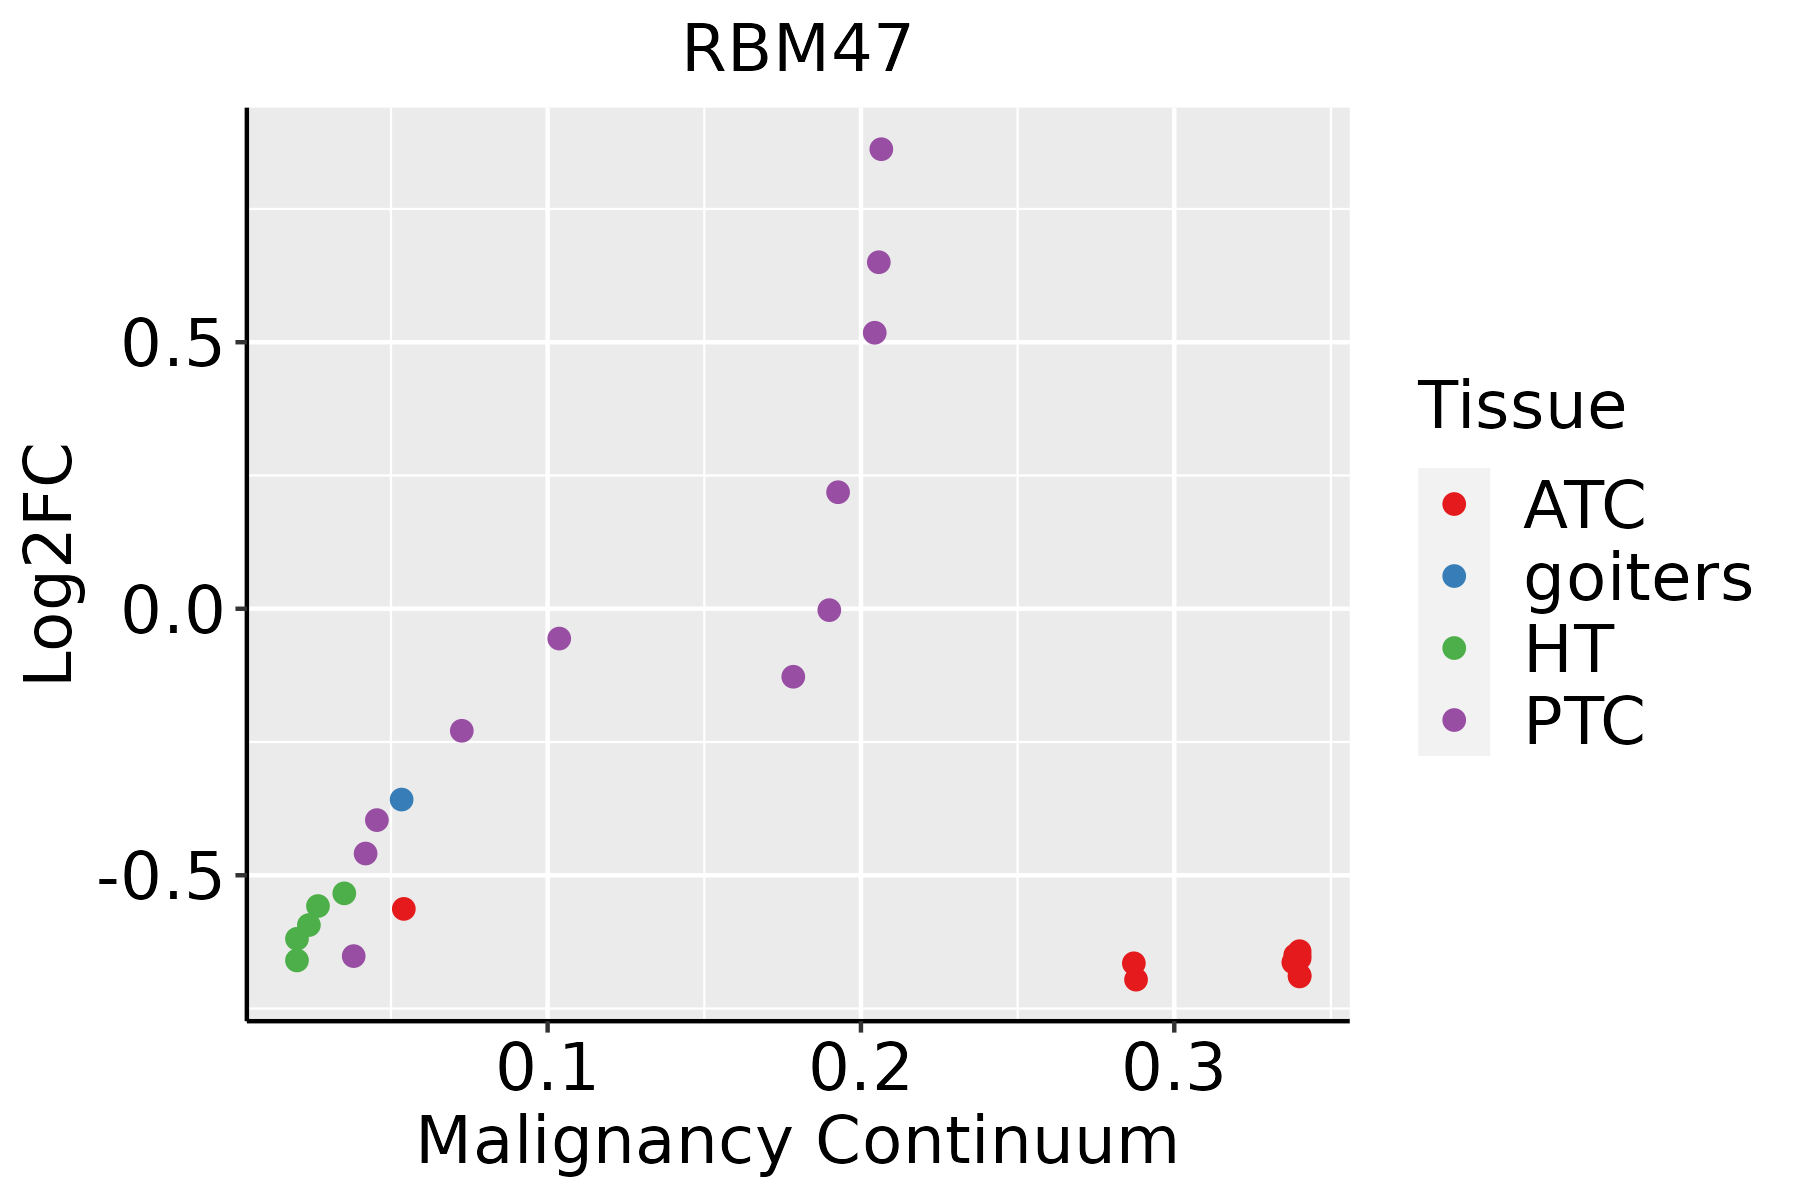
ATC: Anaplastic thyroid cancer
HT: Hashimoto's thyroiditis
PTC: Papillary thyroid cancer
∗log2FC in expression of this searched gene in stem-like cells from each diseased tissue sample relative to stem-like cells in normal samples in each tissue plotted against the malignancy continuum. Samples are colored based on if they are from different disease stage.

Top

Malignant transformation related pathway analysis

check buttonFind out the enriched GO biological processes and KEGG pathways involved in transition from healthy to precancer to cancer
check button Figure of enriched GO biological processes.
TissueDisease StageEnriched GO biological Processes
ColorectumADGO analysis - Figure of enriched GO biological processes: Top 15 enriched GO BP terms are showed in the bar plot of each disease state in each tissue. Each row represents a significant GO biological process which is colored according to the -log10(p.adjust).
ColorectumSERGO analysis - Figure of enriched GO biological processes: Top 15 enriched GO BP terms are showed in the bar plot of each disease state in each tissue. Each row represents a significant GO biological process which is colored according to the -log10(p.adjust).
ColorectumMSSGO analysis - Figure of enriched GO biological processes: Top 15 enriched GO BP terms are showed in the bar plot of each disease state in each tissue. Each row represents a significant GO biological process which is colored according to the -log10(p.adjust).
ColorectumMSI-HGO analysis - Figure of enriched GO biological processes: Top 15 enriched GO BP terms are showed in the bar plot of each disease state in each tissue. Each row represents a significant GO biological process which is colored according to the -log10(p.adjust).
ColorectumFAPGO analysis - Figure of enriched GO biological processes: Top 15 enriched GO BP terms are showed in the bar plot of each disease state in each tissue. Each row represents a significant GO biological process which is colored according to the -log10(p.adjust).
∗Top 15 enriched GO BP terms are showed in the bar plot of each disease state in each tissue. Each row represents a significant GO biological process which is colored according to the -log10(p.adjust).
Page: 1 2 3 4 5 6 7 8 9 

check button Enriched GO biological processes.
GO IDTissueDisease StageDescriptionGene RatioBg Ratiopvaluep.adjustCount
GO:00022443CervixCChematopoietic progenitor cell differentiation26/2311114/187231.30e-031.03e-0226
GO:0002244ColorectumMSShematopoietic progenitor cell differentiation32/3467114/187238.07e-034.91e-0232
GO:00022441ColorectumFAPhematopoietic progenitor cell differentiation29/2622114/187238.35e-048.71e-0329
GO:00022442ColorectumCRChematopoietic progenitor cell differentiation23/2078114/187233.20e-032.79e-0223
GO:00094512EsophagusESCCRNA modification114/8552167/187232.76e-096.04e-08114
GO:00022446EsophagusESCChematopoietic progenitor cell differentiation66/8552114/187235.74e-032.13e-0266
GO:0009451LiverHCCRNA modification101/7958167/187232.02e-062.78e-05101
GO:00094511Oral cavityOSCCRNA modification95/7305167/187232.05e-062.62e-0595
GO:00022445Oral cavityOSCChematopoietic progenitor cell differentiation57/7305114/187231.09e-023.71e-0257
GO:00022444ProstateBPHhematopoietic progenitor cell differentiation34/3107114/187233.08e-042.37e-0334
GO:000224411ProstateTumorhematopoietic progenitor cell differentiation34/3246114/187237.00e-044.92e-0334
GO:00022448ThyroidATChematopoietic progenitor cell differentiation51/6293114/187238.62e-033.28e-0251
Page: 1 

check button Enriched KEGG pathways.
Pathway IDTissueDisease StageDescriptionGene RatioBg Ratiopvaluep.adjustqvalueCount
Page: 1 

Top

Cell-cell communication analysis

check buttonIdentification of potential cell-cell interactions between two cell types and their ligand-receptor pairs for different disease states
LigandReceptorLRpairPathwayTissueDisease Stage
Page: 1 

Top

Single-cell gene regulatory network inference analysis

check buttonFind out the significant the regulons (TFs) and the target genes of each regulon across cell types for different disease states
TFCell TypeTissueDisease StageTarget GeneRSSRegulon Activity
∗The dot plots of a searched regulon are shown for all cell subpopulations in each disease state of each tissue based on the regulon specific score inferred using pySCENIC and by calculating the average expression.
Page: 1 

Top

Somatic mutation of malignant transformation related genes

check buttonAnnotation of somatic variants for genes involved in malignant transformation
Hugo SymbolVariant ClassVariant ClassificationdbSNP RSHGVScHGVSpHGVSp ShortSWISSPROTBIOTYPESIFTPolyPhenTumor Sample BarcodeTissueHistologySexAgeStageTherapy TypesDrugsOutcome
RBM47SNVMissense_Mutationc.1732N>Ap.Pro578Thrp.P578TA0AV96protein_codingdeleterious_low_confidence(0)probably_damaging(0.915)TCGA-A8-A08R-01Breastbreast invasive carcinomaFemale<65I/IIUnknownUnknownSD
RBM47SNVMissense_Mutationnovelc.710N>Ap.Val237Glup.V237EA0AV96protein_codingdeleterious(0)possibly_damaging(0.826)TCGA-A8-A09E-01Breastbreast invasive carcinomaFemale>=65III/IVHormone TherapyanastrozoleSD
RBM47SNVMissense_Mutationnovelc.855N>Ap.Phe285Leup.F285LA0AV96protein_codingdeleterious(0)probably_damaging(0.922)TCGA-C8-A273-01Breastbreast invasive carcinomaFemale<65I/IIHormone TherapytamoxiphenSD
RBM47SNVMissense_Mutationc.883G>Ap.Val295Metp.V295MA0AV96protein_codingtolerated(0.05)benign(0.108)TCGA-D8-A27G-01Breastbreast invasive carcinomaFemale>=65I/IIUnknownUnknownSD
RBM47insertionNonsense_Mutationnovelc.660_661insTAGTCCp.Gln220_Leu221insTerp.Q220_L221ins*A0AV96protein_codingTCGA-A2-A0CX-01Breastbreast invasive carcinomaFemale<65I/IIChemotherapyadriamycinSD
RBM47insertionFrame_Shift_Insnovelc.130_131insTp.Tyr44LeufsTer64p.Y44Lfs*64A0AV96protein_codingTCGA-A2-A0T2-01Breastbreast invasive carcinomaFemale>=65III/IVChemotherapyxelodaPD
RBM47insertionNonsense_Mutationnovelc.660_661insTAGTCCp.Gln220_Leu221insTerp.Q220_L221ins*A0AV96protein_codingTCGA-A8-A08T-01Breastbreast invasive carcinomaFemale<65III/IVUnknownUnknownPD
RBM47insertionFrame_Shift_Insnovelc.811_812insAGAAGGCAGCp.Pro271GlnfsTer38p.P271Qfs*38A0AV96protein_codingTCGA-BH-A0B1-01Breastbreast invasive carcinomaFemale>=65I/IIChemotherapyadriamycinSD
RBM47deletionFrame_Shift_Delc.1761delNp.Asp588ThrfsTer21p.D588Tfs*21A0AV96protein_codingTCGA-D8-A27V-01Breastbreast invasive carcinomaFemale<65I/IIHormone TherapytamoxiphenSD
RBM47deletionFrame_Shift_Delnovelc.1184delNp.Gly395ValfsTer50p.G395Vfs*50A0AV96protein_codingTCGA-D8-A27V-01Breastbreast invasive carcinomaFemale<65I/IIHormone TherapytamoxiphenSD
Page: 1 2 3 4 5 6 7 8 

Top

Related drugs of malignant transformation related genes

check buttonIdentification of chemicals and drugs interact with genes involved in malignant transfromation
(DGIdb 4.0)
Entrez IDSymbolCategoryInteraction TypesDrug Claim NameDrug NamePMIDs
Page: 1