
|
|||||
|
 | |
| |
| |
| |
| |
| |
|
Gene: RBBP9 |
Gene summary for RBBP9 |
| Gene information | Species | Human | Gene symbol | RBBP9 | Gene ID | 10741 |
| Gene name | RB binding protein 9, serine hydrolase | |
| Gene Alias | BOG | |
| Cytomap | 20p11.23 | |
| Gene Type | protein-coding | GO ID | GO:0008150 | UniProtAcc | O75884 |
Top |
Malignant transformation analysis |
| Identification of the aberrant gene expression in precancerous and cancerous lesions by comparing the gene expression of stem-like cells in diseased tissues with normal stem cells |
| Entrez ID | Symbol | Replicates | Species | Organ | Tissue | Adj P-value | Log2FC | Malignancy |
| 10741 | RBBP9 | P30T-E | Human | Esophagus | ESCC | 8.10e-13 | 5.18e-01 | 0.137 |
| 10741 | RBBP9 | P31T-E | Human | Esophagus | ESCC | 7.66e-06 | 1.65e-01 | 0.1251 |
| 10741 | RBBP9 | P32T-E | Human | Esophagus | ESCC | 5.46e-14 | 1.62e-01 | 0.1666 |
| 10741 | RBBP9 | P36T-E | Human | Esophagus | ESCC | 1.86e-05 | 2.71e-01 | 0.1187 |
| 10741 | RBBP9 | P37T-E | Human | Esophagus | ESCC | 2.65e-05 | 7.79e-02 | 0.1371 |
| 10741 | RBBP9 | P42T-E | Human | Esophagus | ESCC | 3.04e-04 | 7.87e-02 | 0.1175 |
| 10741 | RBBP9 | P44T-E | Human | Esophagus | ESCC | 1.42e-03 | 1.08e-01 | 0.1096 |
| 10741 | RBBP9 | P48T-E | Human | Esophagus | ESCC | 5.07e-06 | 5.46e-02 | 0.0959 |
| 10741 | RBBP9 | P52T-E | Human | Esophagus | ESCC | 3.69e-06 | 1.35e-01 | 0.1555 |
| 10741 | RBBP9 | P54T-E | Human | Esophagus | ESCC | 5.09e-06 | 1.34e-01 | 0.0975 |
| 10741 | RBBP9 | P56T-E | Human | Esophagus | ESCC | 4.34e-07 | 5.37e-01 | 0.1613 |
| 10741 | RBBP9 | P57T-E | Human | Esophagus | ESCC | 2.20e-07 | 1.77e-01 | 0.0926 |
| 10741 | RBBP9 | P61T-E | Human | Esophagus | ESCC | 9.36e-07 | 1.43e-01 | 0.099 |
| 10741 | RBBP9 | P62T-E | Human | Esophagus | ESCC | 7.28e-13 | 2.37e-01 | 0.1302 |
| 10741 | RBBP9 | P65T-E | Human | Esophagus | ESCC | 2.30e-05 | 1.40e-01 | 0.0978 |
| 10741 | RBBP9 | P74T-E | Human | Esophagus | ESCC | 3.50e-12 | 2.55e-01 | 0.1479 |
| 10741 | RBBP9 | P75T-E | Human | Esophagus | ESCC | 6.71e-03 | 8.76e-02 | 0.1125 |
| 10741 | RBBP9 | P76T-E | Human | Esophagus | ESCC | 3.65e-06 | 1.08e-01 | 0.1207 |
| 10741 | RBBP9 | P79T-E | Human | Esophagus | ESCC | 5.74e-07 | 1.75e-01 | 0.1154 |
| 10741 | RBBP9 | P80T-E | Human | Esophagus | ESCC | 7.16e-10 | 2.41e-01 | 0.155 |
| Page: 1 2 3 |
| Tissue | Expression Dynamics | Abbreviation |
| Esophagus | 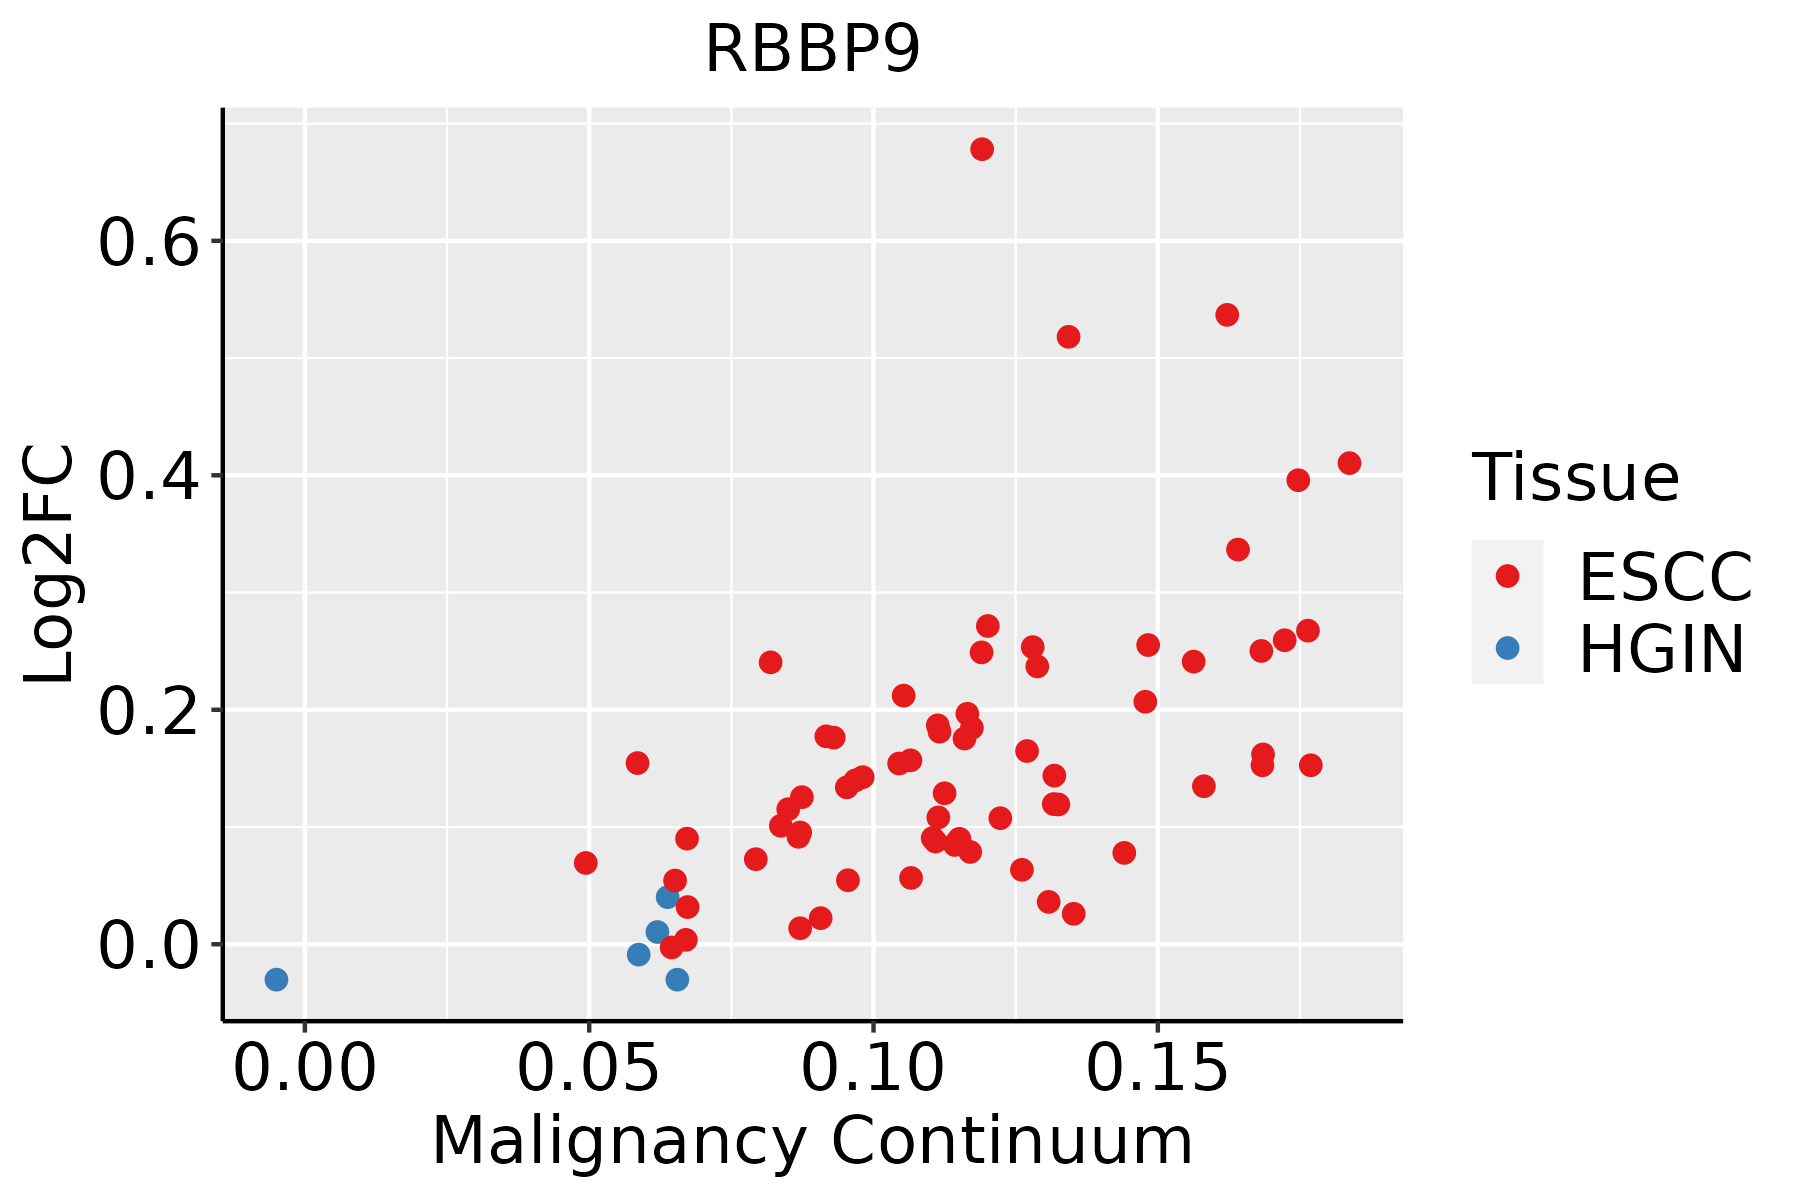 | ESCC: Esophageal squamous cell carcinoma |
| HGIN: High-grade intraepithelial neoplasias | ||
| LGIN: Low-grade intraepithelial neoplasias | ||
| Liver |  | HCC: Hepatocellular carcinoma |
| NAFLD: Non-alcoholic fatty liver disease |
| ∗log2FC in expression of this searched gene in stem-like cells from each diseased tissue sample relative to stem-like cells in normal samples in each tissue plotted against the malignancy continuum. Samples are colored based on if they are from different disease stage. |
Top |
Malignant transformation related pathway analysis |
| Find out the enriched GO biological processes and KEGG pathways involved in transition from healthy to precancer to cancer |
| Tissue | Disease Stage | Enriched GO biological Processes |
| Colorectum | AD |  |
| Colorectum | SER |  |
| Colorectum | MSS |  |
| Colorectum | MSI-H |  |
| Colorectum | FAP |  |
| ∗Top 15 enriched GO BP terms are showed in the bar plot of each disease state in each tissue. Each row represents a significant GO biological process which is colored according to the -log10(p.adjust). |
| Page: 1 2 3 4 5 6 7 8 9 |
| GO ID | Tissue | Disease Stage | Description | Gene Ratio | Bg Ratio | pvalue | p.adjust | Count |
| Page: 1 |
| Pathway ID | Tissue | Disease Stage | Description | Gene Ratio | Bg Ratio | pvalue | p.adjust | qvalue | Count |
| Page: 1 |
Top |
Cell-cell communication analysis |
| Identification of potential cell-cell interactions between two cell types and their ligand-receptor pairs for different disease states |
| Ligand | Receptor | LRpair | Pathway | Tissue | Disease Stage |
| Page: 1 |
Top |
Single-cell gene regulatory network inference analysis |
| Find out the significant the regulons (TFs) and the target genes of each regulon across cell types for different disease states |
| TF | Cell Type | Tissue | Disease Stage | Target Gene | RSS | Regulon Activity |
| ∗The dot plots of a searched regulon are shown for all cell subpopulations in each disease state of each tissue based on the regulon specific score inferred using pySCENIC and by calculating the average expression. |
| Page: 1 |
Top |
Somatic mutation of malignant transformation related genes |
| Annotation of somatic variants for genes involved in malignant transformation |
| Hugo Symbol | Variant Class | Variant Classification | dbSNP RS | HGVSc | HGVSp | HGVSp Short | SWISSPROT | BIOTYPE | SIFT | PolyPhen | Tumor Sample Barcode | Tissue | Histology | Sex | Age | Stage | Therapy Types | Drugs | Outcome |
| RBBP9 | SNV | Missense_Mutation | c.192N>G | p.His64Gln | p.H64Q | O75884 | protein_coding | tolerated(0.5) | benign(0) | TCGA-A2-A04P-01 | Breast | breast invasive carcinoma | Female | <65 | III/IV | Chemotherapy | taxol | PD | |
| RBBP9 | SNV | Missense_Mutation | c.242C>A | p.Ala81Asp | p.A81D | O75884 | protein_coding | deleterious(0.02) | probably_damaging(0.983) | TCGA-AO-A03O-01 | Breast | breast invasive carcinoma | Female | >=65 | I/II | Chemotherapy | doxorubicin | SD | |
| RBBP9 | SNV | Missense_Mutation | c.227N>T | p.Ser76Phe | p.S76F | O75884 | protein_coding | deleterious(0) | probably_damaging(1) | TCGA-C5-A8XJ-01 | Cervix | cervical & endocervical cancer | Female | >=65 | I/II | Chemotherapy | cisplatin | SD | |
| RBBP9 | SNV | Missense_Mutation | rs372324175 | c.326N>A | p.Arg109His | p.R109H | O75884 | protein_coding | deleterious(0.02) | benign(0.011) | TCGA-AA-3492-01 | Colorectum | colon adenocarcinoma | Female | >=65 | I/II | Unknown | Unknown | SD |
| RBBP9 | SNV | Missense_Mutation | novel | c.320A>T | p.Asn107Ile | p.N107I | O75884 | protein_coding | tolerated(0.12) | benign(0.26) | TCGA-AG-A00Y-01 | Colorectum | rectum adenocarcinoma | Male | >=65 | I/II | Unknown | Unknown | PD |
| RBBP9 | insertion | Frame_Shift_Ins | novel | c.458_459insATTCTACTCCTATATTG | p.Glu154PhefsTer27 | p.E154Ffs*27 | O75884 | protein_coding | TCGA-AM-5820-01 | Colorectum | colon adenocarcinoma | Female | <65 | I/II | Unknown | Unknown | SD | ||
| RBBP9 | SNV | Missense_Mutation | rs192424321 | c.266G>A | p.Arg89Gln | p.R89Q | O75884 | protein_coding | tolerated(0.33) | benign(0.001) | TCGA-AX-A2HC-01 | Endometrium | uterine corpus endometrioid carcinoma | Female | <65 | III/IV | Chemotherapy | paclitaxel | PD |
| RBBP9 | SNV | Missense_Mutation | rs748471993 | c.152G>A | p.Arg51Gln | p.R51Q | O75884 | protein_coding | deleterious(0.02) | benign(0.022) | TCGA-AX-A2HC-01 | Endometrium | uterine corpus endometrioid carcinoma | Female | <65 | III/IV | Chemotherapy | paclitaxel | PD |
| RBBP9 | SNV | Missense_Mutation | c.115T>C | p.Cys39Arg | p.C39R | O75884 | protein_coding | deleterious(0.01) | probably_damaging(0.999) | TCGA-D1-A0ZO-01 | Endometrium | uterine corpus endometrioid carcinoma | Female | >=65 | I/II | Unknown | Unknown | SD | |
| RBBP9 | SNV | Missense_Mutation | novel | c.198N>A | p.Asp66Glu | p.D66E | O75884 | protein_coding | deleterious(0) | possibly_damaging(0.841) | TCGA-D1-A175-01 | Endometrium | uterine corpus endometrioid carcinoma | Female | <65 | I/II | Chemotherapy | paclitaxel | SD |
| Page: 1 2 |
Top |
Related drugs of malignant transformation related genes |
| Identification of chemicals and drugs interact with genes involved in malignant transfromation |
| (DGIdb 4.0) |
| Entrez ID | Symbol | Category | Interaction Types | Drug Claim Name | Drug Name | PMIDs |
| 10741 | RBBP9 | ENZYME, DRUGGABLE GENOME | inhibitor | 252166808 |
| Page: 1 |

Copyright 2023-Present -The University of Texas Health Science Center at Houston |