
|
|||||
|
 | |
| |
| |
| |
| |
| |
|
Gene: RAP2C |
Gene summary for RAP2C |
| Gene information | Species | Human | Gene symbol | RAP2C | Gene ID | 57826 |
| Gene name | RAP2C, member of RAS oncogene family | |
| Gene Alias | RAP2C | |
| Cytomap | Xq26.2 | |
| Gene Type | protein-coding | GO ID | GO:0001885 | UniProtAcc | Q9Y3L5 |
Top |
Malignant transformation analysis |
| Identification of the aberrant gene expression in precancerous and cancerous lesions by comparing the gene expression of stem-like cells in diseased tissues with normal stem cells |
| Entrez ID | Symbol | Replicates | Species | Organ | Tissue | Adj P-value | Log2FC | Malignancy |
| 57826 | RAP2C | P24T-E | Human | Esophagus | ESCC | 5.25e-08 | 2.12e-01 | 0.1287 |
| 57826 | RAP2C | P26T-E | Human | Esophagus | ESCC | 9.47e-18 | 3.49e-01 | 0.1276 |
| 57826 | RAP2C | P27T-E | Human | Esophagus | ESCC | 3.05e-05 | 6.99e-02 | 0.1055 |
| 57826 | RAP2C | P28T-E | Human | Esophagus | ESCC | 1.05e-08 | 1.76e-01 | 0.1149 |
| 57826 | RAP2C | P30T-E | Human | Esophagus | ESCC | 1.11e-07 | 1.99e-01 | 0.137 |
| 57826 | RAP2C | P31T-E | Human | Esophagus | ESCC | 6.16e-04 | 1.26e-01 | 0.1251 |
| 57826 | RAP2C | P32T-E | Human | Esophagus | ESCC | 4.31e-15 | 2.06e-01 | 0.1666 |
| 57826 | RAP2C | P36T-E | Human | Esophagus | ESCC | 7.01e-08 | 3.29e-01 | 0.1187 |
| 57826 | RAP2C | P37T-E | Human | Esophagus | ESCC | 2.25e-10 | 2.24e-01 | 0.1371 |
| 57826 | RAP2C | P39T-E | Human | Esophagus | ESCC | 6.97e-15 | 3.16e-01 | 0.0894 |
| 57826 | RAP2C | P40T-E | Human | Esophagus | ESCC | 3.67e-03 | 1.13e-01 | 0.109 |
| 57826 | RAP2C | P42T-E | Human | Esophagus | ESCC | 3.92e-08 | 2.20e-01 | 0.1175 |
| 57826 | RAP2C | P44T-E | Human | Esophagus | ESCC | 2.26e-03 | 6.01e-02 | 0.1096 |
| 57826 | RAP2C | P47T-E | Human | Esophagus | ESCC | 1.43e-08 | 2.79e-01 | 0.1067 |
| 57826 | RAP2C | P48T-E | Human | Esophagus | ESCC | 1.52e-04 | 1.04e-01 | 0.0959 |
| 57826 | RAP2C | P49T-E | Human | Esophagus | ESCC | 1.35e-06 | 8.09e-01 | 0.1768 |
| 57826 | RAP2C | P52T-E | Human | Esophagus | ESCC | 9.82e-07 | 2.28e-01 | 0.1555 |
| 57826 | RAP2C | P54T-E | Human | Esophagus | ESCC | 6.65e-04 | 6.05e-02 | 0.0975 |
| 57826 | RAP2C | P57T-E | Human | Esophagus | ESCC | 7.31e-03 | 1.38e-01 | 0.0926 |
| 57826 | RAP2C | P61T-E | Human | Esophagus | ESCC | 4.95e-12 | 2.27e-01 | 0.099 |
| Page: 1 2 3 4 5 |
| Tissue | Expression Dynamics | Abbreviation |
| Esophagus |  | ESCC: Esophageal squamous cell carcinoma |
| HGIN: High-grade intraepithelial neoplasias | ||
| LGIN: Low-grade intraepithelial neoplasias | ||
| Liver | 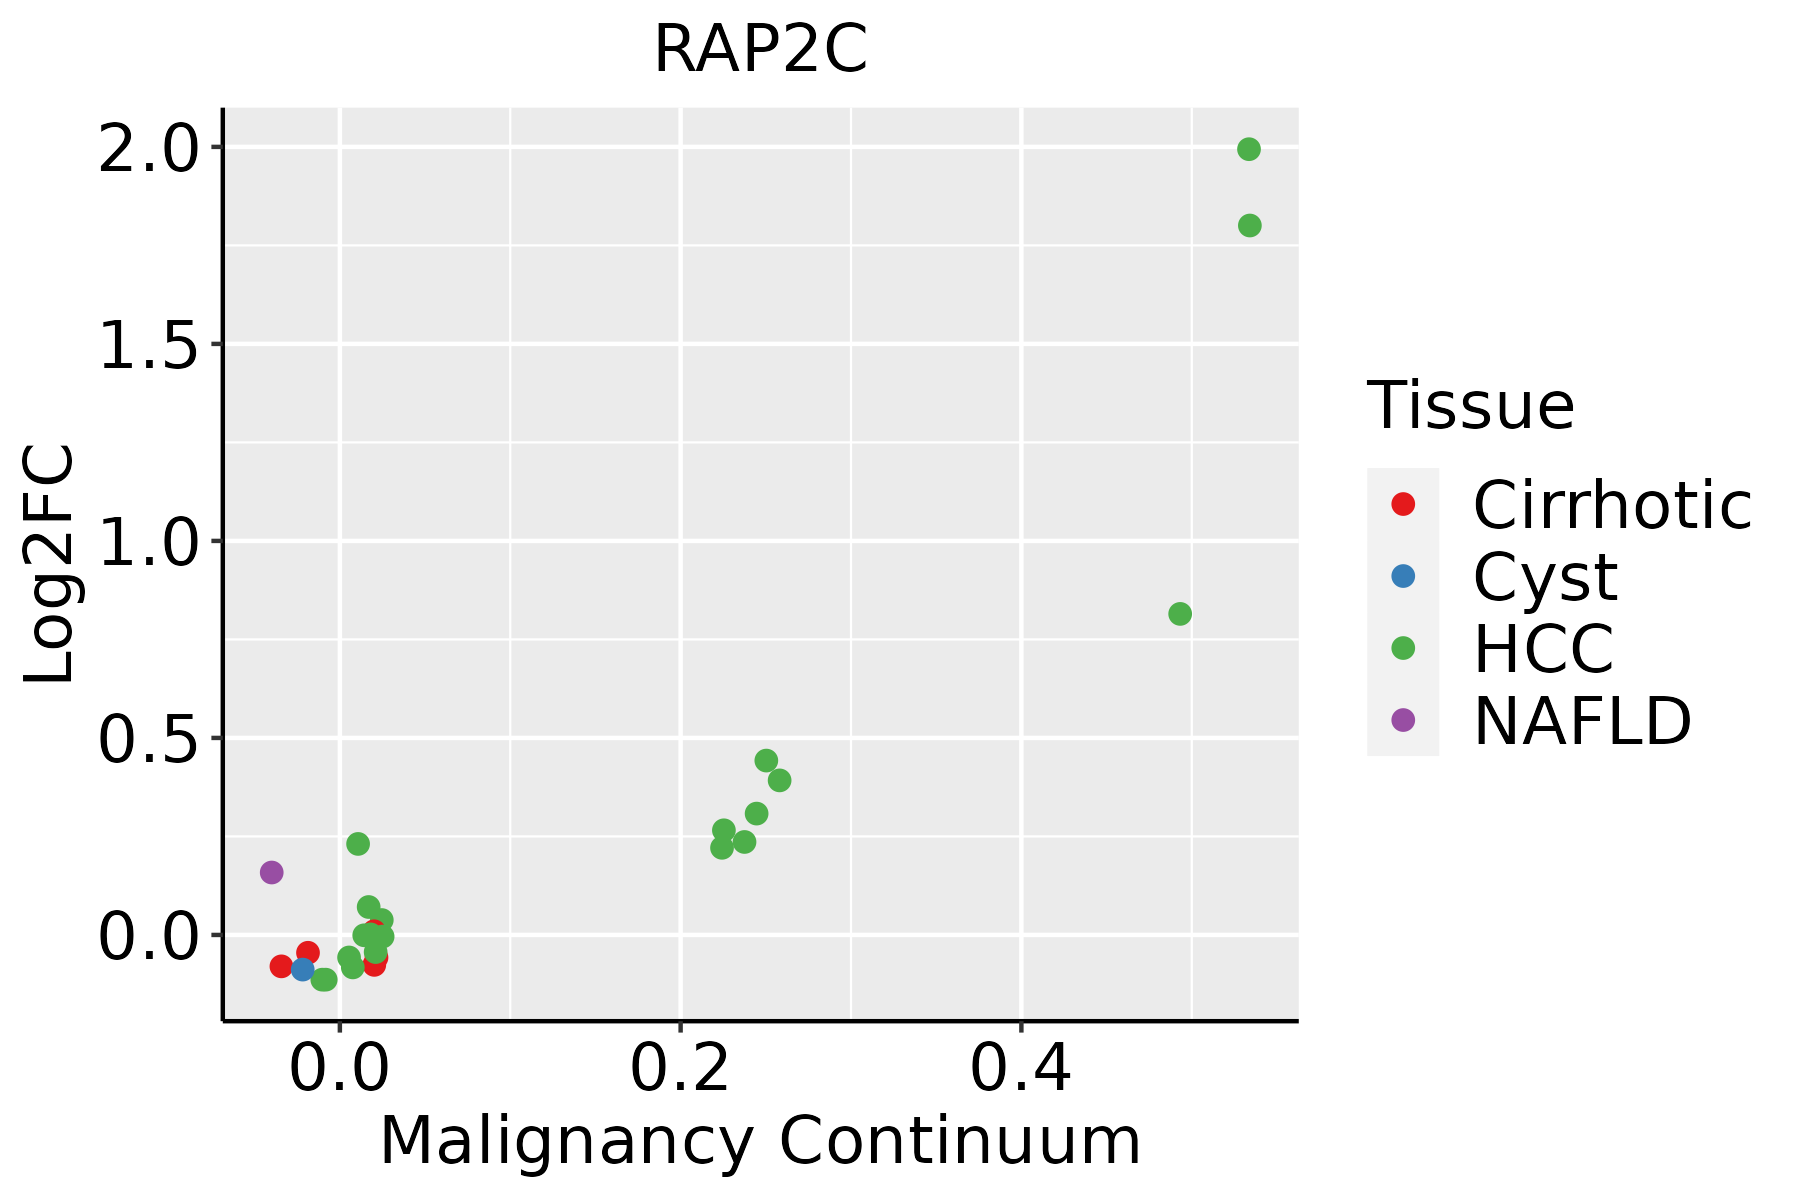 | HCC: Hepatocellular carcinoma |
| NAFLD: Non-alcoholic fatty liver disease | ||
| Oral Cavity | 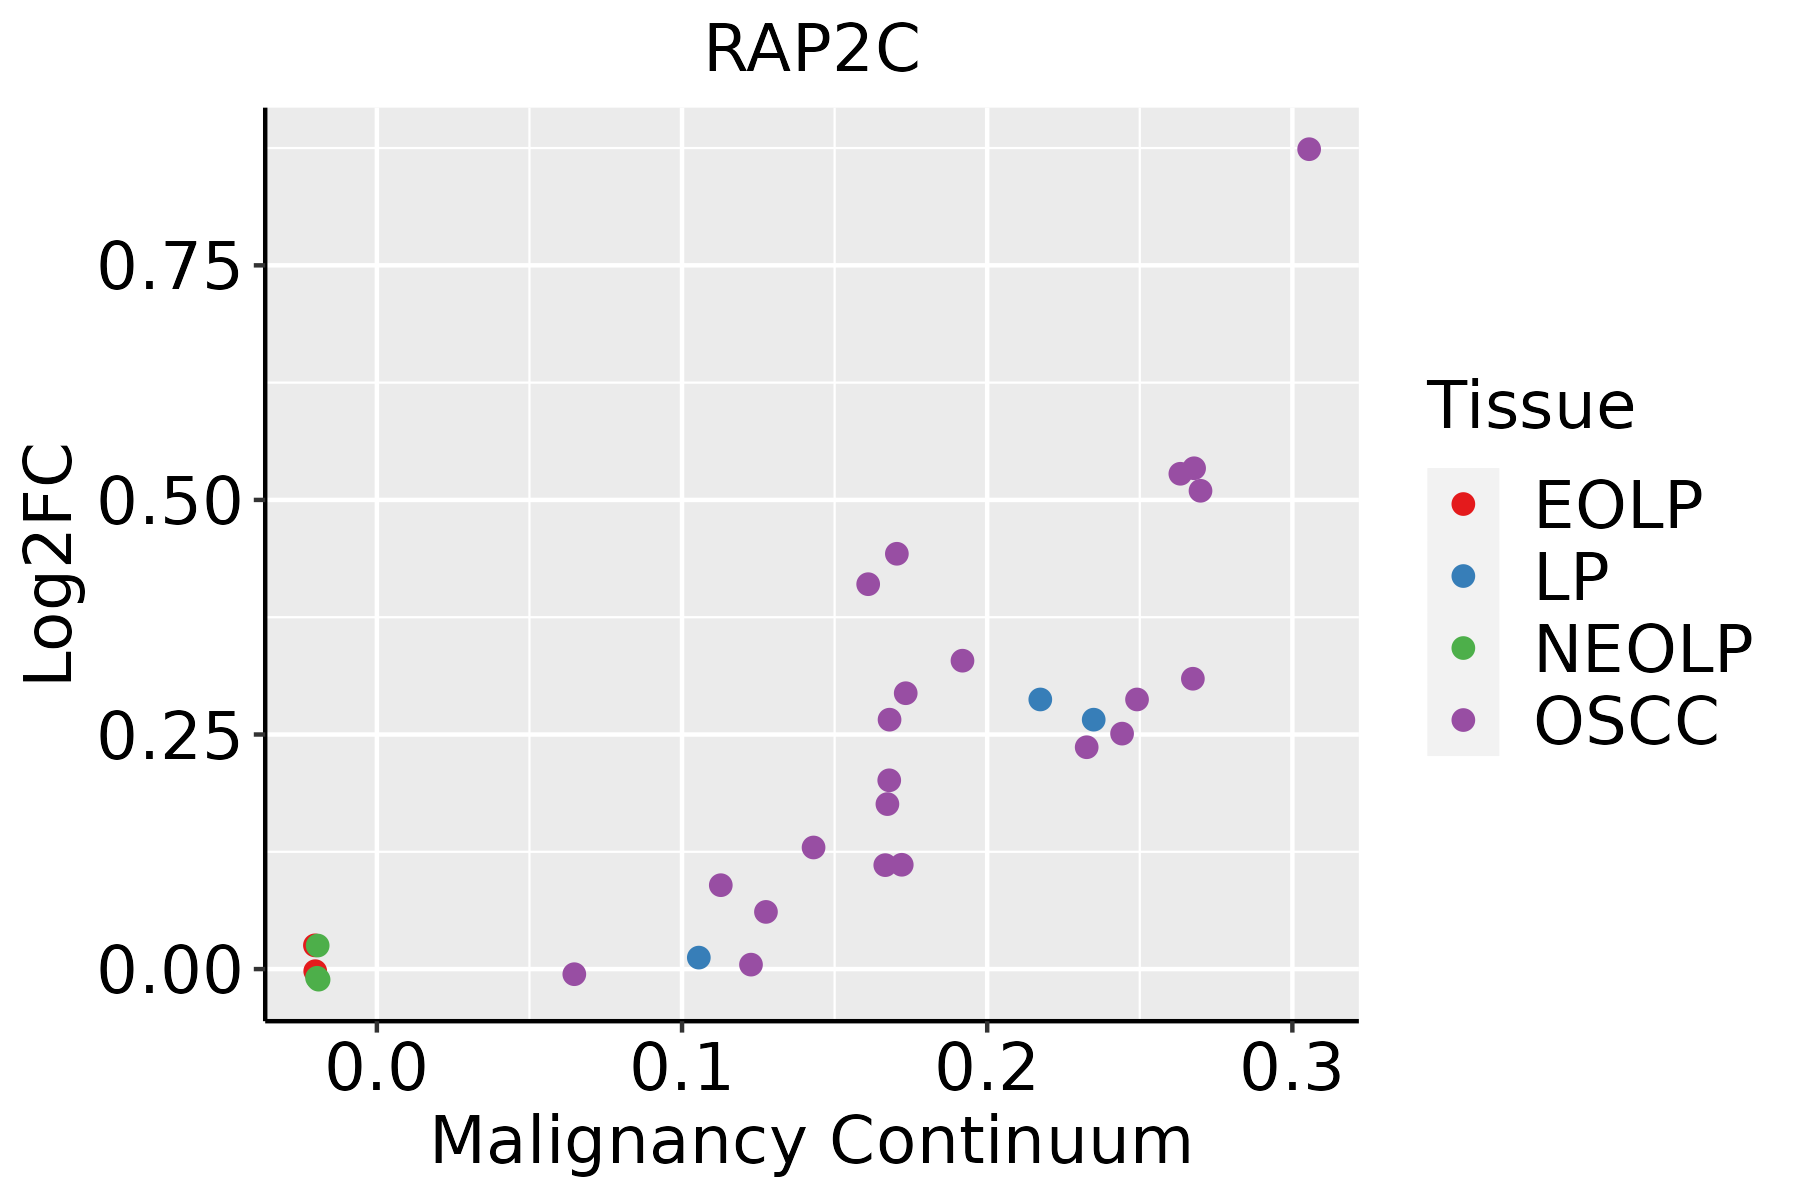 | EOLP: Erosive Oral lichen planus |
| LP: leukoplakia | ||
| NEOLP: Non-erosive oral lichen planus | ||
| OSCC: Oral squamous cell carcinoma | ||
| Thyroid | 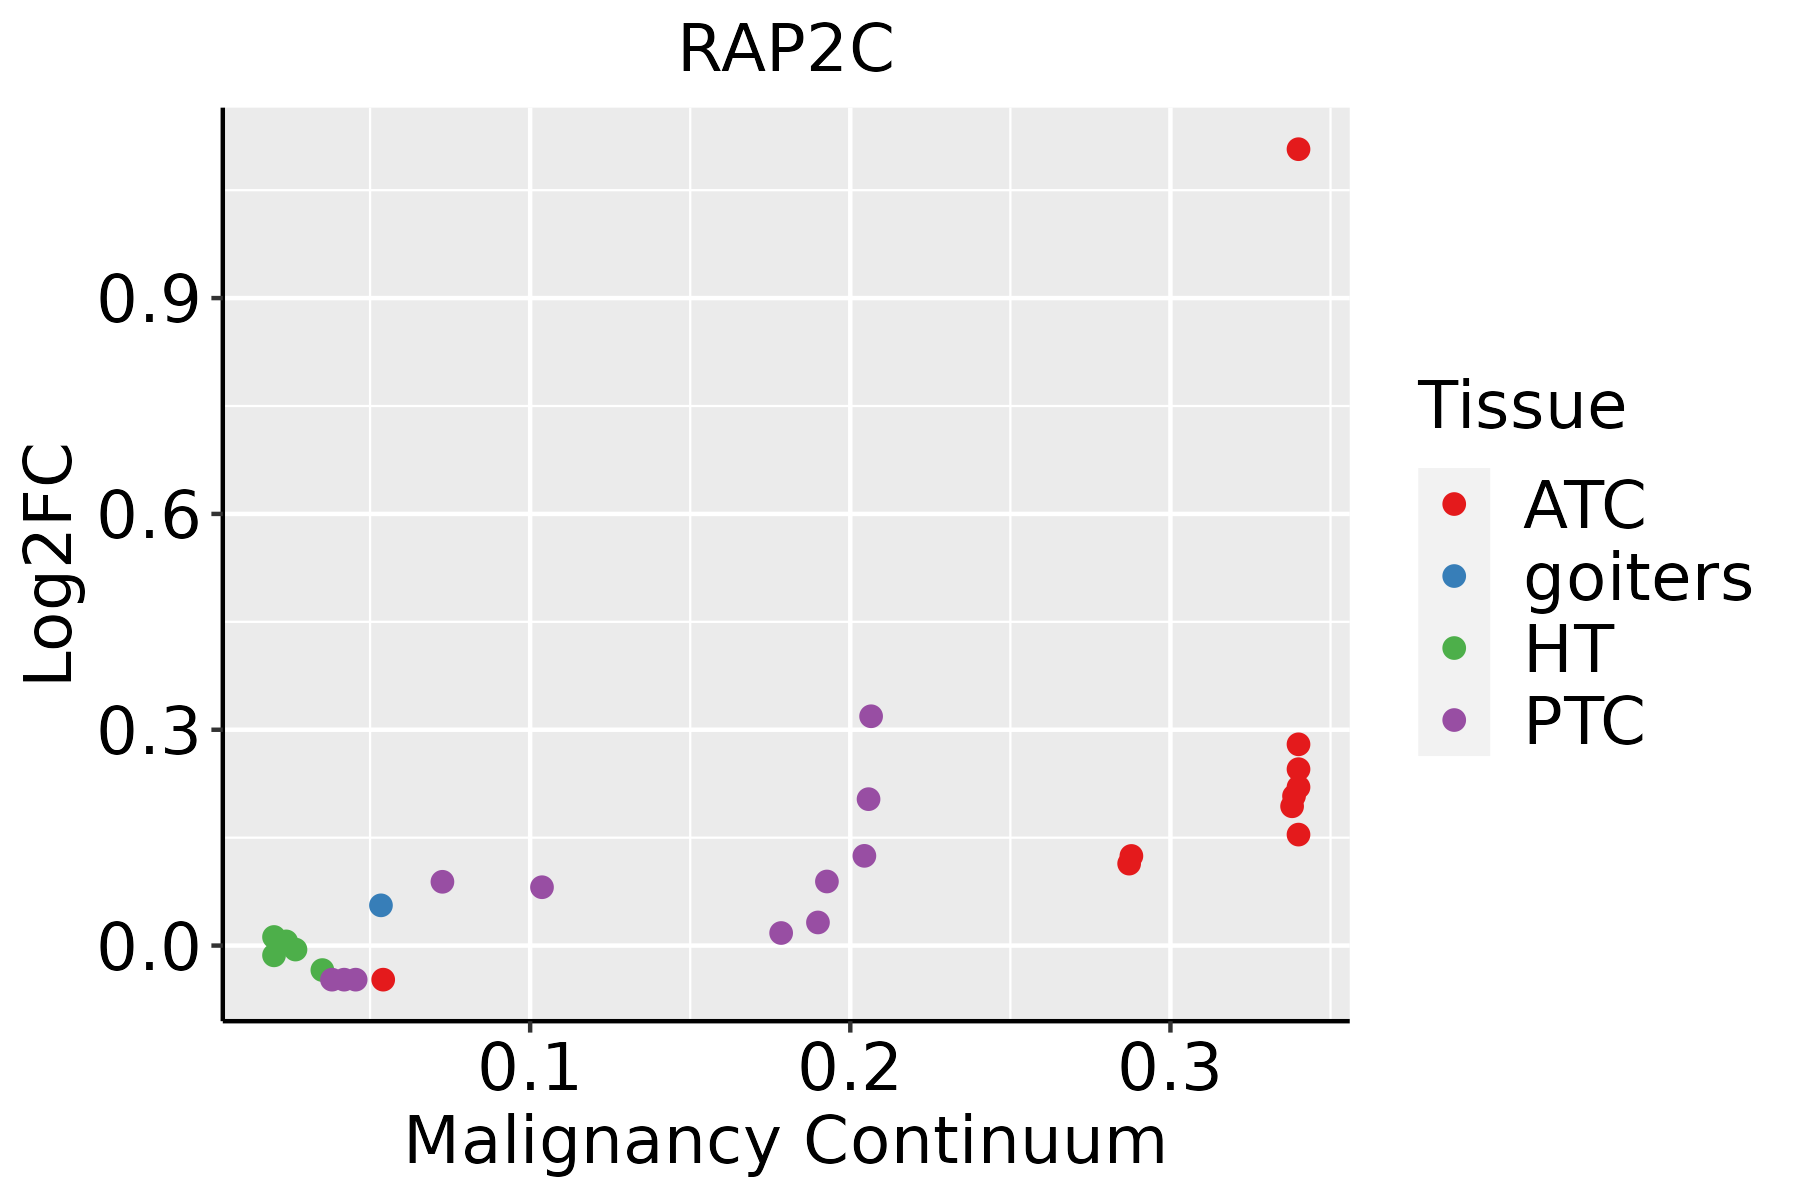 | ATC: Anaplastic thyroid cancer |
| HT: Hashimoto's thyroiditis | ||
| PTC: Papillary thyroid cancer |
| ∗log2FC in expression of this searched gene in stem-like cells from each diseased tissue sample relative to stem-like cells in normal samples in each tissue plotted against the malignancy continuum. Samples are colored based on if they are from different disease stage. |
Top |
Malignant transformation related pathway analysis |
| Find out the enriched GO biological processes and KEGG pathways involved in transition from healthy to precancer to cancer |
| Tissue | Disease Stage | Enriched GO biological Processes |
| Colorectum | AD |  |
| Colorectum | SER |  |
| Colorectum | MSS |  |
| Colorectum | MSI-H |  |
| Colorectum | FAP |  |
| ∗Top 15 enriched GO BP terms are showed in the bar plot of each disease state in each tissue. Each row represents a significant GO biological process which is colored according to the -log10(p.adjust). |
| Page: 1 2 3 4 5 6 7 8 9 |
| GO ID | Tissue | Disease Stage | Description | Gene Ratio | Bg Ratio | pvalue | p.adjust | Count |
| GO:000726510 | Esophagus | ESCC | Ras protein signal transduction | 201/8552 | 337/18723 | 1.44e-07 | 2.30e-06 | 201 |
| GO:000206420 | Esophagus | ESCC | epithelial cell development | 136/8552 | 220/18723 | 9.50e-07 | 1.21e-05 | 136 |
| GO:004677710 | Esophagus | ESCC | protein autophosphorylation | 138/8552 | 227/18723 | 2.98e-06 | 3.38e-05 | 138 |
| GO:000188510 | Esophagus | ESCC | endothelial cell development | 44/8552 | 64/18723 | 1.59e-04 | 1.05e-03 | 44 |
| GO:006102818 | Esophagus | ESCC | establishment of endothelial barrier | 32/8552 | 46/18723 | 9.01e-04 | 4.61e-03 | 32 |
| GO:00182124 | Esophagus | ESCC | peptidyl-tyrosine modification | 202/8552 | 378/18723 | 1.34e-03 | 6.39e-03 | 202 |
| GO:00181084 | Esophagus | ESCC | peptidyl-tyrosine phosphorylation | 200/8552 | 375/18723 | 1.60e-03 | 7.45e-03 | 200 |
| GO:00507303 | Esophagus | ESCC | regulation of peptidyl-tyrosine phosphorylation | 144/8552 | 264/18723 | 2.22e-03 | 9.78e-03 | 144 |
| GO:00610972 | Esophagus | ESCC | regulation of protein tyrosine kinase activity | 55/8552 | 90/18723 | 2.27e-03 | 9.99e-03 | 55 |
| GO:00319521 | Esophagus | ESCC | regulation of protein autophosphorylation | 29/8552 | 43/18723 | 3.25e-03 | 1.35e-02 | 29 |
| GO:00319541 | Esophagus | ESCC | positive regulation of protein autophosphorylation | 19/8552 | 27/18723 | 8.35e-03 | 2.95e-02 | 19 |
| GO:00905578 | Esophagus | ESCC | establishment of endothelial intestinal barrier | 10/8552 | 12/18723 | 8.94e-03 | 3.12e-02 | 10 |
| GO:004544610 | Esophagus | ESCC | endothelial cell differentiation | 67/8552 | 118/18723 | 9.86e-03 | 3.40e-02 | 67 |
| GO:000315818 | Esophagus | ESCC | endothelium development | 76/8552 | 136/18723 | 1.05e-02 | 3.59e-02 | 76 |
| GO:000726521 | Liver | HCC | Ras protein signal transduction | 187/7958 | 337/18723 | 8.89e-07 | 1.35e-05 | 187 |
| GO:00467775 | Liver | HCC | protein autophosphorylation | 123/7958 | 227/18723 | 2.40e-04 | 1.80e-03 | 123 |
| GO:000206422 | Liver | HCC | epithelial cell development | 114/7958 | 220/18723 | 3.19e-03 | 1.47e-02 | 114 |
| GO:006102822 | Liver | HCC | establishment of endothelial barrier | 28/7958 | 46/18723 | 9.16e-03 | 3.52e-02 | 28 |
| GO:000188512 | Liver | HCC | endothelial cell development | 37/7958 | 64/18723 | 9.63e-03 | 3.63e-02 | 37 |
| GO:00072659 | Oral cavity | OSCC | Ras protein signal transduction | 185/7305 | 337/18723 | 1.95e-09 | 4.60e-08 | 185 |
| Page: 1 2 3 4 |
| Pathway ID | Tissue | Disease Stage | Description | Gene Ratio | Bg Ratio | pvalue | p.adjust | qvalue | Count |
| hsa04530211 | Esophagus | ESCC | Tight junction | 105/4205 | 169/8465 | 6.73e-04 | 2.23e-03 | 1.14e-03 | 105 |
| hsa04530310 | Esophagus | ESCC | Tight junction | 105/4205 | 169/8465 | 6.73e-04 | 2.23e-03 | 1.14e-03 | 105 |
| hsa0453042 | Liver | HCC | Tight junction | 110/4020 | 169/8465 | 2.45e-06 | 2.28e-05 | 1.27e-05 | 110 |
| hsa0453052 | Liver | HCC | Tight junction | 110/4020 | 169/8465 | 2.45e-06 | 2.28e-05 | 1.27e-05 | 110 |
| hsa0453030 | Oral cavity | OSCC | Tight junction | 102/3704 | 169/8465 | 8.68e-06 | 3.93e-05 | 2.00e-05 | 102 |
| hsa04530114 | Oral cavity | OSCC | Tight junction | 102/3704 | 169/8465 | 8.68e-06 | 3.93e-05 | 2.00e-05 | 102 |
| Page: 1 |
Top |
Cell-cell communication analysis |
| Identification of potential cell-cell interactions between two cell types and their ligand-receptor pairs for different disease states |
| Ligand | Receptor | LRpair | Pathway | Tissue | Disease Stage |
| Page: 1 |
Top |
Single-cell gene regulatory network inference analysis |
| Find out the significant the regulons (TFs) and the target genes of each regulon across cell types for different disease states |
| TF | Cell Type | Tissue | Disease Stage | Target Gene | RSS | Regulon Activity |
| ∗The dot plots of a searched regulon are shown for all cell subpopulations in each disease state of each tissue based on the regulon specific score inferred using pySCENIC and by calculating the average expression. |
| Page: 1 |
Top |
Somatic mutation of malignant transformation related genes |
| Annotation of somatic variants for genes involved in malignant transformation |
| Hugo Symbol | Variant Class | Variant Classification | dbSNP RS | HGVSc | HGVSp | HGVSp Short | SWISSPROT | BIOTYPE | SIFT | PolyPhen | Tumor Sample Barcode | Tissue | Histology | Sex | Age | Stage | Therapy Types | Drugs | Outcome |
| RAP2C | SNV | Missense_Mutation | c.361G>C | p.Glu121Gln | p.E121Q | Q9Y3L5 | protein_coding | tolerated(0.08) | benign(0.072) | TCGA-A8-A095-01 | Breast | breast invasive carcinoma | Female | <65 | I/II | Chemotherapy | 5-fluorouracil | CR | |
| RAP2C | SNV | Missense_Mutation | c.427A>G | p.Met143Val | p.M143V | Q9Y3L5 | protein_coding | tolerated(0.25) | benign(0.003) | TCGA-EW-A1P0-01 | Breast | breast invasive carcinoma | Female | <65 | I/II | Hormone Therapy | arimidex | PD | |
| RAP2C | SNV | Missense_Mutation | c.205G>A | p.Asp69Asn | p.D69N | Q9Y3L5 | protein_coding | deleterious(0) | benign(0.18) | TCGA-EI-6917-01 | Colorectum | rectum adenocarcinoma | Male | <65 | III/IV | Chemotherapy | 5fluorouracil+oxaciplatina+l-folinian | SD | |
| RAP2C | SNV | Missense_Mutation | c.375G>T | p.Glu125Asp | p.E125D | Q9Y3L5 | protein_coding | tolerated(0.35) | possibly_damaging(0.662) | TCGA-AP-A051-01 | Endometrium | uterine corpus endometrioid carcinoma | Female | >=65 | I/II | Unknown | Unknown | SD | |
| RAP2C | SNV | Missense_Mutation | c.437N>T | p.Ser146Leu | p.S146L | Q9Y3L5 | protein_coding | deleterious(0.01) | probably_damaging(1) | TCGA-AP-A059-01 | Endometrium | uterine corpus endometrioid carcinoma | Female | >=65 | I/II | Unknown | Unknown | SD | |
| RAP2C | SNV | Missense_Mutation | novel | c.9N>C | p.Glu3Asp | p.E3D | Q9Y3L5 | protein_coding | tolerated(0.16) | probably_damaging(0.933) | TCGA-AP-A1E0-01 | Endometrium | uterine corpus endometrioid carcinoma | Female | <65 | III/IV | Chemotherapy | paclitaxel | SD |
| RAP2C | SNV | Missense_Mutation | novel | c.403G>A | p.Ala135Thr | p.A135T | Q9Y3L5 | protein_coding | deleterious(0) | probably_damaging(0.92) | TCGA-B5-A3FC-01 | Endometrium | uterine corpus endometrioid carcinoma | Female | <65 | I/II | Unknown | Unknown | SD |
| RAP2C | SNV | Missense_Mutation | novel | c.133N>A | p.Glu45Lys | p.E45K | Q9Y3L5 | protein_coding | tolerated(0.08) | possibly_damaging(0.865) | TCGA-BK-A6W3-01 | Endometrium | uterine corpus endometrioid carcinoma | Female | <65 | I/II | Unknown | Unknown | SD |
| RAP2C | SNV | Missense_Mutation | c.37G>A | p.Gly13Arg | p.G13R | Q9Y3L5 | protein_coding | deleterious(0.01) | probably_damaging(1) | TCGA-D1-A0ZS-01 | Endometrium | uterine corpus endometrioid carcinoma | Female | <65 | I/II | Unknown | Unknown | SD | |
| RAP2C | SNV | Missense_Mutation | rs781764495 | c.544N>A | p.Val182Ile | p.V182I | Q9Y3L5 | protein_coding | tolerated_low_confidence(1) | benign(0) | TCGA-D1-A167-01 | Endometrium | uterine corpus endometrioid carcinoma | Female | >=65 | I/II | Unknown | Unknown | SD |
| Page: 1 2 |
Top |
Related drugs of malignant transformation related genes |
| Identification of chemicals and drugs interact with genes involved in malignant transfromation |
| (DGIdb 4.0) |
| Entrez ID | Symbol | Category | Interaction Types | Drug Claim Name | Drug Name | PMIDs |
| Page: 1 |

Copyright 2023-Present -The University of Texas Health Science Center at Houston |