
|
|||||
|
 | |
| |
| |
| |
| |
| |
|
Gene: RAI14 |
Gene summary for RAI14 |
| Gene information | Species | Human | Gene symbol | RAI14 | Gene ID | 26064 |
| Gene name | retinoic acid induced 14 | |
| Gene Alias | NORPEG | |
| Cytomap | 5p13.2 | |
| Gene Type | protein-coding | GO ID | GO:0000003 | UniProtAcc | Q9P0K7 |
Top |
Malignant transformation analysis |
| Identification of the aberrant gene expression in precancerous and cancerous lesions by comparing the gene expression of stem-like cells in diseased tissues with normal stem cells |
| Entrez ID | Symbol | Replicates | Species | Organ | Tissue | Adj P-value | Log2FC | Malignancy |
| 26064 | RAI14 | P12T-E | Human | Esophagus | ESCC | 2.29e-42 | 7.76e-01 | 0.1122 |
| 26064 | RAI14 | P15T-E | Human | Esophagus | ESCC | 4.40e-21 | 5.67e-01 | 0.1149 |
| 26064 | RAI14 | P16T-E | Human | Esophagus | ESCC | 3.28e-14 | 1.82e-01 | 0.1153 |
| 26064 | RAI14 | P17T-E | Human | Esophagus | ESCC | 1.88e-24 | 1.03e+00 | 0.1278 |
| 26064 | RAI14 | P19T-E | Human | Esophagus | ESCC | 5.66e-12 | 7.16e-01 | 0.1662 |
| 26064 | RAI14 | P20T-E | Human | Esophagus | ESCC | 8.91e-03 | 1.62e-01 | 0.1124 |
| 26064 | RAI14 | P21T-E | Human | Esophagus | ESCC | 2.02e-06 | 1.83e-01 | 0.1617 |
| 26064 | RAI14 | P22T-E | Human | Esophagus | ESCC | 3.11e-19 | 4.33e-01 | 0.1236 |
| 26064 | RAI14 | P23T-E | Human | Esophagus | ESCC | 1.03e-37 | 1.01e+00 | 0.108 |
| 26064 | RAI14 | P24T-E | Human | Esophagus | ESCC | 1.23e-34 | 8.43e-01 | 0.1287 |
| 26064 | RAI14 | P26T-E | Human | Esophagus | ESCC | 2.12e-24 | 4.66e-01 | 0.1276 |
| 26064 | RAI14 | P27T-E | Human | Esophagus | ESCC | 1.76e-12 | 2.43e-01 | 0.1055 |
| 26064 | RAI14 | P28T-E | Human | Esophagus | ESCC | 4.13e-11 | 2.10e-01 | 0.1149 |
| 26064 | RAI14 | P30T-E | Human | Esophagus | ESCC | 2.15e-17 | 9.16e-01 | 0.137 |
| 26064 | RAI14 | P31T-E | Human | Esophagus | ESCC | 3.57e-49 | 9.18e-01 | 0.1251 |
| 26064 | RAI14 | P32T-E | Human | Esophagus | ESCC | 6.28e-58 | 1.17e+00 | 0.1666 |
| 26064 | RAI14 | P36T-E | Human | Esophagus | ESCC | 2.30e-21 | 7.28e-01 | 0.1187 |
| 26064 | RAI14 | P37T-E | Human | Esophagus | ESCC | 1.92e-40 | 9.97e-01 | 0.1371 |
| 26064 | RAI14 | P38T-E | Human | Esophagus | ESCC | 8.13e-04 | 1.77e-01 | 0.127 |
| 26064 | RAI14 | P39T-E | Human | Esophagus | ESCC | 2.78e-38 | 8.15e-01 | 0.0894 |
| Page: 1 2 3 4 5 6 7 |
| Tissue | Expression Dynamics | Abbreviation |
| Cervix |  | CC: Cervix cancer |
| HSIL_HPV: HPV-infected high-grade squamous intraepithelial lesions | ||
| N_HPV: HPV-infected normal cervix | ||
| Esophagus | 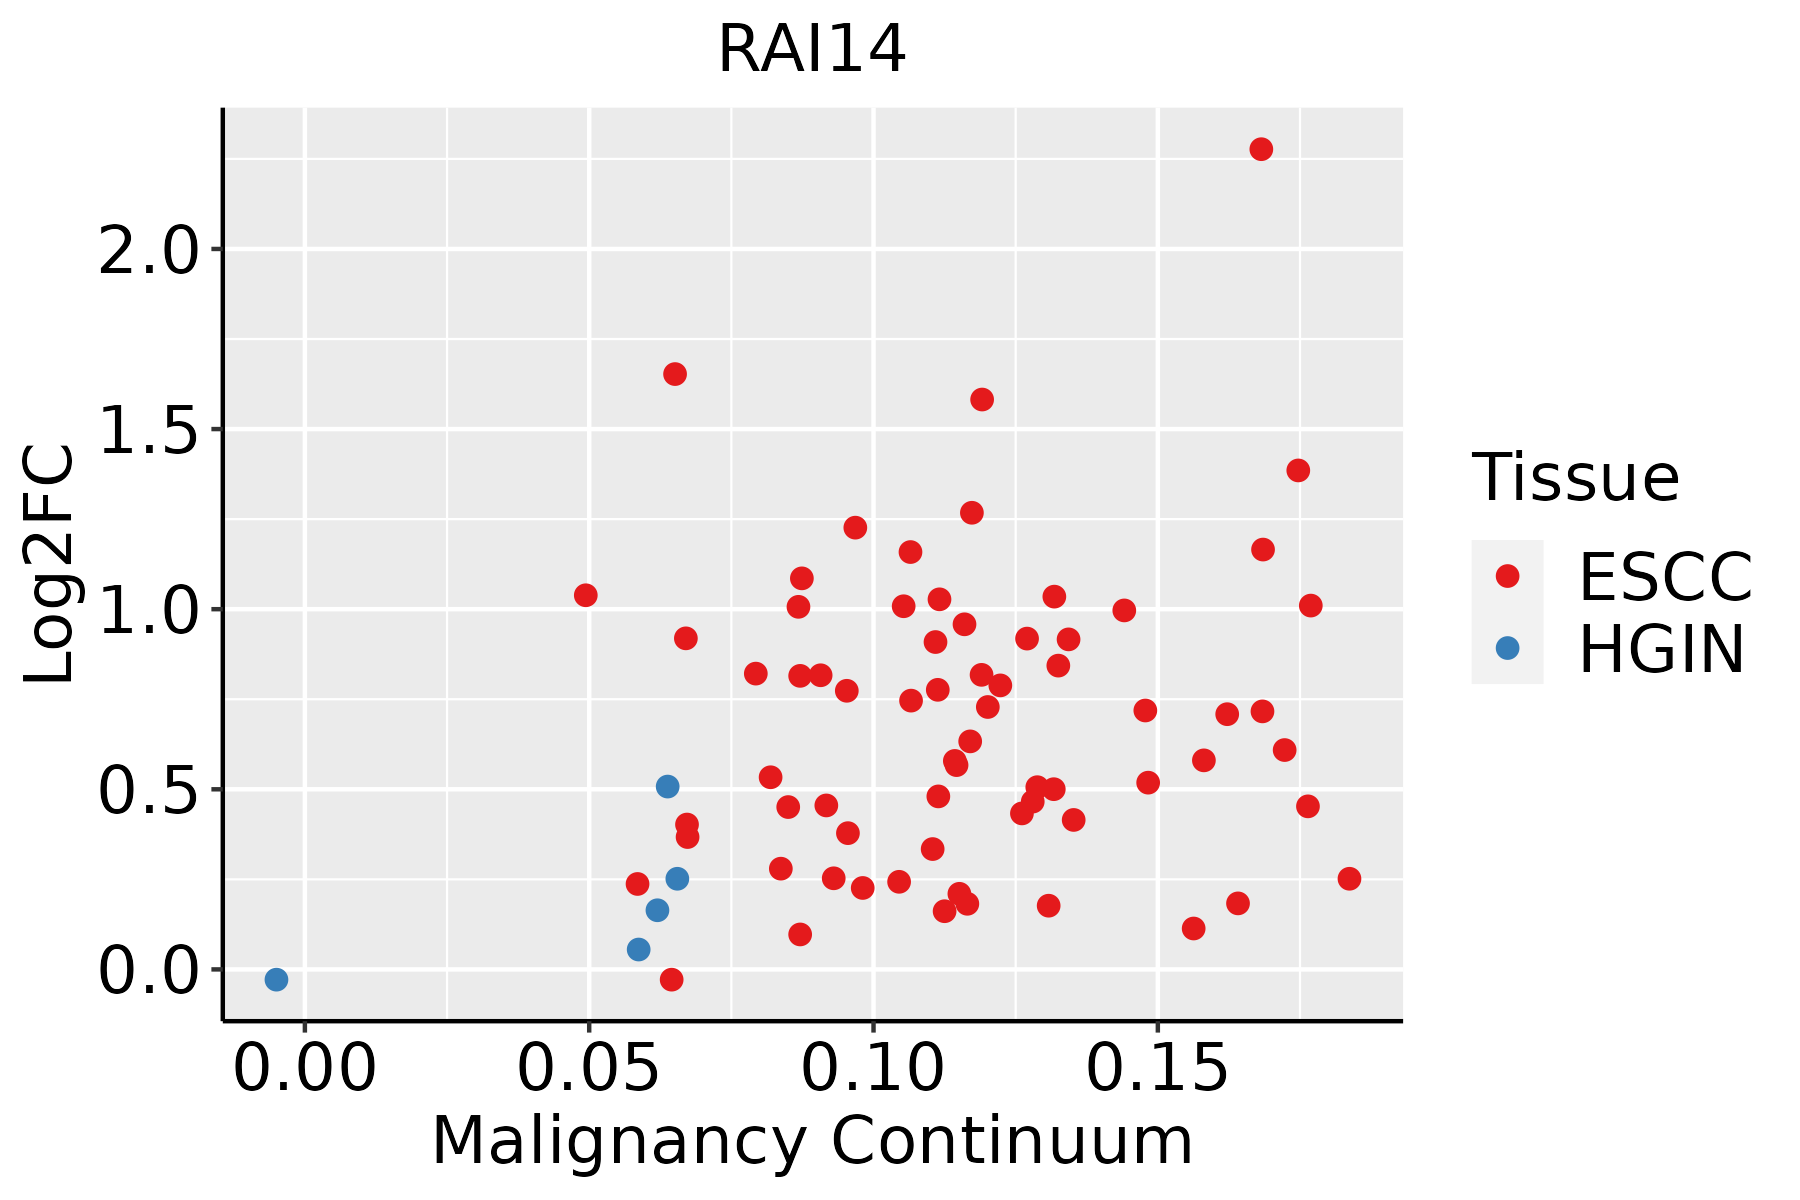 | ESCC: Esophageal squamous cell carcinoma |
| HGIN: High-grade intraepithelial neoplasias | ||
| LGIN: Low-grade intraepithelial neoplasias | ||
| Liver |  | HCC: Hepatocellular carcinoma |
| NAFLD: Non-alcoholic fatty liver disease | ||
| Lung | 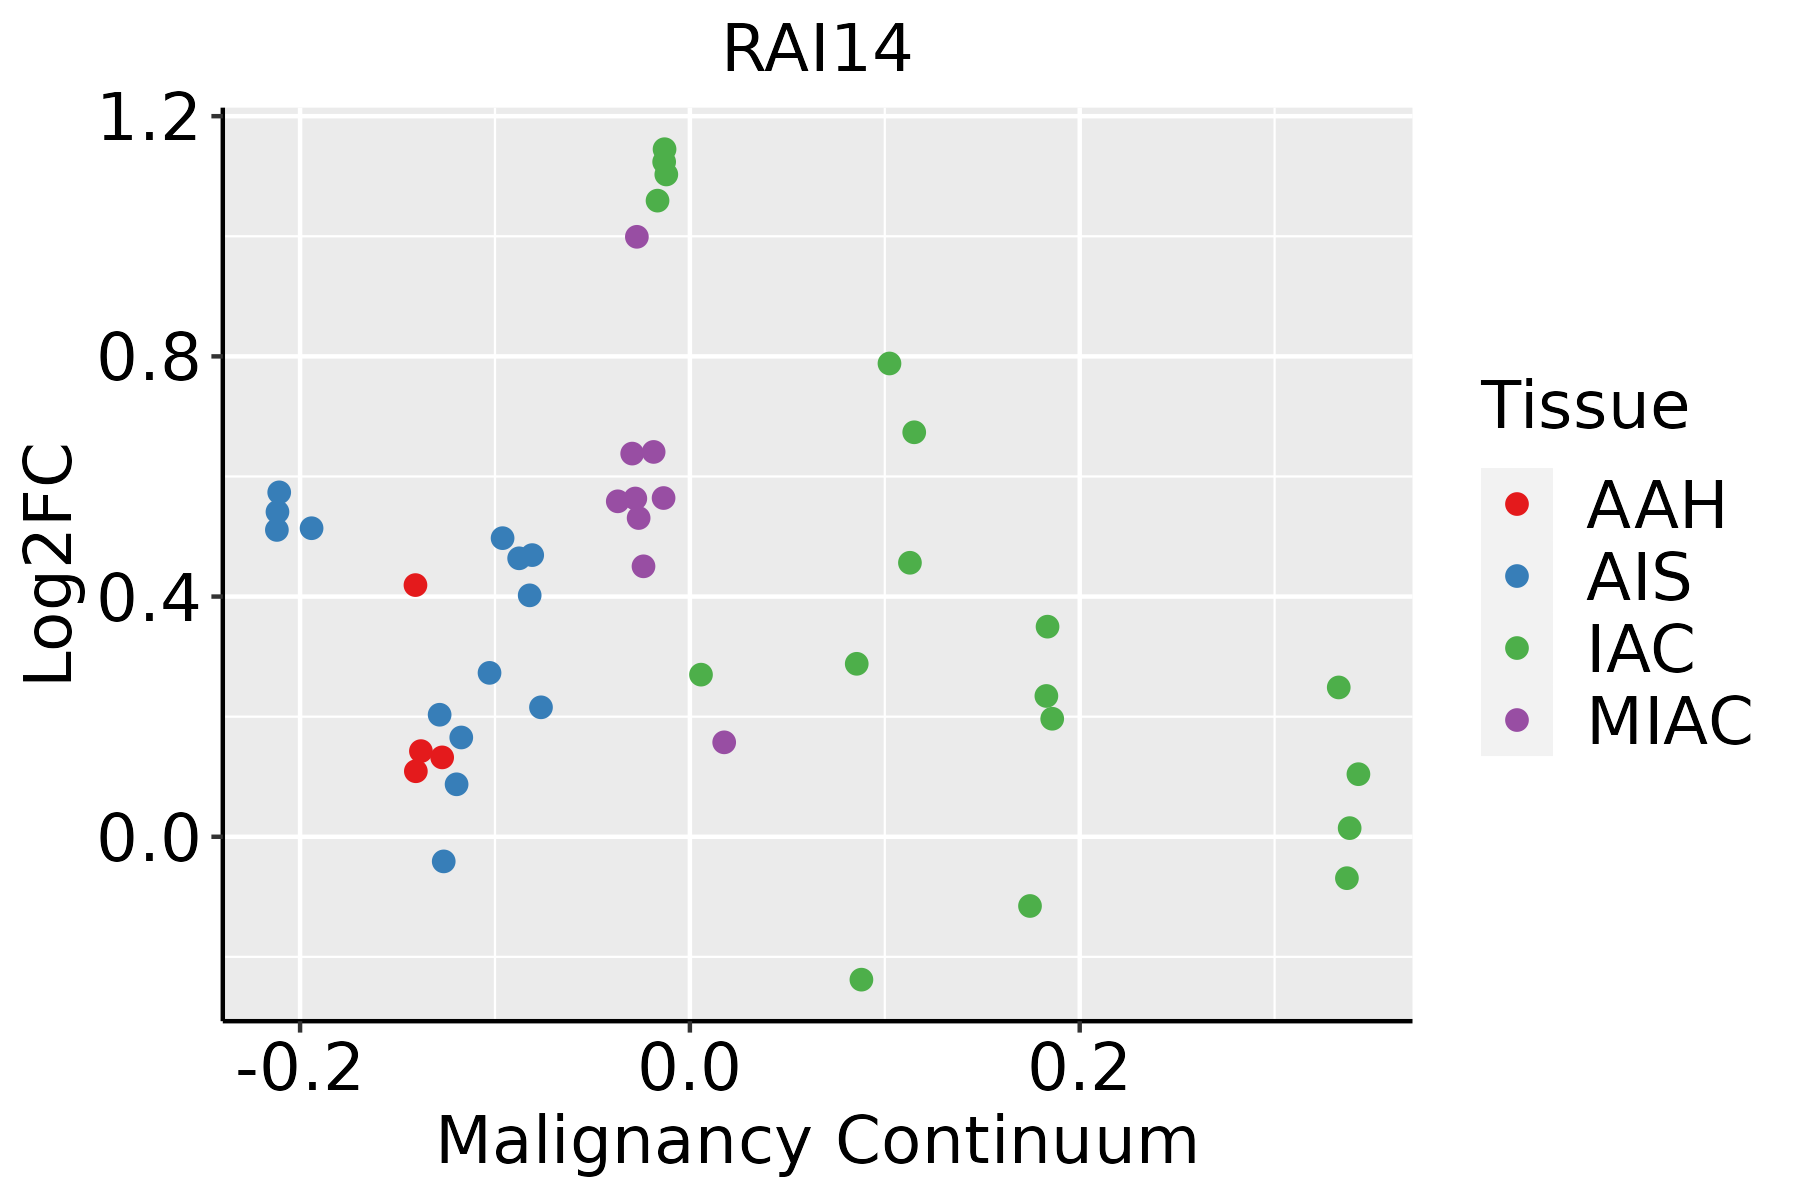 | AAH: Atypical adenomatous hyperplasia |
| AIS: Adenocarcinoma in situ | ||
| IAC: Invasive lung adenocarcinoma | ||
| MIA: Minimally invasive adenocarcinoma | ||
| Oral Cavity |  | EOLP: Erosive Oral lichen planus |
| LP: leukoplakia | ||
| NEOLP: Non-erosive oral lichen planus | ||
| OSCC: Oral squamous cell carcinoma | ||
| Thyroid | 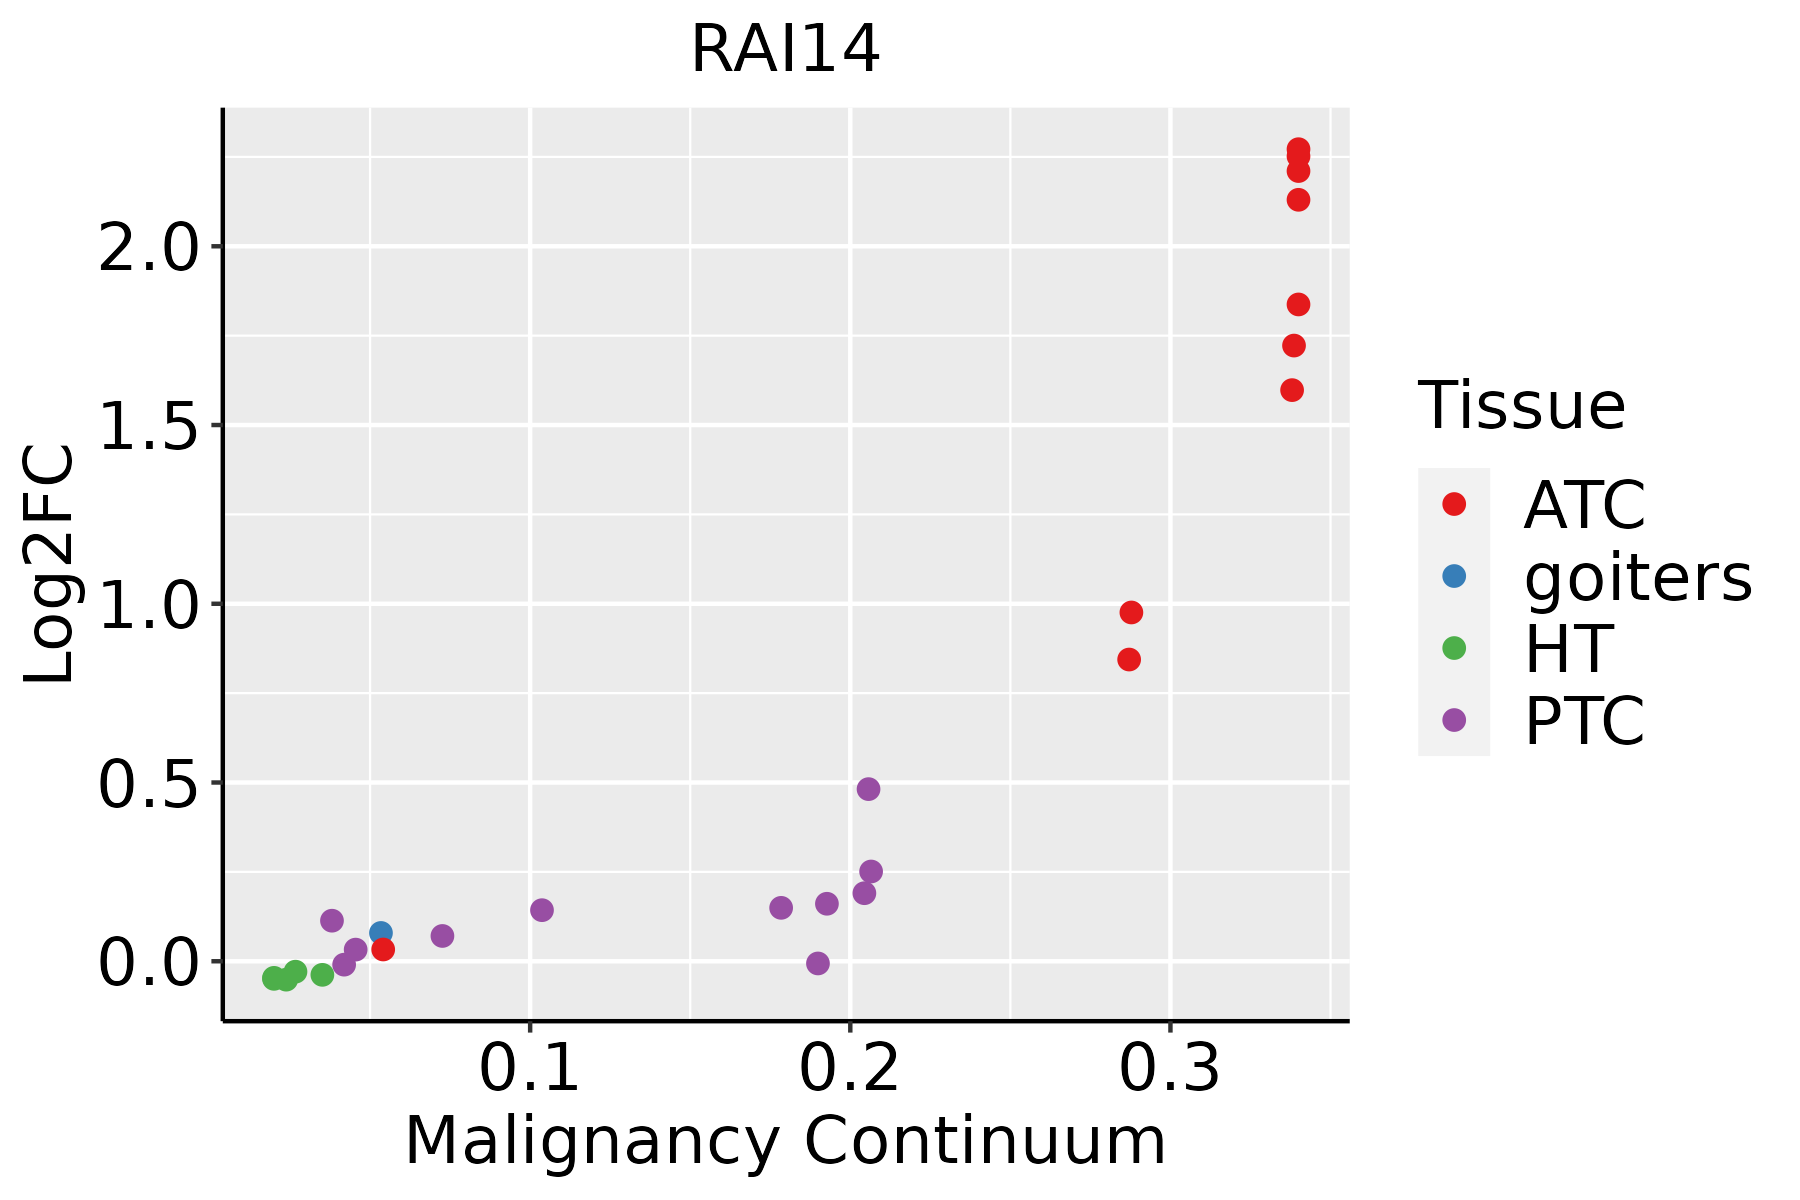 | ATC: Anaplastic thyroid cancer |
| HT: Hashimoto's thyroiditis | ||
| PTC: Papillary thyroid cancer |
| ∗log2FC in expression of this searched gene in stem-like cells from each diseased tissue sample relative to stem-like cells in normal samples in each tissue plotted against the malignancy continuum. Samples are colored based on if they are from different disease stage. |
Top |
Malignant transformation related pathway analysis |
| Find out the enriched GO biological processes and KEGG pathways involved in transition from healthy to precancer to cancer |
| Tissue | Disease Stage | Enriched GO biological Processes |
| Colorectum | AD |  |
| Colorectum | SER |  |
| Colorectum | MSS |  |
| Colorectum | MSI-H |  |
| Colorectum | FAP |  |
| ∗Top 15 enriched GO BP terms are showed in the bar plot of each disease state in each tissue. Each row represents a significant GO biological process which is colored according to the -log10(p.adjust). |
| Page: 1 2 3 4 5 6 7 8 9 |
| GO ID | Tissue | Disease Stage | Description | Gene Ratio | Bg Ratio | pvalue | p.adjust | Count |
| Page: 1 |
| Pathway ID | Tissue | Disease Stage | Description | Gene Ratio | Bg Ratio | pvalue | p.adjust | qvalue | Count |
| Page: 1 |
Top |
Cell-cell communication analysis |
| Identification of potential cell-cell interactions between two cell types and their ligand-receptor pairs for different disease states |
| Ligand | Receptor | LRpair | Pathway | Tissue | Disease Stage |
| Page: 1 |
Top |
Single-cell gene regulatory network inference analysis |
| Find out the significant the regulons (TFs) and the target genes of each regulon across cell types for different disease states |
| TF | Cell Type | Tissue | Disease Stage | Target Gene | RSS | Regulon Activity |
| ∗The dot plots of a searched regulon are shown for all cell subpopulations in each disease state of each tissue based on the regulon specific score inferred using pySCENIC and by calculating the average expression. |
| Page: 1 |
Top |
Somatic mutation of malignant transformation related genes |
| Annotation of somatic variants for genes involved in malignant transformation |
| Hugo Symbol | Variant Class | Variant Classification | dbSNP RS | HGVSc | HGVSp | HGVSp Short | SWISSPROT | BIOTYPE | SIFT | PolyPhen | Tumor Sample Barcode | Tissue | Histology | Sex | Age | Stage | Therapy Types | Drugs | Outcome |
| RAI14 | SNV | Missense_Mutation | c.2530N>G | p.Leu844Val | p.L844V | Q9P0K7 | protein_coding | deleterious(0.01) | benign(0.007) | TCGA-A1-A0SI-01 | Breast | breast invasive carcinoma | Female | <65 | I/II | Unknown | Unknown | SD | |
| RAI14 | SNV | Missense_Mutation | c.1834A>T | p.Met612Leu | p.M612L | Q9P0K7 | protein_coding | tolerated(0.2) | benign(0.005) | TCGA-A2-A0T6-01 | Breast | breast invasive carcinoma | Female | <65 | I/II | Chemotherapy | adriamycin | SD | |
| RAI14 | SNV | Missense_Mutation | c.863N>G | p.Leu288Trp | p.L288W | Q9P0K7 | protein_coding | tolerated(0.08) | probably_damaging(0.952) | TCGA-B6-A0IA-01 | Breast | breast invasive carcinoma | Female | <65 | I/II | Unknown | Unknown | SD | |
| RAI14 | SNV | Missense_Mutation | c.1606A>C | p.Asn536His | p.N536H | Q9P0K7 | protein_coding | deleterious(0.01) | benign(0.232) | TCGA-B6-A0RS-01 | Breast | breast invasive carcinoma | Female | <65 | I/II | Unknown | Unknown | PD | |
| RAI14 | SNV | Missense_Mutation | c.770N>C | p.Lys257Thr | p.K257T | Q9P0K7 | protein_coding | deleterious(0.03) | benign(0.261) | TCGA-BH-A0HO-01 | Breast | breast invasive carcinoma | Female | <65 | I/II | Chemotherapy | cyclophosphamide | SD | |
| RAI14 | SNV | Missense_Mutation | rs752872802 | c.849N>G | p.Ile283Met | p.I283M | Q9P0K7 | protein_coding | deleterious(0.02) | possibly_damaging(0.468) | TCGA-EW-A1J5-01 | Breast | breast invasive carcinoma | Female | <65 | I/II | Chemotherapy | adriamycin | SD |
| RAI14 | insertion | Frame_Shift_Ins | novel | c.1343_1344insCATATGGGATGACATTCCATTTATAGGAATTCTA | p.Leu448PhefsTer16 | p.L448Ffs*16 | Q9P0K7 | protein_coding | TCGA-B6-A0IK-01 | Breast | breast invasive carcinoma | Female | <65 | III/IV | Unknown | Unknown | PD | ||
| RAI14 | SNV | Missense_Mutation | c.1911N>A | p.Met637Ile | p.M637I | Q9P0K7 | protein_coding | deleterious(0) | possibly_damaging(0.675) | TCGA-EK-A3GK-01 | Cervix | cervical & endocervical cancer | Female | <65 | I/II | Unknown | Unknown | SD | |
| RAI14 | SNV | Missense_Mutation | c.2703G>C | p.Leu901Phe | p.L901F | Q9P0K7 | protein_coding | deleterious(0) | probably_damaging(0.999) | TCGA-VS-A9UY-01 | Cervix | cervical & endocervical cancer | Female | <65 | I/II | Chemotherapy | cisplatin | PD | |
| RAI14 | insertion | In_Frame_Ins | novel | c.1221_1222insCCG | p.Thr407_Ser408insPro | p.T407_S408insP | Q9P0K7 | protein_coding | TCGA-DS-A1OA-01 | Cervix | cervical & endocervical cancer | Female | >=65 | I/II | Chemotherapy | carboplatin | PD |
| Page: 1 2 3 4 5 6 7 8 9 10 11 |
Top |
Related drugs of malignant transformation related genes |
| Identification of chemicals and drugs interact with genes involved in malignant transfromation |
| (DGIdb 4.0) |
| Entrez ID | Symbol | Category | Interaction Types | Drug Claim Name | Drug Name | PMIDs |
| Page: 1 |

Copyright 2023-Present -The University of Texas Health Science Center at Houston |