
|
|||||
|
 | |
| |
| |
| |
| |
| |
|
Gene: PXMP2 |
Gene summary for PXMP2 |
| Gene information | Species | Human | Gene symbol | PXMP2 | Gene ID | 5827 |
| Gene name | peroxisomal membrane protein 2 | |
| Gene Alias | MPV17L3 | |
| Cytomap | 12q24.33 | |
| Gene Type | protein-coding | GO ID | GO:0008150 | UniProtAcc | Q9NR77 |
Top |
Malignant transformation analysis |
| Identification of the aberrant gene expression in precancerous and cancerous lesions by comparing the gene expression of stem-like cells in diseased tissues with normal stem cells |
| Entrez ID | Symbol | Replicates | Species | Organ | Tissue | Adj P-value | Log2FC | Malignancy |
| 5827 | PXMP2 | P26T-E | Human | Esophagus | ESCC | 4.10e-27 | 4.97e-01 | 0.1276 |
| 5827 | PXMP2 | P27T-E | Human | Esophagus | ESCC | 9.14e-50 | 7.95e-01 | 0.1055 |
| 5827 | PXMP2 | P28T-E | Human | Esophagus | ESCC | 1.48e-08 | 2.27e-01 | 0.1149 |
| 5827 | PXMP2 | P30T-E | Human | Esophagus | ESCC | 3.25e-12 | 4.76e-01 | 0.137 |
| 5827 | PXMP2 | P31T-E | Human | Esophagus | ESCC | 1.43e-36 | 7.20e-01 | 0.1251 |
| 5827 | PXMP2 | P32T-E | Human | Esophagus | ESCC | 1.74e-19 | 3.86e-01 | 0.1666 |
| 5827 | PXMP2 | P36T-E | Human | Esophagus | ESCC | 7.56e-14 | 3.88e-01 | 0.1187 |
| 5827 | PXMP2 | P37T-E | Human | Esophagus | ESCC | 4.26e-27 | 5.94e-01 | 0.1371 |
| 5827 | PXMP2 | P38T-E | Human | Esophagus | ESCC | 1.60e-04 | 2.58e-01 | 0.127 |
| 5827 | PXMP2 | P39T-E | Human | Esophagus | ESCC | 4.30e-10 | 1.99e-01 | 0.0894 |
| 5827 | PXMP2 | P40T-E | Human | Esophagus | ESCC | 5.44e-09 | 2.80e-01 | 0.109 |
| 5827 | PXMP2 | P42T-E | Human | Esophagus | ESCC | 7.29e-18 | 4.52e-01 | 0.1175 |
| 5827 | PXMP2 | P44T-E | Human | Esophagus | ESCC | 8.11e-07 | 2.78e-01 | 0.1096 |
| 5827 | PXMP2 | P47T-E | Human | Esophagus | ESCC | 6.62e-20 | 3.57e-01 | 0.1067 |
| 5827 | PXMP2 | P48T-E | Human | Esophagus | ESCC | 8.56e-12 | 2.35e-01 | 0.0959 |
| 5827 | PXMP2 | P49T-E | Human | Esophagus | ESCC | 3.27e-07 | 5.53e-01 | 0.1768 |
| 5827 | PXMP2 | P52T-E | Human | Esophagus | ESCC | 6.36e-33 | 6.89e-01 | 0.1555 |
| 5827 | PXMP2 | P54T-E | Human | Esophagus | ESCC | 4.33e-15 | 3.70e-01 | 0.0975 |
| 5827 | PXMP2 | P56T-E | Human | Esophagus | ESCC | 4.36e-03 | 6.53e-01 | 0.1613 |
| 5827 | PXMP2 | P57T-E | Human | Esophagus | ESCC | 2.26e-16 | 2.92e-01 | 0.0926 |
| Page: 1 2 3 4 5 |
| Tissue | Expression Dynamics | Abbreviation |
| Esophagus | 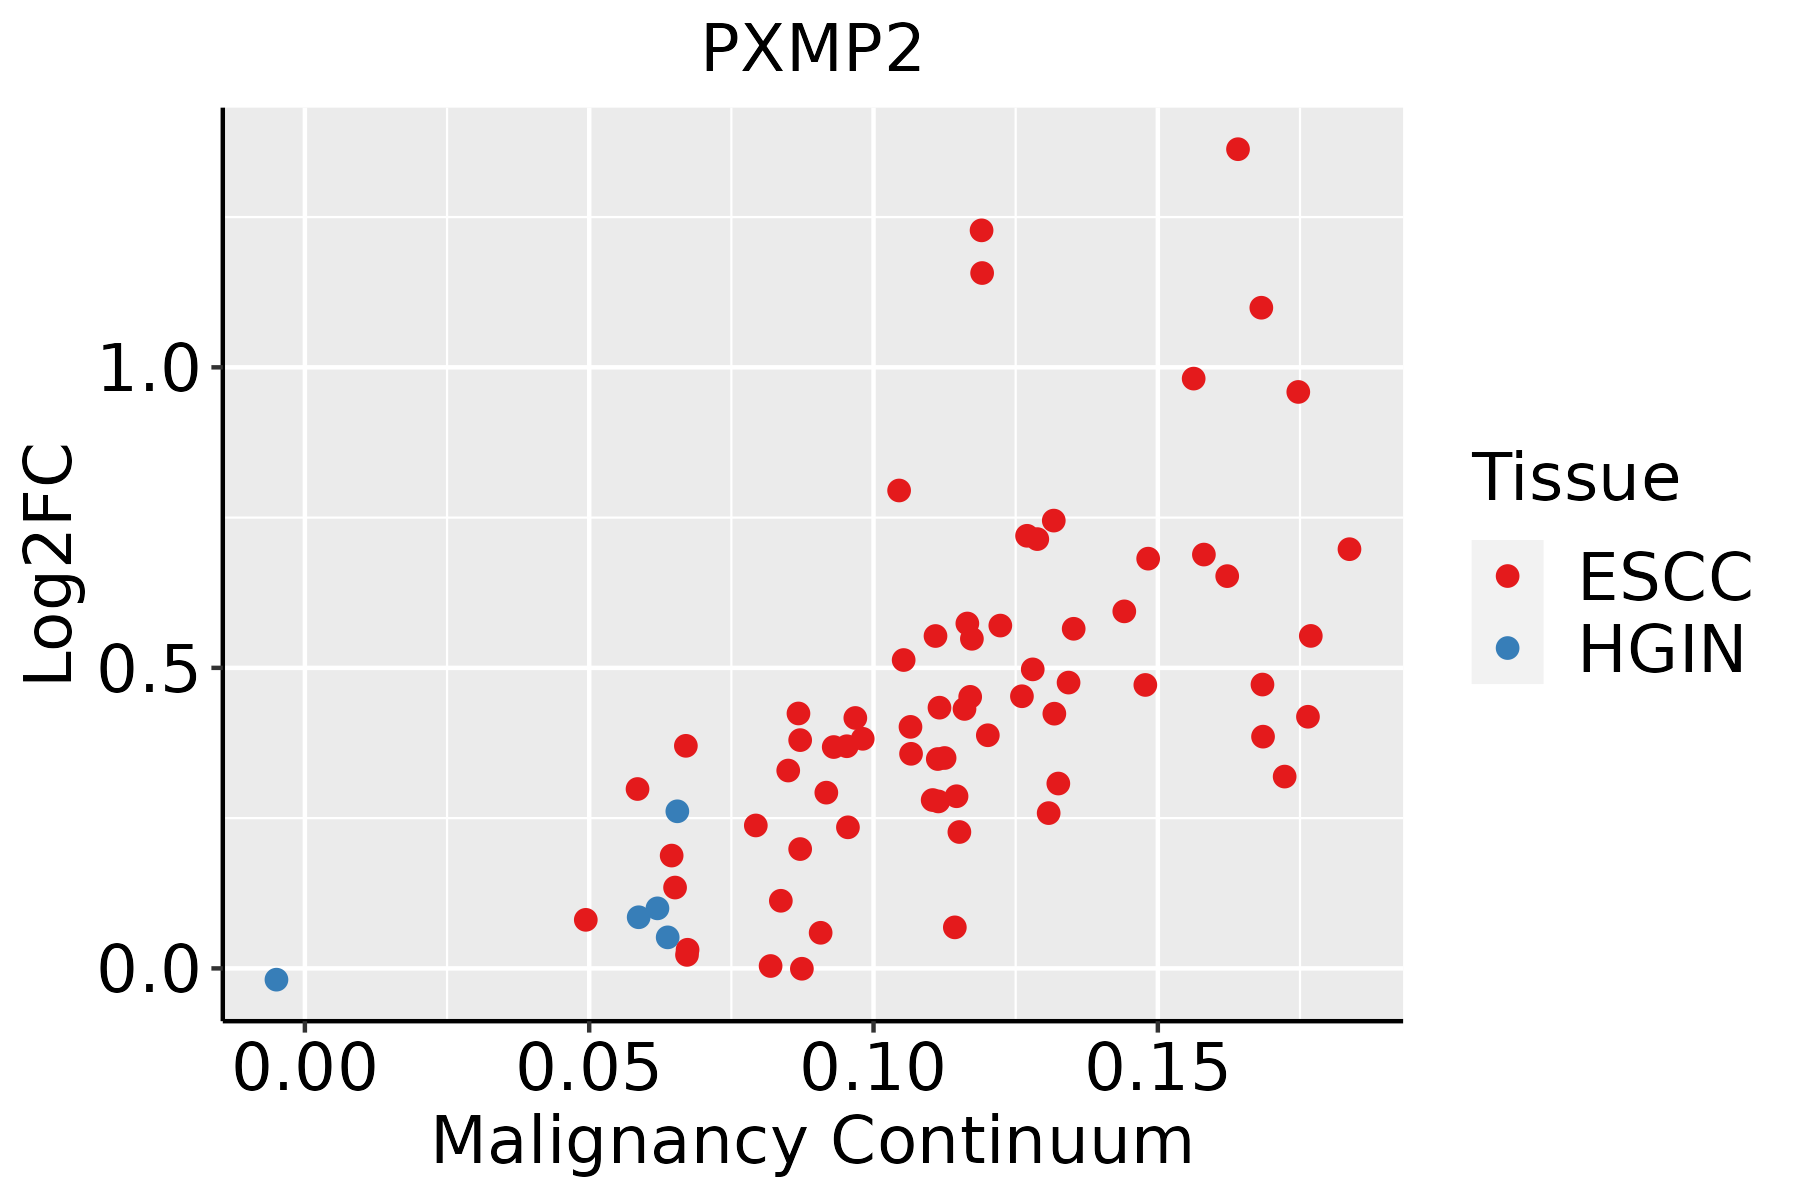 | ESCC: Esophageal squamous cell carcinoma |
| HGIN: High-grade intraepithelial neoplasias | ||
| LGIN: Low-grade intraepithelial neoplasias | ||
| Liver | 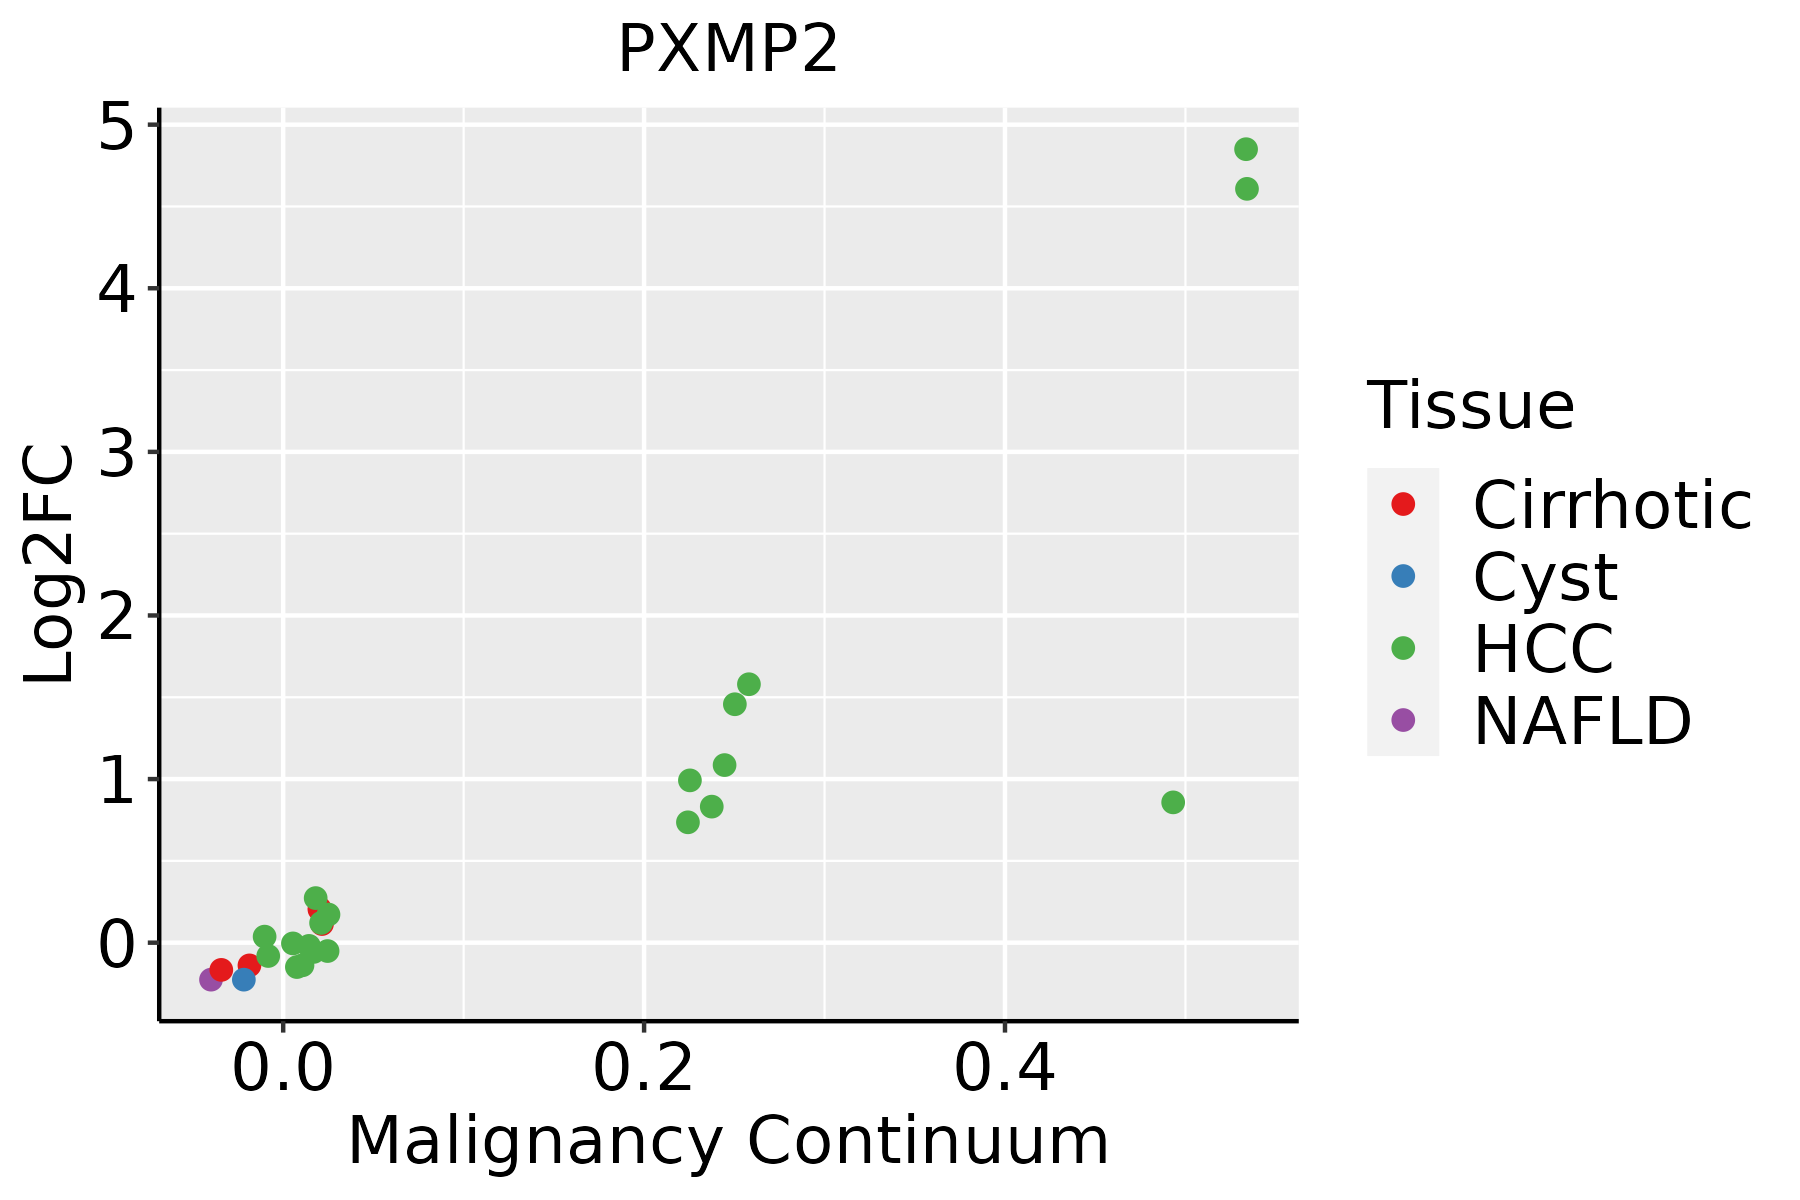 | HCC: Hepatocellular carcinoma |
| NAFLD: Non-alcoholic fatty liver disease | ||
| Oral Cavity | 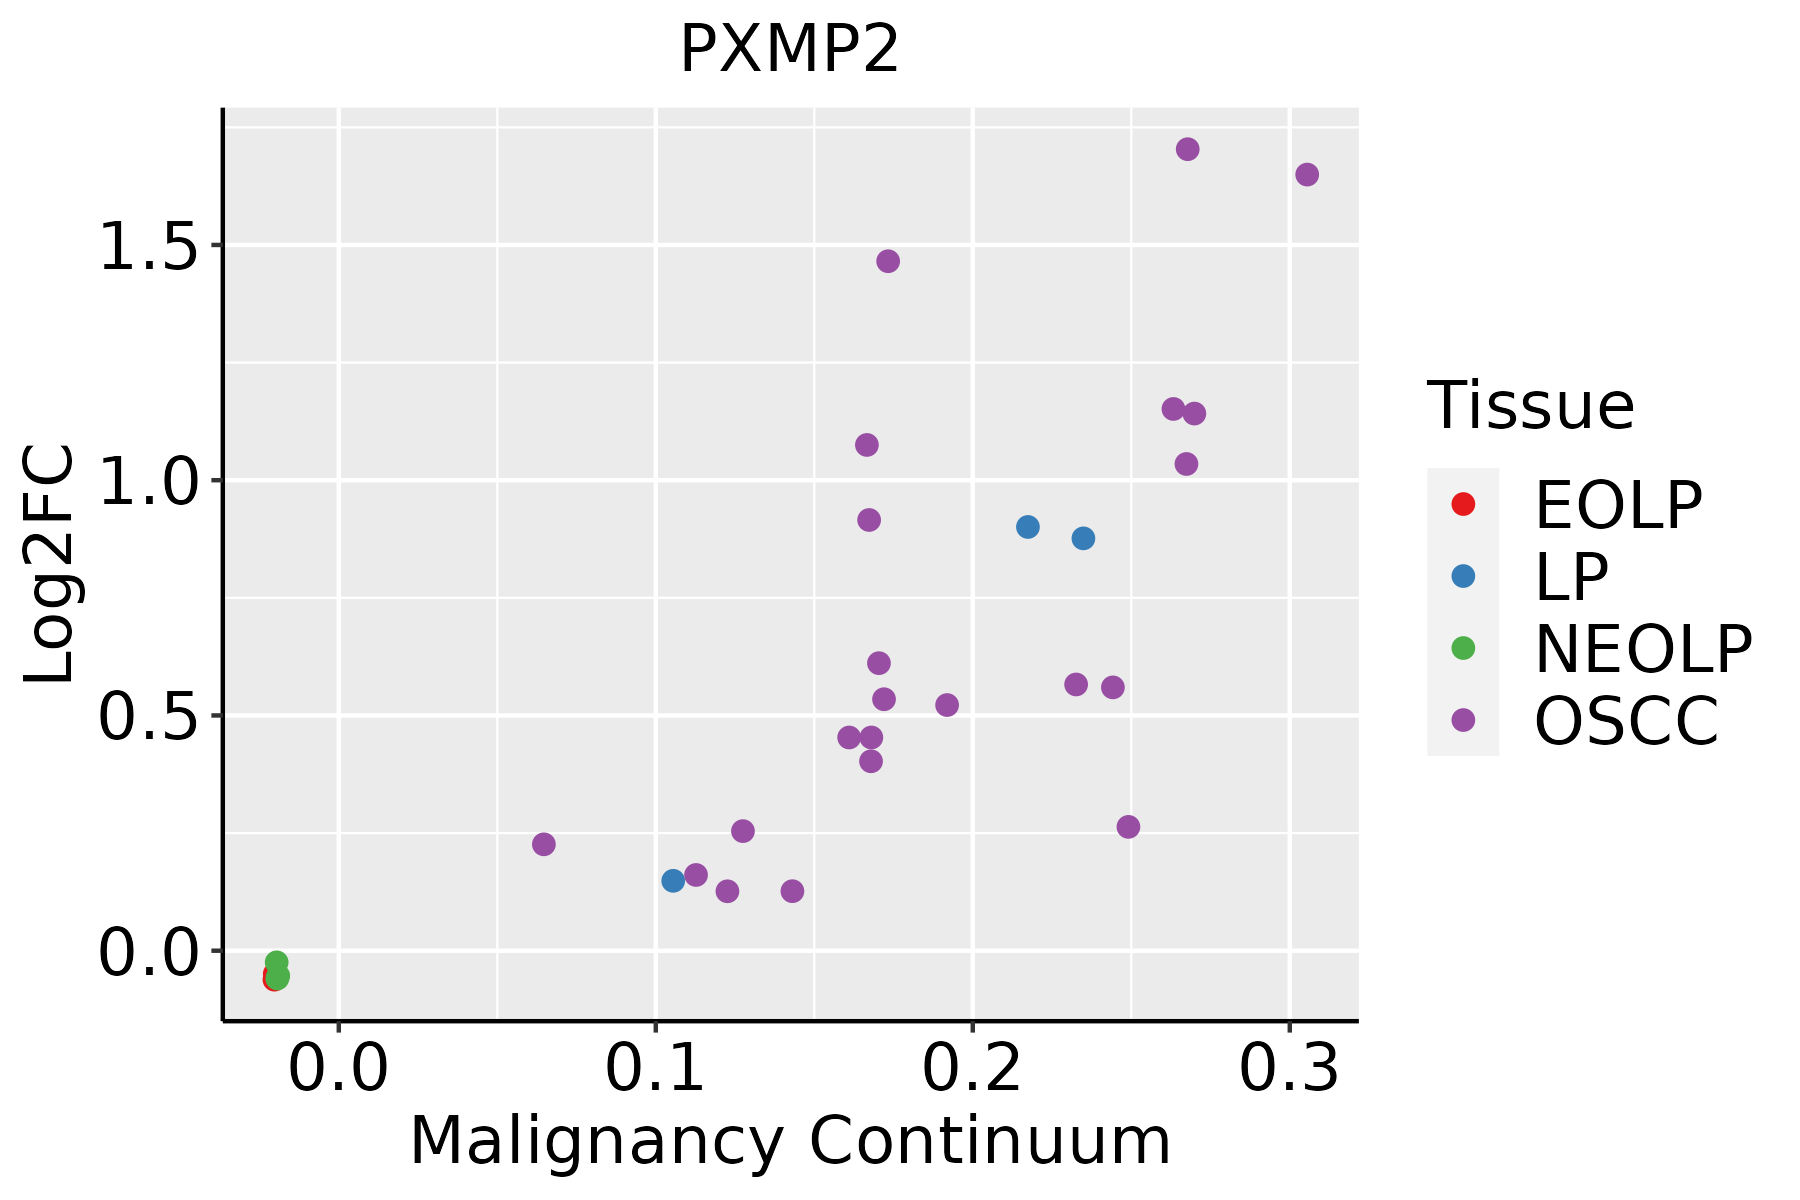 | EOLP: Erosive Oral lichen planus |
| LP: leukoplakia | ||
| NEOLP: Non-erosive oral lichen planus | ||
| OSCC: Oral squamous cell carcinoma | ||
| Skin |  | AK: Actinic keratosis |
| cSCC: Cutaneous squamous cell carcinoma | ||
| SCCIS:squamous cell carcinoma in situ |
| ∗log2FC in expression of this searched gene in stem-like cells from each diseased tissue sample relative to stem-like cells in normal samples in each tissue plotted against the malignancy continuum. Samples are colored based on if they are from different disease stage. |
Top |
Malignant transformation related pathway analysis |
| Find out the enriched GO biological processes and KEGG pathways involved in transition from healthy to precancer to cancer |
| Tissue | Disease Stage | Enriched GO biological Processes |
| Colorectum | AD |  |
| Colorectum | SER |  |
| Colorectum | MSS |  |
| Colorectum | MSI-H |  |
| Colorectum | FAP |  |
| ∗Top 15 enriched GO BP terms are showed in the bar plot of each disease state in each tissue. Each row represents a significant GO biological process which is colored according to the -log10(p.adjust). |
| Page: 1 2 3 4 5 6 7 8 9 |
| GO ID | Tissue | Disease Stage | Description | Gene Ratio | Bg Ratio | pvalue | p.adjust | Count |
| Page: 1 |
| Pathway ID | Tissue | Disease Stage | Description | Gene Ratio | Bg Ratio | pvalue | p.adjust | qvalue | Count |
| hsa041467 | Esophagus | ESCC | Peroxisome | 55/4205 | 82/8465 | 1.04e-03 | 3.27e-03 | 1.68e-03 | 55 |
| hsa0414612 | Esophagus | ESCC | Peroxisome | 55/4205 | 82/8465 | 1.04e-03 | 3.27e-03 | 1.68e-03 | 55 |
| hsa041462 | Liver | Cirrhotic | Peroxisome | 36/2530 | 82/8465 | 4.79e-03 | 1.74e-02 | 1.07e-02 | 36 |
| hsa041463 | Liver | Cirrhotic | Peroxisome | 36/2530 | 82/8465 | 4.79e-03 | 1.74e-02 | 1.07e-02 | 36 |
| hsa041464 | Liver | HCC | Peroxisome | 58/4020 | 82/8465 | 1.57e-05 | 1.05e-04 | 5.85e-05 | 58 |
| hsa041465 | Liver | HCC | Peroxisome | 58/4020 | 82/8465 | 1.57e-05 | 1.05e-04 | 5.85e-05 | 58 |
| hsa041466 | Oral cavity | OSCC | Peroxisome | 47/3704 | 82/8465 | 9.01e-03 | 2.01e-02 | 1.03e-02 | 47 |
| hsa0414611 | Oral cavity | OSCC | Peroxisome | 47/3704 | 82/8465 | 9.01e-03 | 2.01e-02 | 1.03e-02 | 47 |
| Page: 1 |
Top |
Cell-cell communication analysis |
| Identification of potential cell-cell interactions between two cell types and their ligand-receptor pairs for different disease states |
| Ligand | Receptor | LRpair | Pathway | Tissue | Disease Stage |
| Page: 1 |
Top |
Single-cell gene regulatory network inference analysis |
| Find out the significant the regulons (TFs) and the target genes of each regulon across cell types for different disease states |
| TF | Cell Type | Tissue | Disease Stage | Target Gene | RSS | Regulon Activity |
| ∗The dot plots of a searched regulon are shown for all cell subpopulations in each disease state of each tissue based on the regulon specific score inferred using pySCENIC and by calculating the average expression. |
| Page: 1 |
Top |
Somatic mutation of malignant transformation related genes |
| Annotation of somatic variants for genes involved in malignant transformation |
| Hugo Symbol | Variant Class | Variant Classification | dbSNP RS | HGVSc | HGVSp | HGVSp Short | SWISSPROT | BIOTYPE | SIFT | PolyPhen | Tumor Sample Barcode | Tissue | Histology | Sex | Age | Stage | Therapy Types | Drugs | Outcome |
| PXMP2 | SNV | Missense_Mutation | novel | c.171N>T | p.Lys57Asn | p.K57N | Q9NR77 | protein_coding | tolerated(0.05) | benign(0.17) | TCGA-AN-A046-01 | Breast | breast invasive carcinoma | Female | >=65 | I/II | Unknown | Unknown | SD |
| PXMP2 | SNV | Missense_Mutation | c.267C>G | p.Phe89Leu | p.F89L | Q9NR77 | protein_coding | tolerated(0.18) | benign(0.005) | TCGA-MY-A5BE-01 | Cervix | cervical & endocervical cancer | Female | <65 | I/II | Unknown | Unknown | SD | |
| PXMP2 | SNV | Missense_Mutation | rs746666562 | c.346G>A | p.Val116Ile | p.V116I | Q9NR77 | protein_coding | tolerated(1) | benign(0.001) | TCGA-VS-A94Z-01 | Cervix | cervical & endocervical cancer | Female | <65 | I/II | Chemotherapy | cisplatin | CR |
| PXMP2 | SNV | Missense_Mutation | rs765325030 | c.340N>T | p.Arg114Cys | p.R114C | Q9NR77 | protein_coding | deleterious(0) | probably_damaging(0.992) | TCGA-A6-6781-01 | Colorectum | colon adenocarcinoma | Male | <65 | III/IV | Chemotherapy | oxaliplatin | SD |
| PXMP2 | SNV | Missense_Mutation | c.562G>A | p.Ala188Thr | p.A188T | Q9NR77 | protein_coding | tolerated(0.44) | benign(0.027) | TCGA-AD-6889-01 | Colorectum | colon adenocarcinoma | Male | >=65 | I/II | Chemotherapy | xeloda | PD | |
| PXMP2 | SNV | Missense_Mutation | rs200781916 | c.176N>A | p.Arg59Gln | p.R59Q | Q9NR77 | protein_coding | tolerated(0.51) | benign(0.005) | TCGA-D5-6928-01 | Colorectum | colon adenocarcinoma | Male | >=65 | I/II | Unknown | Unknown | SD |
| PXMP2 | deletion | Frame_Shift_Del | novel | c.178delN | p.Glu62LysfsTer12 | p.E62Kfs*12 | Q9NR77 | protein_coding | TCGA-AA-3949-01 | Colorectum | colon adenocarcinoma | Female | >=65 | III/IV | Unknown | Unknown | SD | ||
| PXMP2 | SNV | Missense_Mutation | rs746666562 | c.346G>A | p.Val116Ile | p.V116I | Q9NR77 | protein_coding | tolerated(1) | benign(0.001) | TCGA-A5-A0G2-01 | Endometrium | uterine corpus endometrioid carcinoma | Female | <65 | III/IV | Unknown | Unknown | SD |
| PXMP2 | SNV | Missense_Mutation | rs201360859 | c.421G>A | p.Ala141Thr | p.A141T | Q9NR77 | protein_coding | tolerated(0.49) | benign(0.143) | TCGA-A5-A0G2-01 | Endometrium | uterine corpus endometrioid carcinoma | Female | <65 | III/IV | Unknown | Unknown | SD |
| PXMP2 | SNV | Missense_Mutation | novel | c.356N>A | p.Pro119Gln | p.P119Q | Q9NR77 | protein_coding | deleterious(0) | probably_damaging(1) | TCGA-AP-A0LS-01 | Endometrium | uterine corpus endometrioid carcinoma | Female | <65 | I/II | Unknown | Unknown | SD |
| Page: 1 2 |
Top |
Related drugs of malignant transformation related genes |
| Identification of chemicals and drugs interact with genes involved in malignant transfromation |
| (DGIdb 4.0) |
| Entrez ID | Symbol | Category | Interaction Types | Drug Claim Name | Drug Name | PMIDs |
| Page: 1 |

Copyright 2023-Present -The University of Texas Health Science Center at Houston |