
|
|||||
|
 | |
| |
| |
| |
| |
| |
|
Gene: PWWP3A |
Gene summary for PWWP3A |
| Gene information | Species | Human | Gene symbol | PWWP3A | Gene ID | 84939 |
| Gene name | PWWP domain containing 3A, DNA repair factor | |
| Gene Alias | EXPAND1 | |
| Cytomap | 19p13.3 | |
| Gene Type | protein-coding | GO ID | GO:0006139 | UniProtAcc | J3KNX4 |
Top |
Malignant transformation analysis |
| Identification of the aberrant gene expression in precancerous and cancerous lesions by comparing the gene expression of stem-like cells in diseased tissues with normal stem cells |
| Entrez ID | Symbol | Replicates | Species | Organ | Tissue | Adj P-value | Log2FC | Malignancy |
| 84939 | PWWP3A | HTA11_6818_2000001011 | Human | Colorectum | AD | 1.11e-02 | 1.82e-01 | 0.0112 |
| 84939 | PWWP3A | HTA11_6818_2000001021 | Human | Colorectum | AD | 3.40e-07 | 2.65e-01 | 0.0588 |
| 84939 | PWWP3A | LZE2T | Human | Esophagus | ESCC | 3.94e-07 | 6.08e-01 | 0.082 |
| 84939 | PWWP3A | LZE4T | Human | Esophagus | ESCC | 5.73e-13 | 4.06e-01 | 0.0811 |
| 84939 | PWWP3A | LZE5T | Human | Esophagus | ESCC | 1.57e-02 | 2.22e-01 | 0.0514 |
| 84939 | PWWP3A | LZE7T | Human | Esophagus | ESCC | 6.11e-12 | 3.83e-01 | 0.0667 |
| 84939 | PWWP3A | LZE8T | Human | Esophagus | ESCC | 1.10e-02 | 1.21e-01 | 0.067 |
| 84939 | PWWP3A | LZE20T | Human | Esophagus | ESCC | 1.74e-07 | 2.40e-01 | 0.0662 |
| 84939 | PWWP3A | LZE22D1 | Human | Esophagus | HGIN | 8.03e-04 | 2.19e-01 | 0.0595 |
| 84939 | PWWP3A | LZE22T | Human | Esophagus | ESCC | 8.47e-11 | 5.15e-01 | 0.068 |
| 84939 | PWWP3A | LZE24T | Human | Esophagus | ESCC | 7.85e-14 | 2.98e-01 | 0.0596 |
| 84939 | PWWP3A | LZE21T | Human | Esophagus | ESCC | 1.78e-08 | 4.69e-01 | 0.0655 |
| 84939 | PWWP3A | RNA-P17T-P17T-6 | Human | Lung | IAC | 1.48e-03 | 4.66e-01 | 0.3385 |
| 84939 | PWWP3A | RNA-P17T-P17T-8 | Human | Lung | IAC | 1.55e-04 | 4.38e-01 | 0.3329 |
| 84939 | PWWP3A | RNA-P6T1-P6T1-1 | Human | Lung | MIAC | 3.00e-03 | 5.93e-01 | -0.0238 |
| 84939 | PWWP3A | RNA-P6T1-P6T1-2 | Human | Lung | MIAC | 4.12e-03 | 6.17e-01 | -0.0186 |
| 84939 | PWWP3A | RNA-P6T1-P6T1-3 | Human | Lung | MIAC | 3.47e-02 | 6.29e-01 | -0.0296 |
| 84939 | PWWP3A | RNA-P6T1-P6T1-4 | Human | Lung | MIAC | 3.02e-07 | 7.84e-01 | -0.0263 |
| Page: 1 2 |
| Tissue | Expression Dynamics | Abbreviation |
| Colorectum (GSE201348) |  | FAP: Familial adenomatous polyposis |
| CRC: Colorectal cancer | ||
| Colorectum (HTA11) |  | AD: Adenomas |
| SER: Sessile serrated lesions | ||
| MSI-H: Microsatellite-high colorectal cancer | ||
| MSS: Microsatellite stable colorectal cancer | ||
| Esophagus |  | ESCC: Esophageal squamous cell carcinoma |
| HGIN: High-grade intraepithelial neoplasias | ||
| LGIN: Low-grade intraepithelial neoplasias | ||
| Lung | 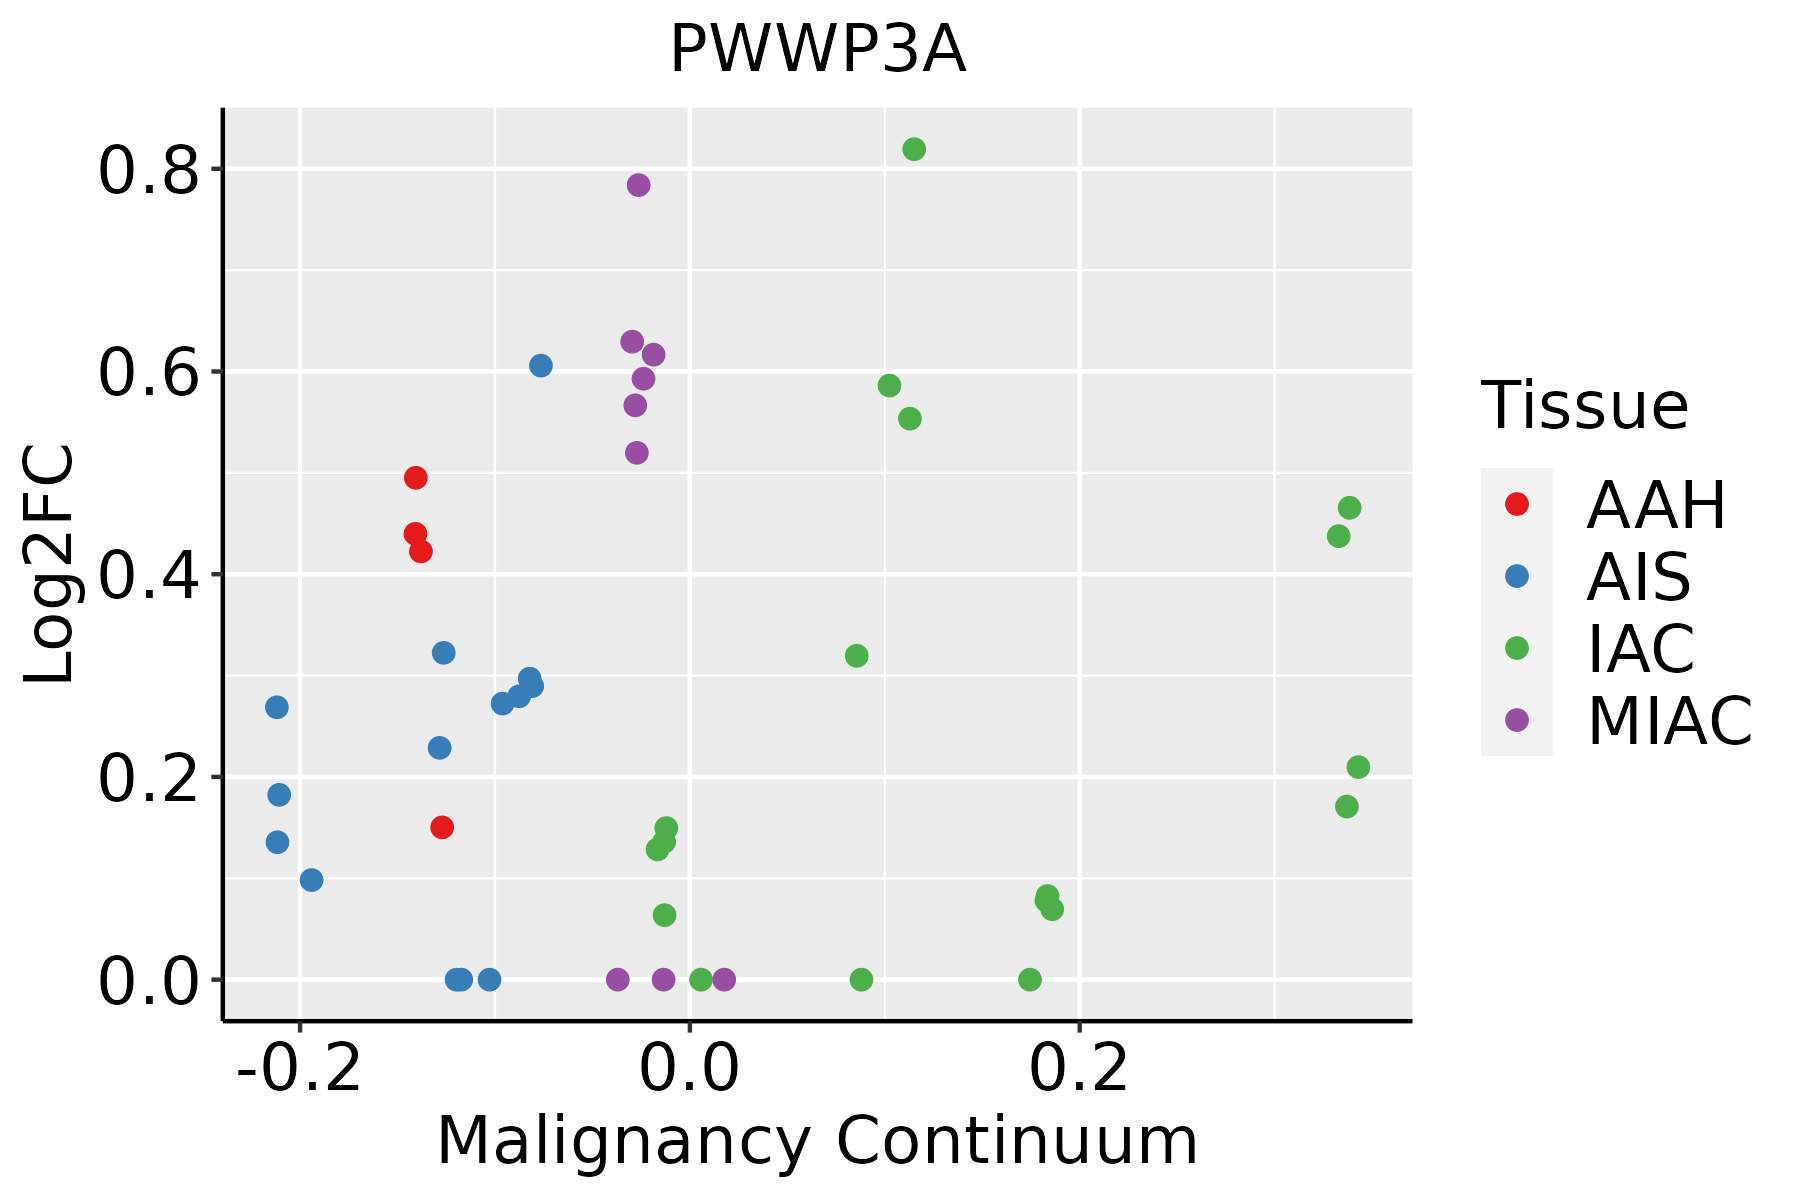 | AAH: Atypical adenomatous hyperplasia |
| AIS: Adenocarcinoma in situ | ||
| IAC: Invasive lung adenocarcinoma | ||
| MIA: Minimally invasive adenocarcinoma |
| ∗log2FC in expression of this searched gene in stem-like cells from each diseased tissue sample relative to stem-like cells in normal samples in each tissue plotted against the malignancy continuum. Samples are colored based on if they are from different disease stage. |
Top |
Malignant transformation related pathway analysis |
| Find out the enriched GO biological processes and KEGG pathways involved in transition from healthy to precancer to cancer |
| Tissue | Disease Stage | Enriched GO biological Processes |
| Colorectum | AD |  |
| Colorectum | SER |  |
| Colorectum | MSS |  |
| Colorectum | MSI-H |  |
| Colorectum | FAP |  |
| ∗Top 15 enriched GO BP terms are showed in the bar plot of each disease state in each tissue. Each row represents a significant GO biological process which is colored according to the -log10(p.adjust). |
| Page: 1 2 3 4 5 6 7 8 9 |
| GO ID | Tissue | Disease Stage | Description | Gene Ratio | Bg Ratio | pvalue | p.adjust | Count |
| GO:0006325 | Colorectum | AD | chromatin organization | 119/3918 | 409/18723 | 4.85e-05 | 8.33e-04 | 119 |
| GO:00063251 | Colorectum | SER | chromatin organization | 89/2897 | 409/18723 | 4.15e-04 | 6.17e-03 | 89 |
| GO:000632516 | Esophagus | HGIN | chromatin organization | 92/2587 | 409/18723 | 1.05e-06 | 4.16e-05 | 92 |
| GO:000632517 | Esophagus | ESCC | chromatin organization | 240/8552 | 409/18723 | 6.52e-08 | 1.14e-06 | 240 |
| GO:00063256 | Lung | IAC | chromatin organization | 69/2061 | 409/18723 | 2.01e-04 | 3.53e-03 | 69 |
| Page: 1 |
| Pathway ID | Tissue | Disease Stage | Description | Gene Ratio | Bg Ratio | pvalue | p.adjust | qvalue | Count |
| Page: 1 |
Top |
Cell-cell communication analysis |
| Identification of potential cell-cell interactions between two cell types and their ligand-receptor pairs for different disease states |
| Ligand | Receptor | LRpair | Pathway | Tissue | Disease Stage |
| Page: 1 |
Top |
Single-cell gene regulatory network inference analysis |
| Find out the significant the regulons (TFs) and the target genes of each regulon across cell types for different disease states |
| TF | Cell Type | Tissue | Disease Stage | Target Gene | RSS | Regulon Activity |
| ∗The dot plots of a searched regulon are shown for all cell subpopulations in each disease state of each tissue based on the regulon specific score inferred using pySCENIC and by calculating the average expression. |
| Page: 1 |
Top |
Somatic mutation of malignant transformation related genes |
| Annotation of somatic variants for genes involved in malignant transformation |
| Hugo Symbol | Variant Class | Variant Classification | dbSNP RS | HGVSc | HGVSp | HGVSp Short | SWISSPROT | BIOTYPE | SIFT | PolyPhen | Tumor Sample Barcode | Tissue | Histology | Sex | Age | Stage | Therapy Types | Drugs | Outcome |
| Page: 1 |
Top |
Related drugs of malignant transformation related genes |
| Identification of chemicals and drugs interact with genes involved in malignant transfromation |
| (DGIdb 4.0) |
| Entrez ID | Symbol | Category | Interaction Types | Drug Claim Name | Drug Name | PMIDs |
| Page: 1 |

Copyright 2023-Present -The University of Texas Health Science Center at Houston |