
|
|||||
|
 | |
| |
| |
| |
| |
| |
|
Gene: PSMC3IP |
Gene summary for PSMC3IP |
| Gene information | Species | Human | Gene symbol | PSMC3IP | Gene ID | 29893 |
| Gene name | PSMC3 interacting protein | |
| Gene Alias | GT198 | |
| Cytomap | 17q21.2 | |
| Gene Type | protein-coding | GO ID | GO:0000003 | UniProtAcc | K7ERB6 |
Top |
Malignant transformation analysis |
| Identification of the aberrant gene expression in precancerous and cancerous lesions by comparing the gene expression of stem-like cells in diseased tissues with normal stem cells |
| Entrez ID | Symbol | Replicates | Species | Organ | Tissue | Adj P-value | Log2FC | Malignancy |
| 29893 | PSMC3IP | P65T-E | Human | Esophagus | ESCC | 2.06e-03 | 9.88e-02 | 0.0978 |
| 29893 | PSMC3IP | P74T-E | Human | Esophagus | ESCC | 2.66e-02 | 1.13e-01 | 0.1479 |
| 29893 | PSMC3IP | P76T-E | Human | Esophagus | ESCC | 2.90e-08 | 2.32e-01 | 0.1207 |
| 29893 | PSMC3IP | P79T-E | Human | Esophagus | ESCC | 1.59e-09 | 1.94e-01 | 0.1154 |
| 29893 | PSMC3IP | P80T-E | Human | Esophagus | ESCC | 1.26e-02 | 1.03e-01 | 0.155 |
| 29893 | PSMC3IP | P83T-E | Human | Esophagus | ESCC | 3.19e-16 | 5.12e-01 | 0.1738 |
| 29893 | PSMC3IP | P89T-E | Human | Esophagus | ESCC | 5.72e-07 | 3.76e-01 | 0.1752 |
| 29893 | PSMC3IP | P91T-E | Human | Esophagus | ESCC | 5.34e-06 | 6.02e-01 | 0.1828 |
| 29893 | PSMC3IP | P107T-E | Human | Esophagus | ESCC | 1.53e-11 | 2.84e-01 | 0.171 |
| 29893 | PSMC3IP | P128T-E | Human | Esophagus | ESCC | 1.88e-06 | 1.98e-01 | 0.1241 |
| 29893 | PSMC3IP | P130T-E | Human | Esophagus | ESCC | 3.10e-12 | 3.40e-01 | 0.1676 |
| 29893 | PSMC3IP | C04 | Human | Oral cavity | OSCC | 7.83e-08 | 6.59e-01 | 0.2633 |
| 29893 | PSMC3IP | C21 | Human | Oral cavity | OSCC | 8.16e-15 | 5.97e-01 | 0.2678 |
| 29893 | PSMC3IP | C30 | Human | Oral cavity | OSCC | 5.41e-17 | 1.19e+00 | 0.3055 |
| 29893 | PSMC3IP | C38 | Human | Oral cavity | OSCC | 9.92e-03 | 3.64e-01 | 0.172 |
| 29893 | PSMC3IP | C43 | Human | Oral cavity | OSCC | 2.33e-37 | 6.39e-01 | 0.1704 |
| 29893 | PSMC3IP | C46 | Human | Oral cavity | OSCC | 1.32e-20 | 4.35e-01 | 0.1673 |
| 29893 | PSMC3IP | C51 | Human | Oral cavity | OSCC | 7.79e-08 | 6.37e-01 | 0.2674 |
| 29893 | PSMC3IP | C57 | Human | Oral cavity | OSCC | 8.11e-06 | 3.23e-01 | 0.1679 |
| 29893 | PSMC3IP | C06 | Human | Oral cavity | OSCC | 2.46e-03 | 7.63e-01 | 0.2699 |
| Page: 1 2 3 |
| Tissue | Expression Dynamics | Abbreviation |
| Esophagus |  | ESCC: Esophageal squamous cell carcinoma |
| HGIN: High-grade intraepithelial neoplasias | ||
| LGIN: Low-grade intraepithelial neoplasias | ||
| Oral Cavity | 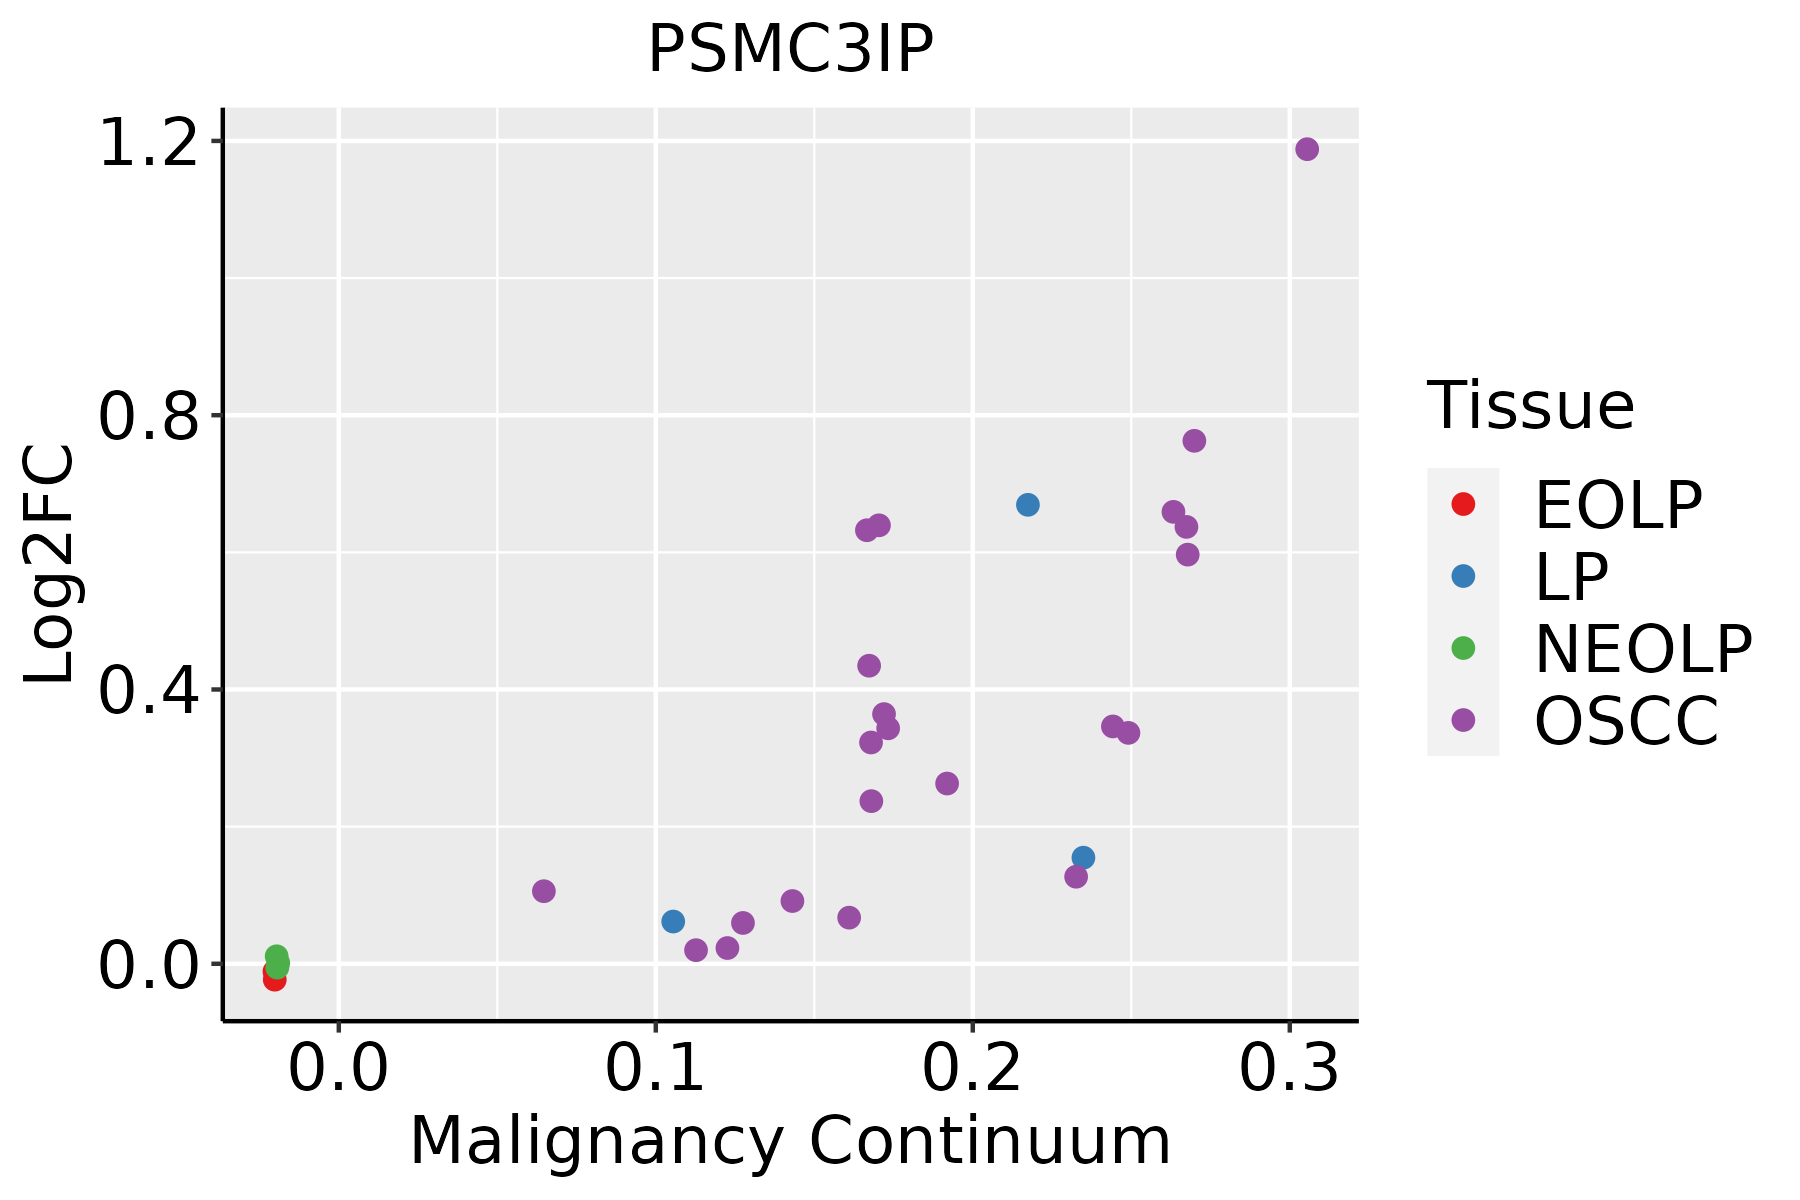 | EOLP: Erosive Oral lichen planus |
| LP: leukoplakia | ||
| NEOLP: Non-erosive oral lichen planus | ||
| OSCC: Oral squamous cell carcinoma |
| ∗log2FC in expression of this searched gene in stem-like cells from each diseased tissue sample relative to stem-like cells in normal samples in each tissue plotted against the malignancy continuum. Samples are colored based on if they are from different disease stage. |
Top |
Malignant transformation related pathway analysis |
| Find out the enriched GO biological processes and KEGG pathways involved in transition from healthy to precancer to cancer |
| Tissue | Disease Stage | Enriched GO biological Processes |
| Colorectum | AD |  |
| Colorectum | SER |  |
| Colorectum | MSS |  |
| Colorectum | MSI-H |  |
| Colorectum | FAP |  |
| ∗Top 15 enriched GO BP terms are showed in the bar plot of each disease state in each tissue. Each row represents a significant GO biological process which is colored according to the -log10(p.adjust). |
| Page: 1 2 3 4 5 6 7 8 9 |
| GO ID | Tissue | Disease Stage | Description | Gene Ratio | Bg Ratio | pvalue | p.adjust | Count |
| GO:000705911 | Esophagus | ESCC | chromosome segregation | 238/8552 | 346/18723 | 1.72e-18 | 1.82e-16 | 238 |
| GO:00482853 | Esophagus | ESCC | organelle fission | 301/8552 | 488/18723 | 4.64e-13 | 2.12e-11 | 301 |
| GO:00988133 | Esophagus | ESCC | nuclear chromosome segregation | 187/8552 | 281/18723 | 1.00e-12 | 4.36e-11 | 187 |
| GO:00002802 | Esophagus | ESCC | nuclear division | 270/8552 | 439/18723 | 1.17e-11 | 4.24e-10 | 270 |
| GO:00063101 | Esophagus | ESCC | DNA recombination | 168/8552 | 305/18723 | 5.58e-04 | 3.05e-03 | 168 |
| GO:00070592 | Oral cavity | OSCC | chromosome segregation | 206/7305 | 346/18723 | 5.82e-15 | 3.76e-13 | 206 |
| GO:00482852 | Oral cavity | OSCC | organelle fission | 265/7305 | 488/18723 | 3.22e-12 | 1.27e-10 | 265 |
| GO:00002801 | Oral cavity | OSCC | nuclear division | 237/7305 | 439/18723 | 9.62e-11 | 2.90e-09 | 237 |
| GO:00988132 | Oral cavity | OSCC | nuclear chromosome segregation | 162/7305 | 281/18723 | 1.56e-10 | 4.56e-09 | 162 |
| GO:0006310 | Oral cavity | OSCC | DNA recombination | 147/7305 | 305/18723 | 6.33e-04 | 3.56e-03 | 147 |
| Page: 1 |
| Pathway ID | Tissue | Disease Stage | Description | Gene Ratio | Bg Ratio | pvalue | p.adjust | qvalue | Count |
| Page: 1 |
Top |
Cell-cell communication analysis |
| Identification of potential cell-cell interactions between two cell types and their ligand-receptor pairs for different disease states |
| Ligand | Receptor | LRpair | Pathway | Tissue | Disease Stage |
| Page: 1 |
Top |
Single-cell gene regulatory network inference analysis |
| Find out the significant the regulons (TFs) and the target genes of each regulon across cell types for different disease states |
| TF | Cell Type | Tissue | Disease Stage | Target Gene | RSS | Regulon Activity |
| ∗The dot plots of a searched regulon are shown for all cell subpopulations in each disease state of each tissue based on the regulon specific score inferred using pySCENIC and by calculating the average expression. |
| Page: 1 |
Top |
Somatic mutation of malignant transformation related genes |
| Annotation of somatic variants for genes involved in malignant transformation |
| Hugo Symbol | Variant Class | Variant Classification | dbSNP RS | HGVSc | HGVSp | HGVSp Short | SWISSPROT | BIOTYPE | SIFT | PolyPhen | Tumor Sample Barcode | Tissue | Histology | Sex | Age | Stage | Therapy Types | Drugs | Outcome |
| PSMC3IP | SNV | Missense_Mutation | rs748070321 | c.617N>T | p.Thr206Met | p.T206M | Q9P2W1 | protein_coding | deleterious(0.03) | possibly_damaging(0.819) | TCGA-2W-A8YY-01 | Cervix | cervical & endocervical cancer | Female | <65 | I/II | Chemotherapy | cisplatin | CR |
| PSMC3IP | SNV | Missense_Mutation | novel | c.207N>T | p.Lys69Asn | p.K69N | Q9P2W1 | protein_coding | deleterious(0.03) | possibly_damaging(0.896) | TCGA-EI-6917-01 | Colorectum | rectum adenocarcinoma | Male | <65 | III/IV | Chemotherapy | 5fluorouracil+oxaciplatina+l-folinian | SD |
| PSMC3IP | insertion | Frame_Shift_Ins | novel | c.497_498insAG | p.Gln167GlyfsTer39 | p.Q167Gfs*39 | Q9P2W1 | protein_coding | TCGA-AA-3845-01 | Colorectum | colon adenocarcinoma | Female | >=65 | I/II | Unknown | Unknown | PD | ||
| PSMC3IP | SNV | Missense_Mutation | rs149230650 | c.634G>A | p.Val212Ile | p.V212I | Q9P2W1 | protein_coding | tolerated(0.05) | benign(0.119) | TCGA-AP-A0LM-01 | Endometrium | uterine corpus endometrioid carcinoma | Female | <65 | III/IV | Chemotherapy | cisplatin | SD |
| PSMC3IP | SNV | Missense_Mutation | c.209T>C | p.Ile70Thr | p.I70T | Q9P2W1 | protein_coding | deleterious(0) | probably_damaging(0.978) | TCGA-AX-A063-01 | Endometrium | uterine corpus endometrioid carcinoma | Female | <65 | I/II | Unknown | Unknown | SD | |
| PSMC3IP | SNV | Missense_Mutation | c.335N>T | p.Ala112Val | p.A112V | Q9P2W1 | protein_coding | tolerated(0.05) | benign(0.055) | TCGA-B5-A0JR-01 | Endometrium | uterine corpus endometrioid carcinoma | Female | >=65 | I/II | Unknown | Unknown | SD | |
| PSMC3IP | SNV | Missense_Mutation | c.272G>A | p.Gly91Asp | p.G91D | Q9P2W1 | protein_coding | tolerated(0.73) | benign(0) | TCGA-BG-A0VZ-01 | Endometrium | uterine corpus endometrioid carcinoma | Female | <65 | III/IV | Chemotherapy | cisplatin | CR | |
| PSMC3IP | SNV | Missense_Mutation | novel | c.521N>T | p.Arg174Met | p.R174M | Q9P2W1 | protein_coding | deleterious(0) | probably_damaging(0.959) | TCGA-DF-A2KU-01 | Endometrium | uterine corpus endometrioid carcinoma | Female | Unknown | I/II | Unknown | Unknown | SD |
| PSMC3IP | SNV | Missense_Mutation | rs200496950 | c.412G>A | p.Ala138Thr | p.A138T | Q9P2W1 | protein_coding | tolerated(0.36) | benign(0.01) | TCGA-EO-A22U-01 | Endometrium | uterine corpus endometrioid carcinoma | Female | >=65 | I/II | Unknown | Unknown | SD |
| PSMC3IP | SNV | Missense_Mutation | novel | c.596T>G | p.Phe199Cys | p.F199C | Q9P2W1 | protein_coding | tolerated(0.08) | possibly_damaging(0.497) | TCGA-EO-A3AV-01 | Endometrium | uterine corpus endometrioid carcinoma | Female | <65 | III/IV | Chemotherapy | carboplatin | CR |
| Page: 1 2 3 |
Top |
Related drugs of malignant transformation related genes |
| Identification of chemicals and drugs interact with genes involved in malignant transfromation |
| (DGIdb 4.0) |
| Entrez ID | Symbol | Category | Interaction Types | Drug Claim Name | Drug Name | PMIDs |
| 29893 | PSMC3IP | NUCLEAR HORMONE RECEPTOR | inhibitor | BORTEZOMIB | BORTEZOMIB | |
| 29893 | PSMC3IP | NUCLEAR HORMONE RECEPTOR | inhibitor | CARFILZOMIB | CARFILZOMIB |
| Page: 1 |

Copyright 2023-Present -The University of Texas Health Science Center at Houston |