
|
|||||
|
 | |
| |
| |
| |
| |
| |
|
Gene: PSMB3 |
Gene summary for PSMB3 |
| Gene information | Species | Human | Gene symbol | PSMB3 | Gene ID | 5691 |
| Gene name | proteasome 20S subunit beta 3 | |
| Gene Alias | HC10-II | |
| Cytomap | 17q12 | |
| Gene Type | protein-coding | GO ID | GO:0006508 | UniProtAcc | P49720 |
Top |
Malignant transformation analysis |
| Identification of the aberrant gene expression in precancerous and cancerous lesions by comparing the gene expression of stem-like cells in diseased tissues with normal stem cells |
| Entrez ID | Symbol | Replicates | Species | Organ | Tissue | Adj P-value | Log2FC | Malignancy |
| 5691 | PSMB3 | brca2 | Human | Breast | Precancer | 5.83e-32 | 6.41e-01 | -0.024 |
| 5691 | PSMB3 | brca3 | Human | Breast | Precancer | 7.24e-05 | 3.48e-01 | -0.0263 |
| 5691 | PSMB3 | NCCBC14 | Human | Breast | DCIS | 6.69e-18 | 2.04e-01 | 0.2021 |
| 5691 | PSMB3 | NCCBC5 | Human | Breast | DCIS | 4.92e-46 | 7.75e-01 | 0.2046 |
| 5691 | PSMB3 | NCCBC6 | Human | Breast | DCIS | 6.10e-08 | 6.11e-01 | 0.2095 |
| 5691 | PSMB3 | P1 | Human | Breast | IDC | 7.49e-29 | -3.29e-01 | 0.1527 |
| 5691 | PSMB3 | DCIS2 | Human | Breast | DCIS | 1.73e-51 | 2.03e-02 | 0.0085 |
| 5691 | PSMB3 | CA_HPV_1 | Human | Cervix | CC | 5.64e-07 | -5.49e-02 | 0.0264 |
| 5691 | PSMB3 | N_HPV_2 | Human | Cervix | N_HPV | 1.07e-03 | 2.07e-01 | -0.0131 |
| 5691 | PSMB3 | CCI_3 | Human | Cervix | CC | 5.92e-04 | -5.50e-01 | 0.516 |
| 5691 | PSMB3 | CCII_1 | Human | Cervix | CC | 6.82e-09 | -6.08e-01 | 0.3249 |
| 5691 | PSMB3 | Tumor | Human | Cervix | CC | 2.08e-15 | 4.52e-01 | 0.1241 |
| 5691 | PSMB3 | sample3 | Human | Cervix | CC | 1.17e-02 | 2.86e-01 | 0.1387 |
| 5691 | PSMB3 | T3 | Human | Cervix | CC | 8.35e-05 | 3.19e-01 | 0.1389 |
| 5691 | PSMB3 | HTA11_2487_2000001011 | Human | Colorectum | SER | 1.54e-15 | 5.65e-01 | -0.1808 |
| 5691 | PSMB3 | HTA11_1938_2000001011 | Human | Colorectum | AD | 2.95e-15 | 6.59e-01 | -0.0811 |
| 5691 | PSMB3 | HTA11_347_2000001011 | Human | Colorectum | AD | 2.31e-11 | 3.79e-01 | -0.1954 |
| 5691 | PSMB3 | HTA11_411_2000001011 | Human | Colorectum | SER | 5.77e-03 | 6.01e-01 | -0.2602 |
| 5691 | PSMB3 | HTA11_2112_2000001011 | Human | Colorectum | SER | 1.96e-04 | 5.21e-01 | -0.2196 |
| 5691 | PSMB3 | HTA11_3361_2000001011 | Human | Colorectum | AD | 1.84e-06 | 4.66e-01 | -0.1207 |
| Page: 1 2 3 4 5 6 7 8 9 10 11 12 13 |
| Tissue | Expression Dynamics | Abbreviation |
| Breast | 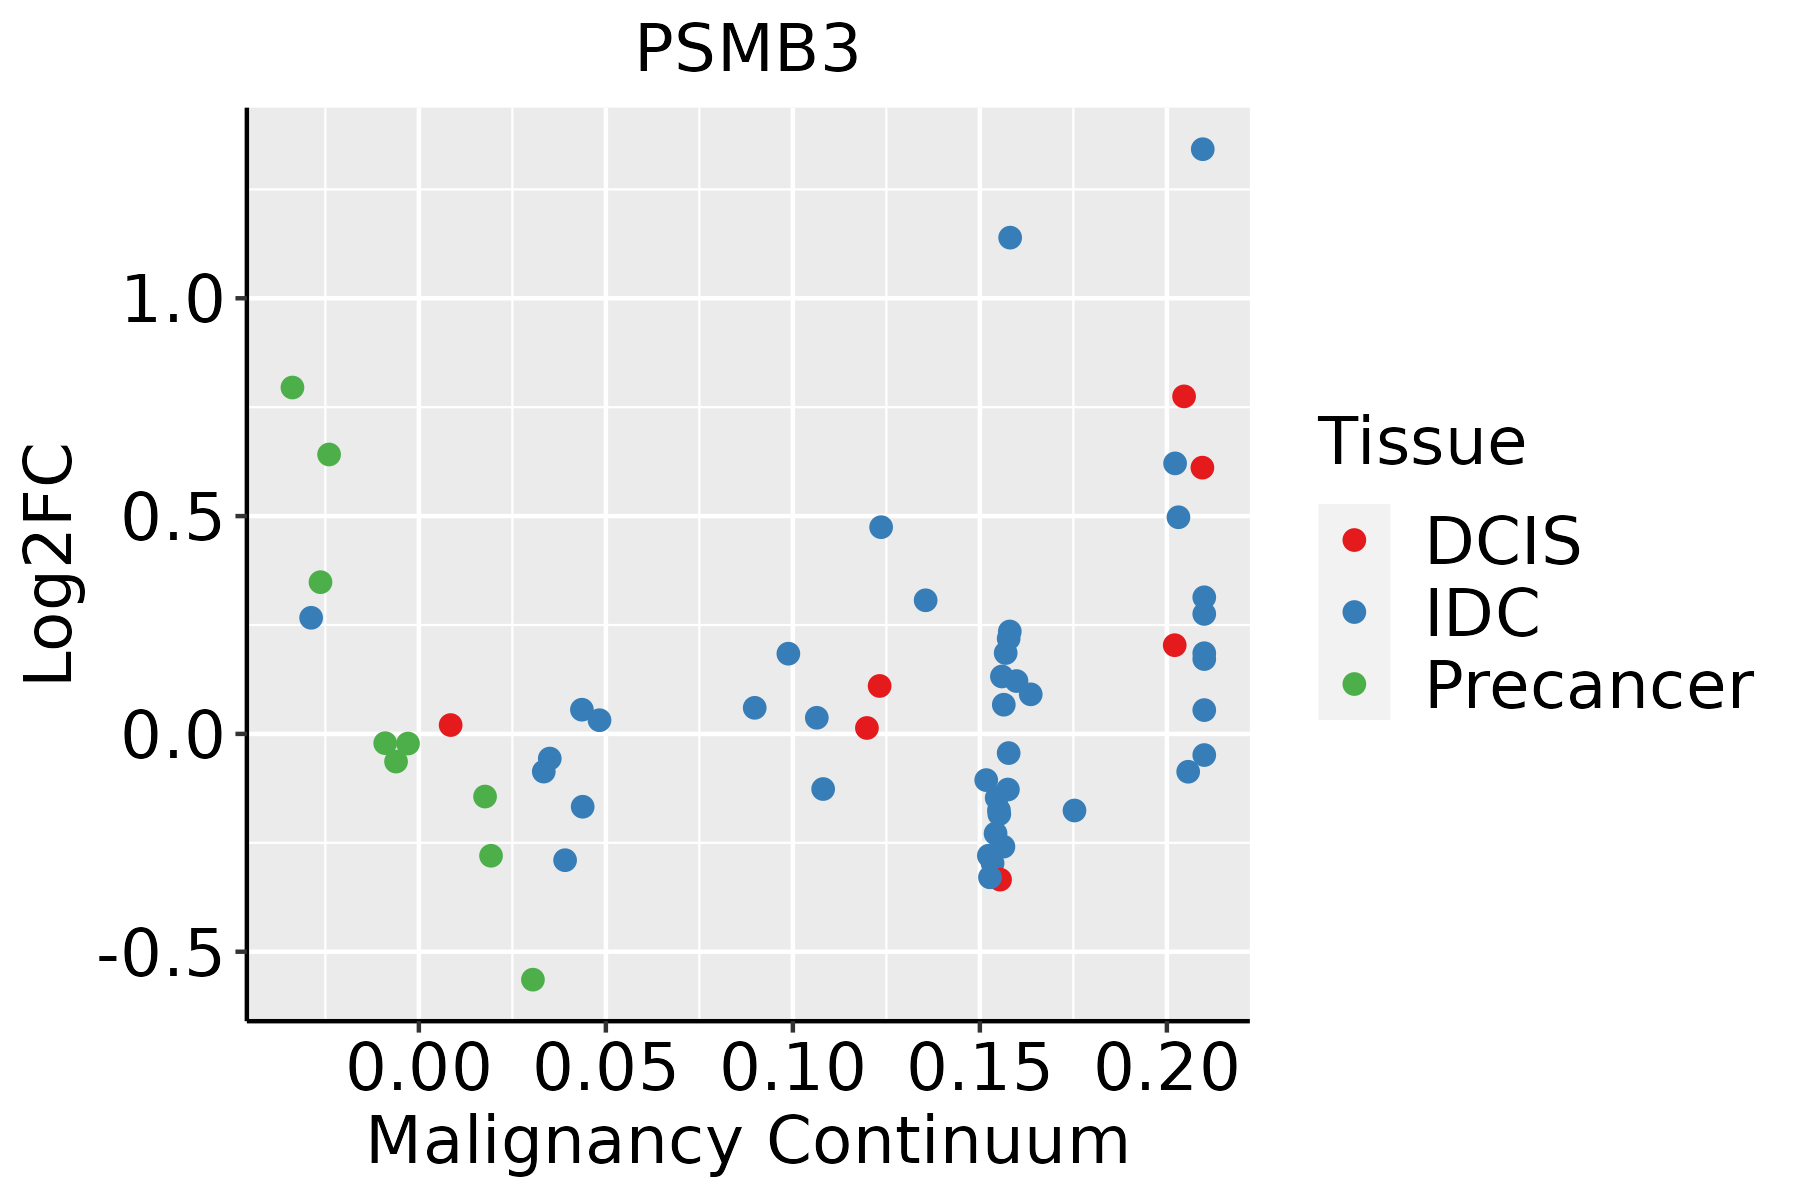 | IDC: Invasive ductal carcinoma |
| DCIS: Ductal carcinoma in situ | ||
| Precancer(BRCA1-mut): Precancerous lesion from BRCA1 mutation carriers | ||
| Cervix | 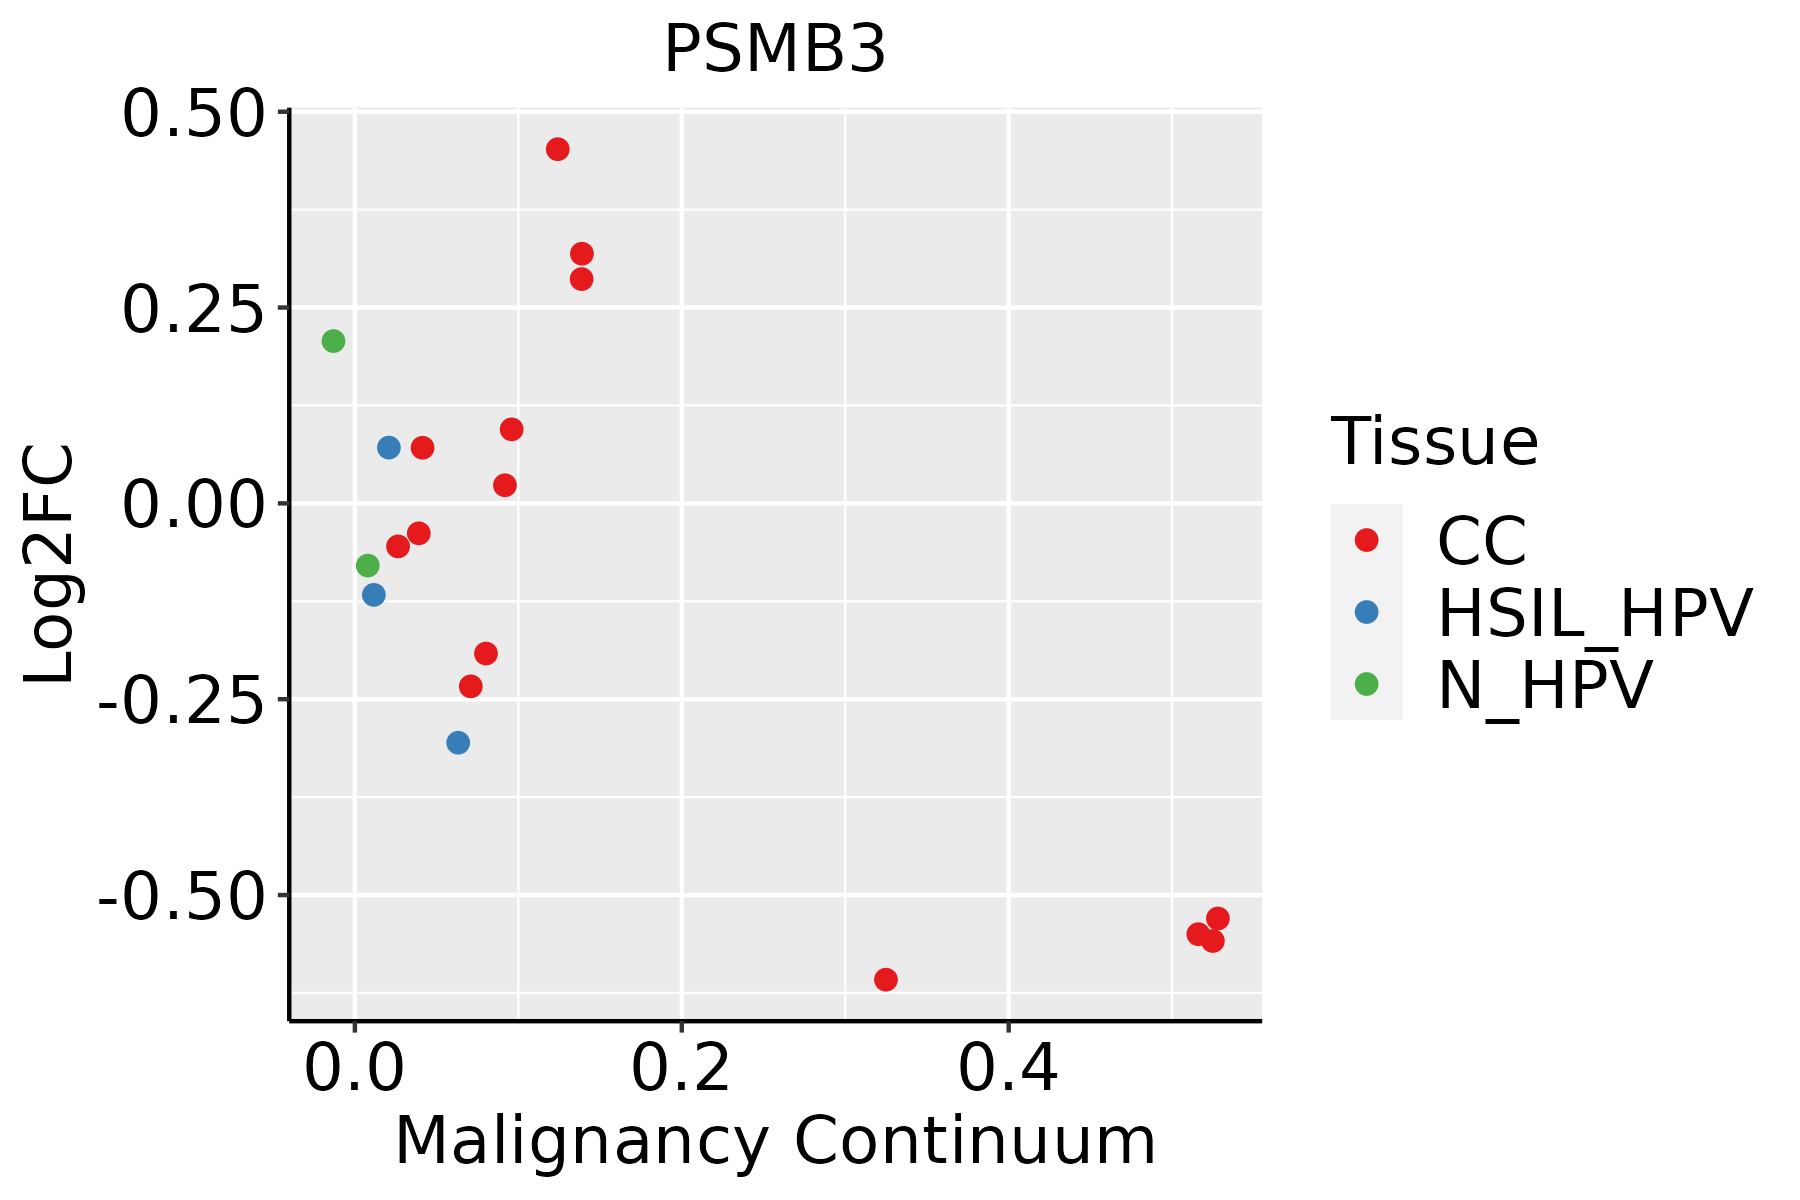 | CC: Cervix cancer |
| HSIL_HPV: HPV-infected high-grade squamous intraepithelial lesions | ||
| N_HPV: HPV-infected normal cervix | ||
| Colorectum (GSE201348) |  | FAP: Familial adenomatous polyposis |
| CRC: Colorectal cancer | ||
| Colorectum (HTA11) |  | AD: Adenomas |
| SER: Sessile serrated lesions | ||
| MSI-H: Microsatellite-high colorectal cancer | ||
| MSS: Microsatellite stable colorectal cancer | ||
| Endometrium | 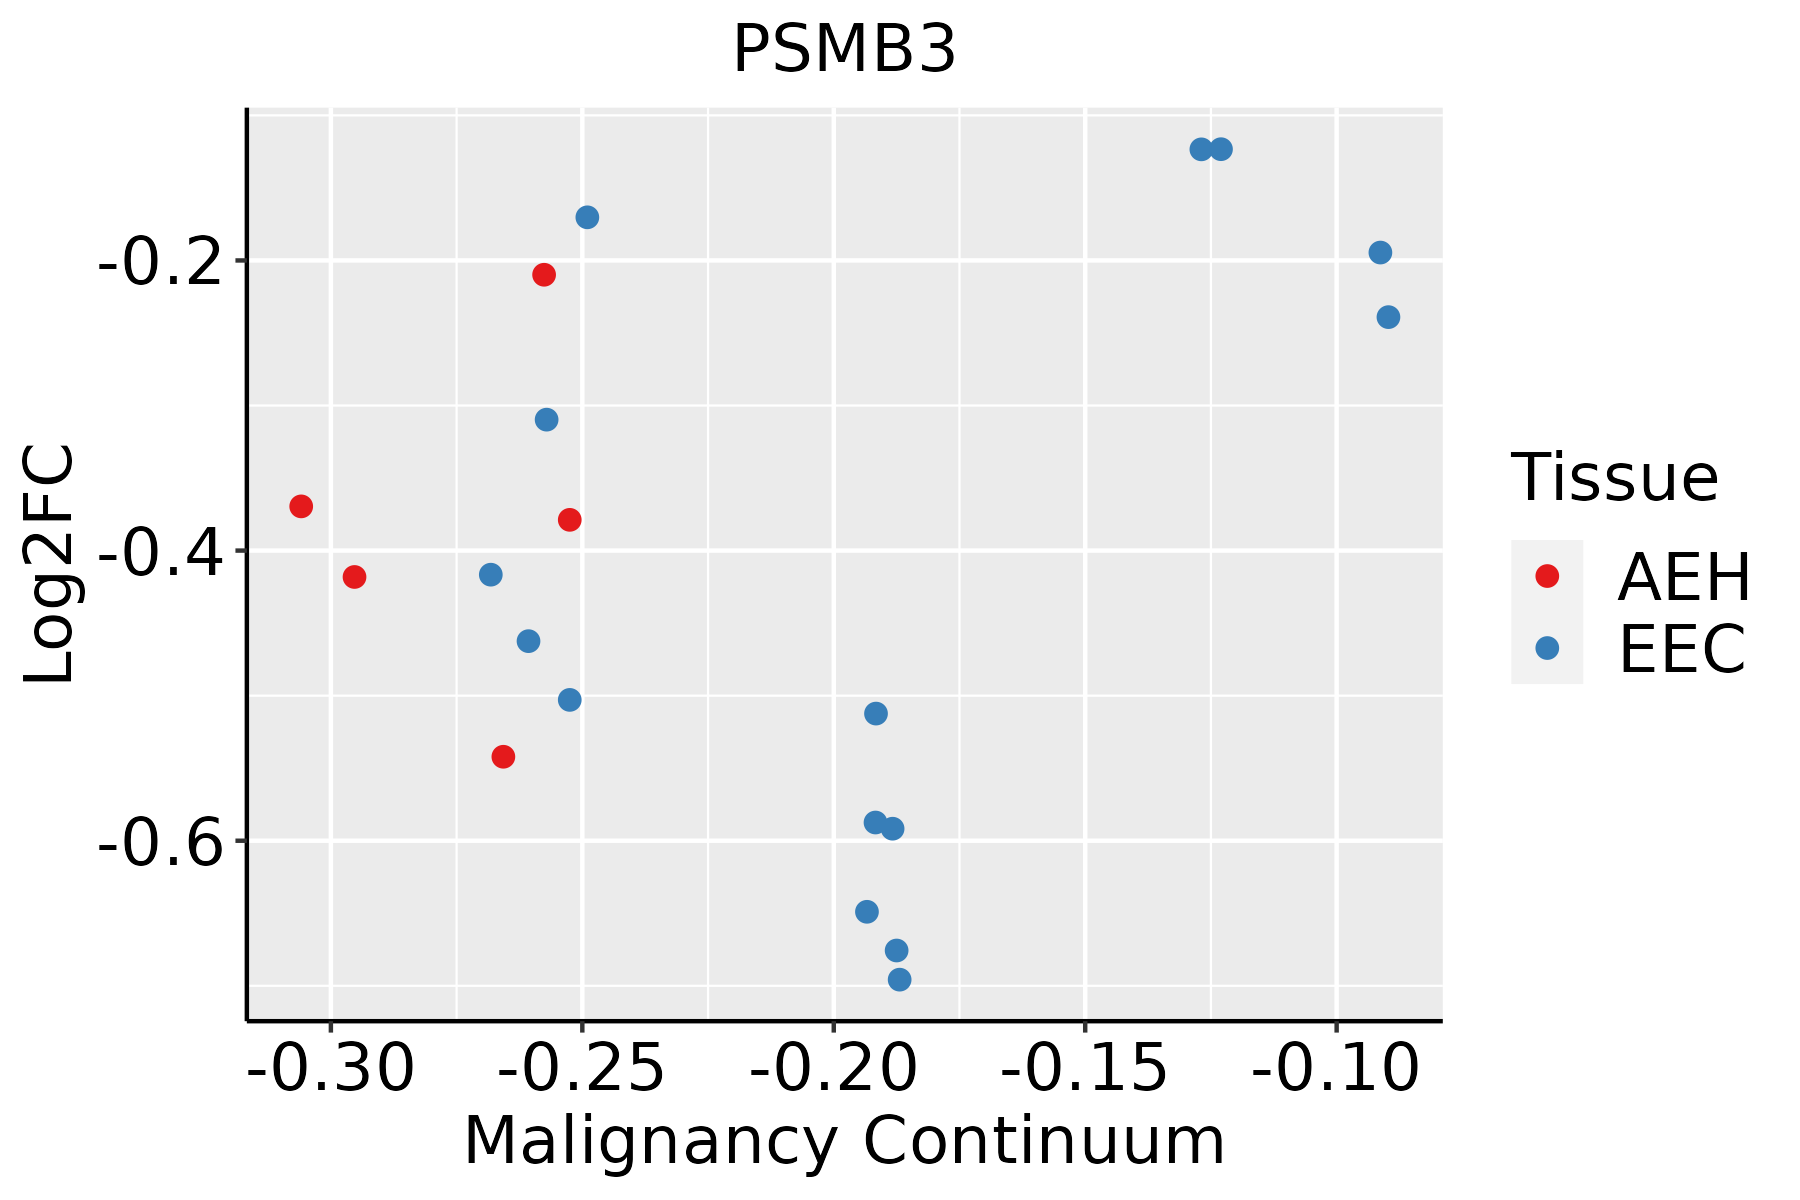 | AEH: Atypical endometrial hyperplasia |
| EEC: Endometrioid Cancer | ||
| Esophagus | 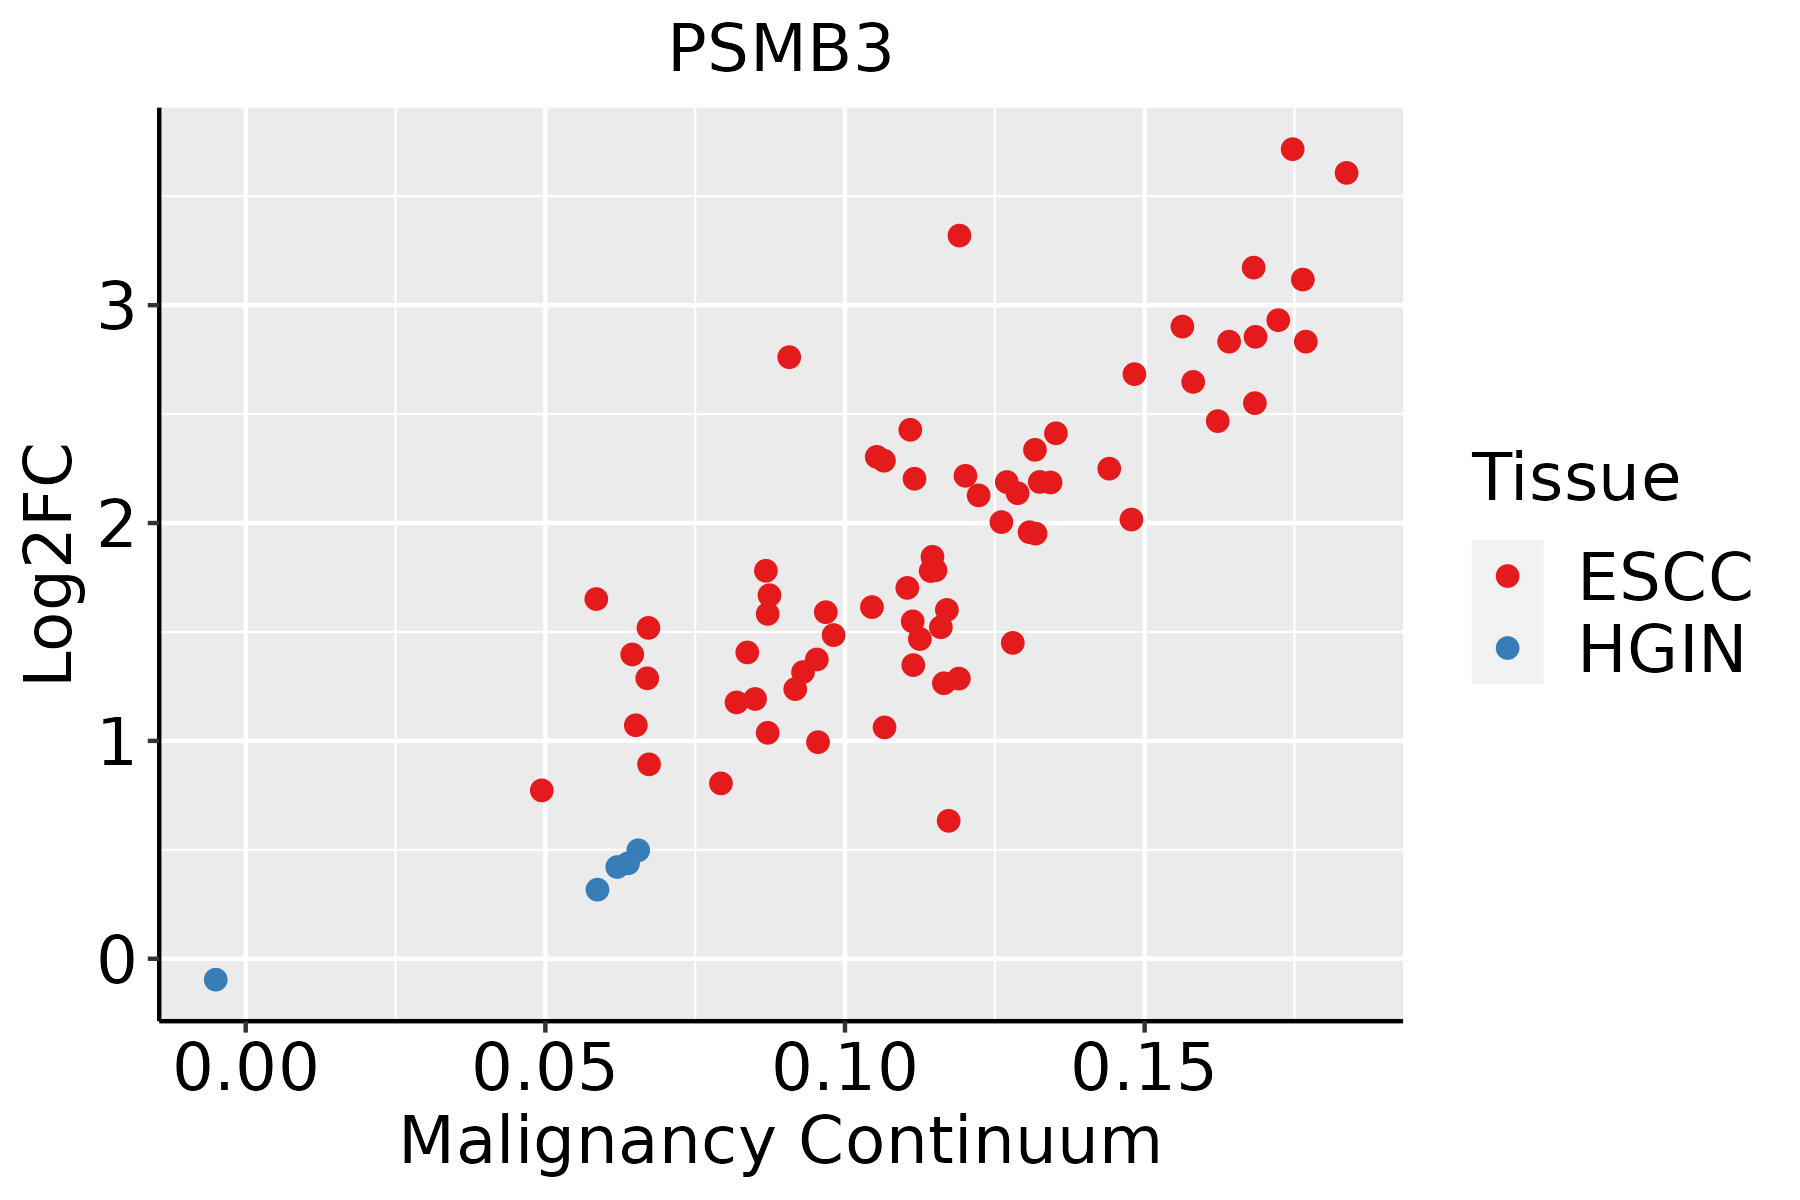 | ESCC: Esophageal squamous cell carcinoma |
| HGIN: High-grade intraepithelial neoplasias | ||
| LGIN: Low-grade intraepithelial neoplasias | ||
| GC | 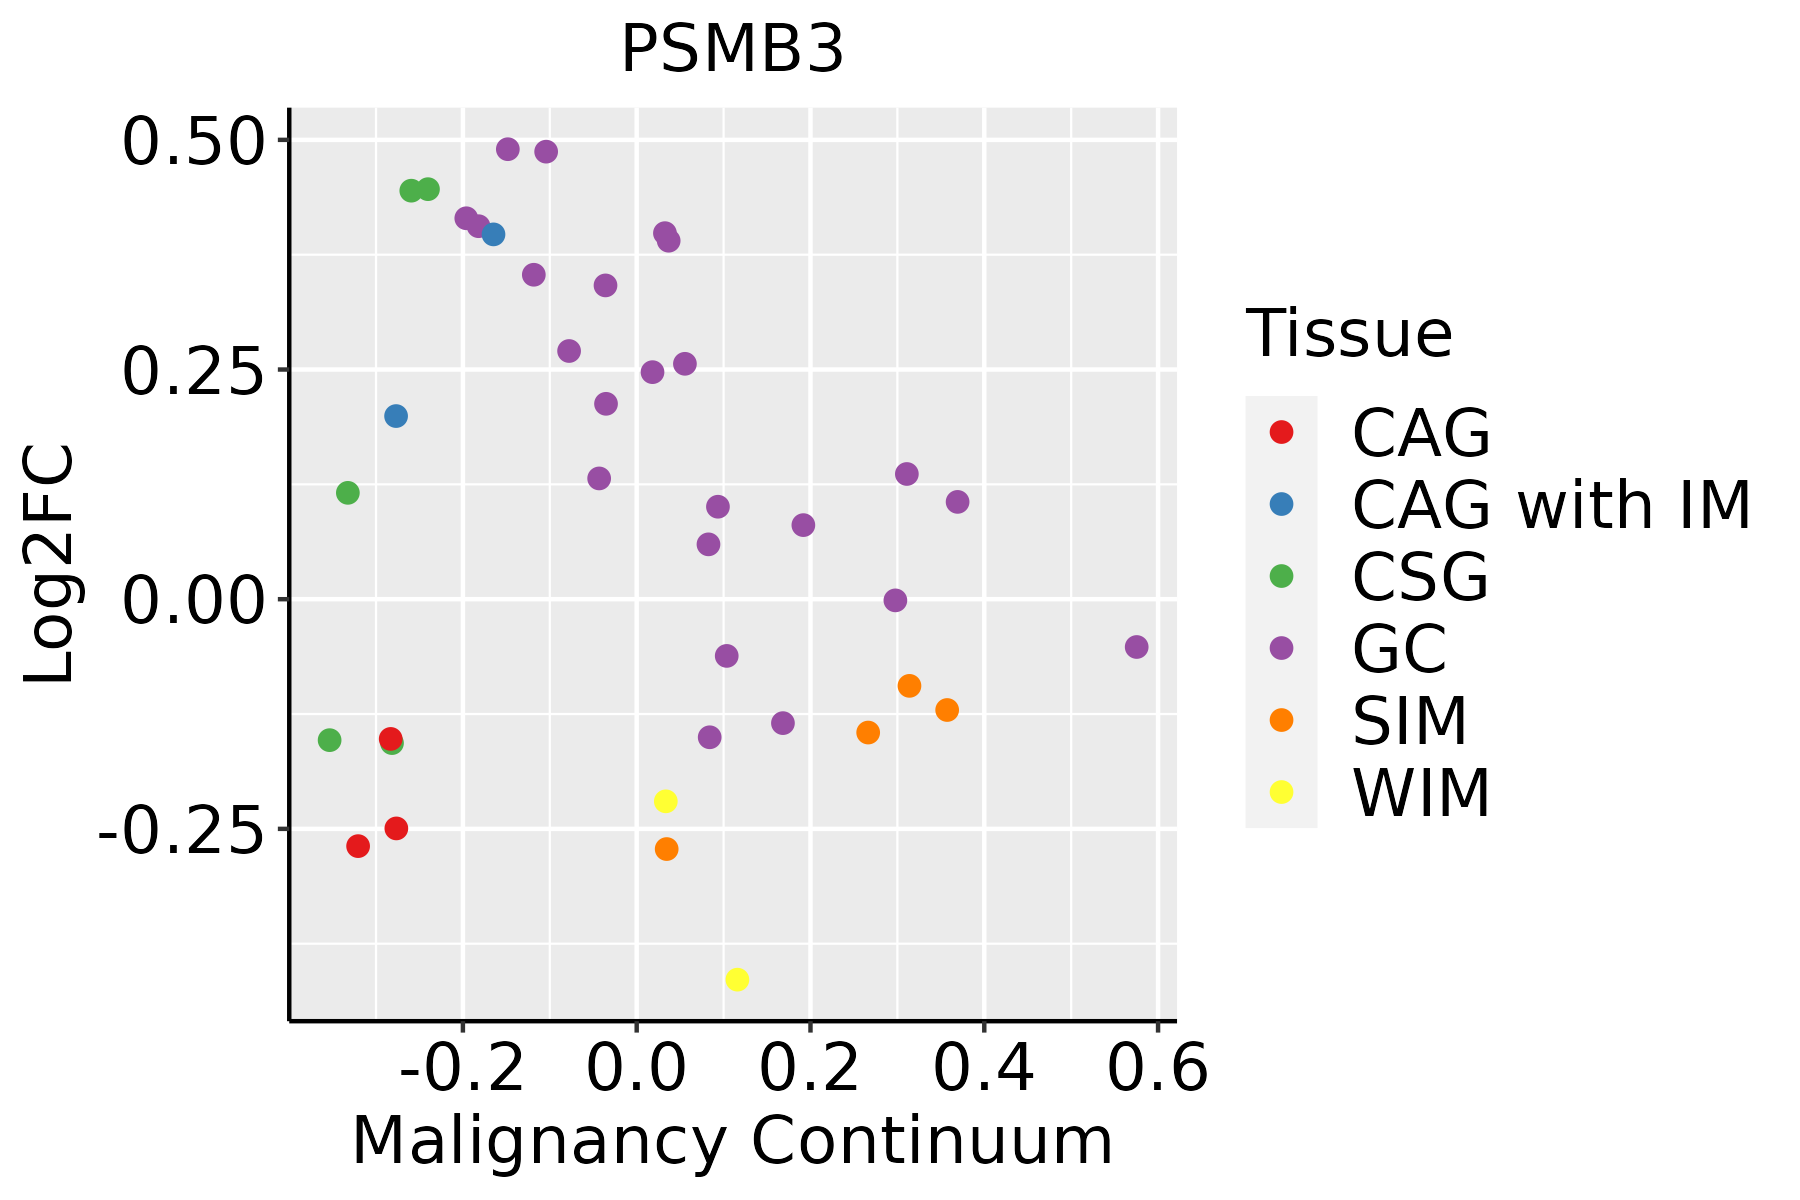 | CAG: Chronic atrophic gastritis |
| CAG with IM: Chronic atrophic gastritis with intestinal metaplasia | ||
| CSG: Chronic superficial gastritis | ||
| GC: Gastric cancer | ||
| SIM: Severe intestinal metaplasia | ||
| WIM: Wild intestinal metaplasia | ||
| Liver | 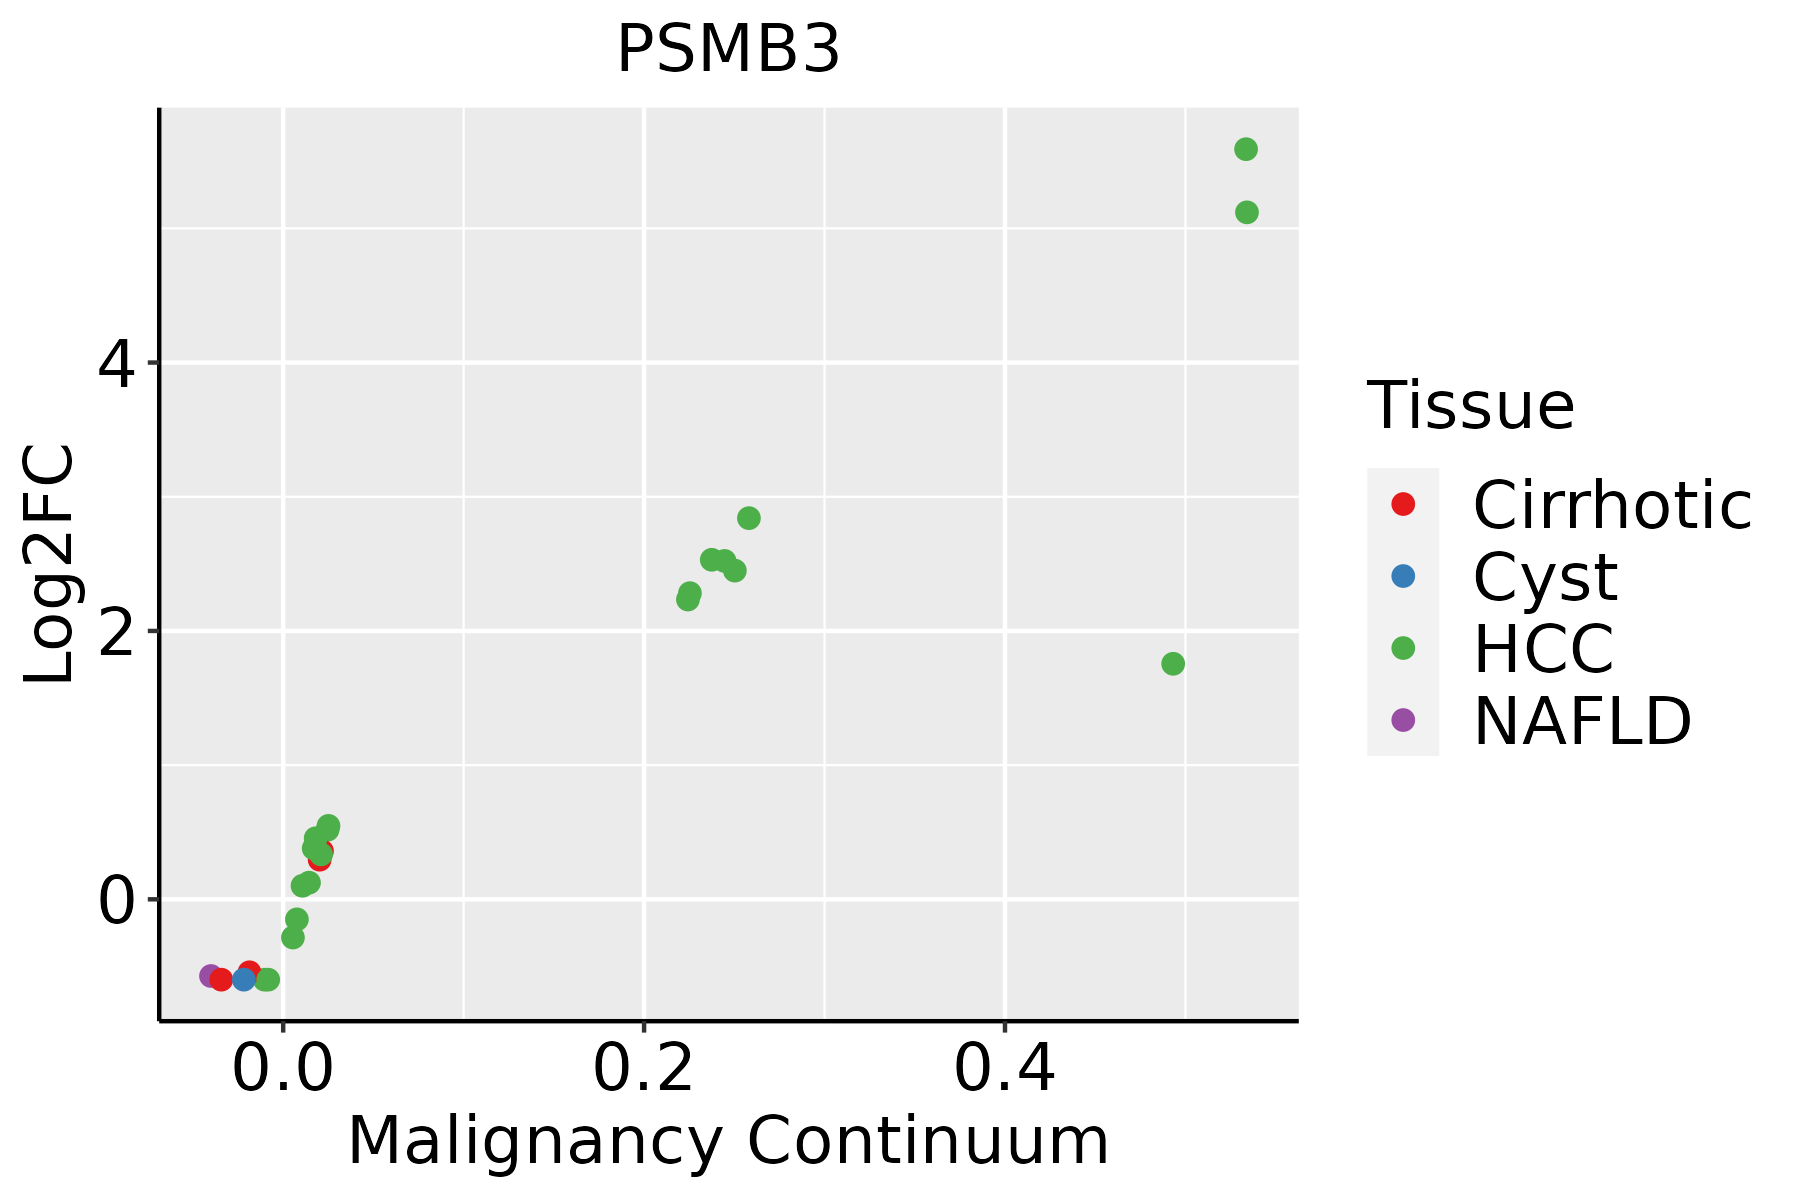 | HCC: Hepatocellular carcinoma |
| NAFLD: Non-alcoholic fatty liver disease | ||
| Oral Cavity |  | EOLP: Erosive Oral lichen planus |
| LP: leukoplakia | ||
| NEOLP: Non-erosive oral lichen planus | ||
| OSCC: Oral squamous cell carcinoma | ||
| Prostate | 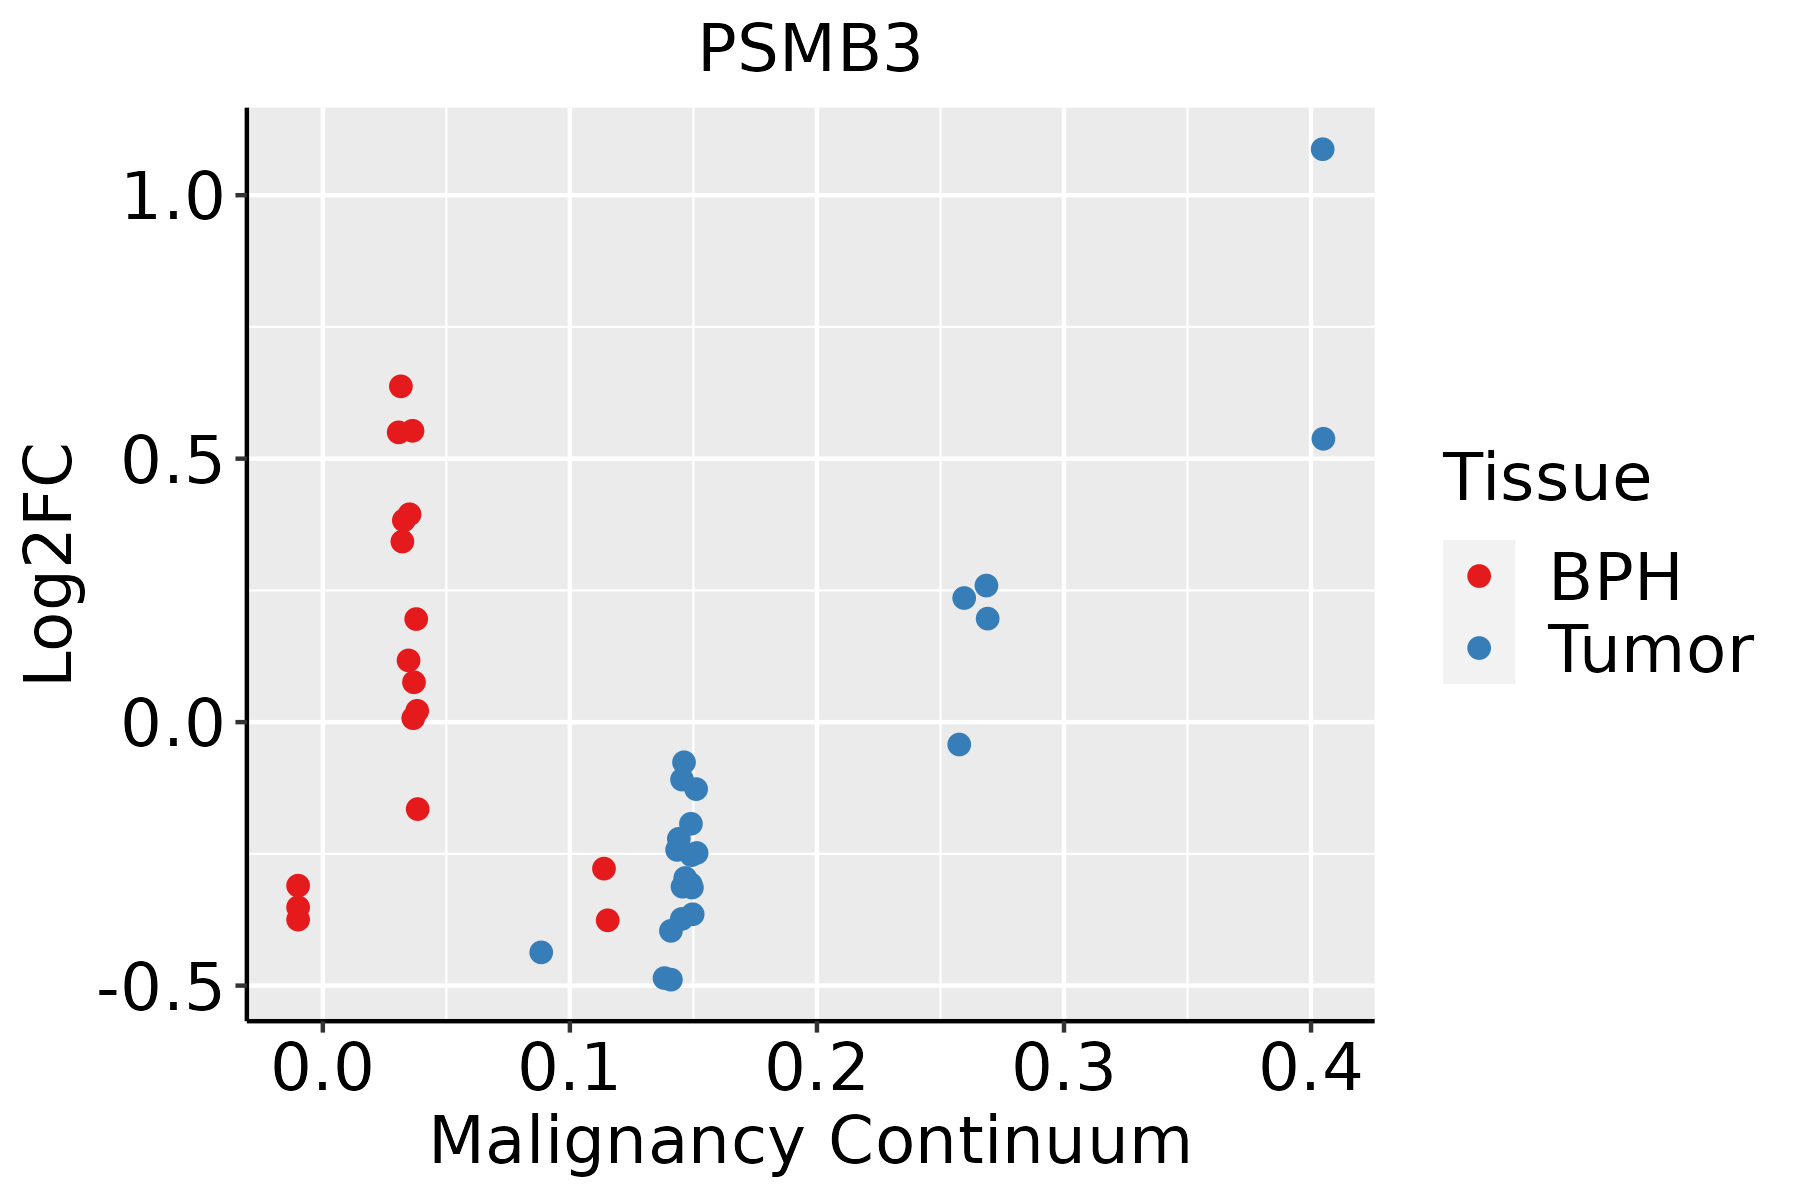 | BPH: Benign Prostatic Hyperplasia |
| Skin | 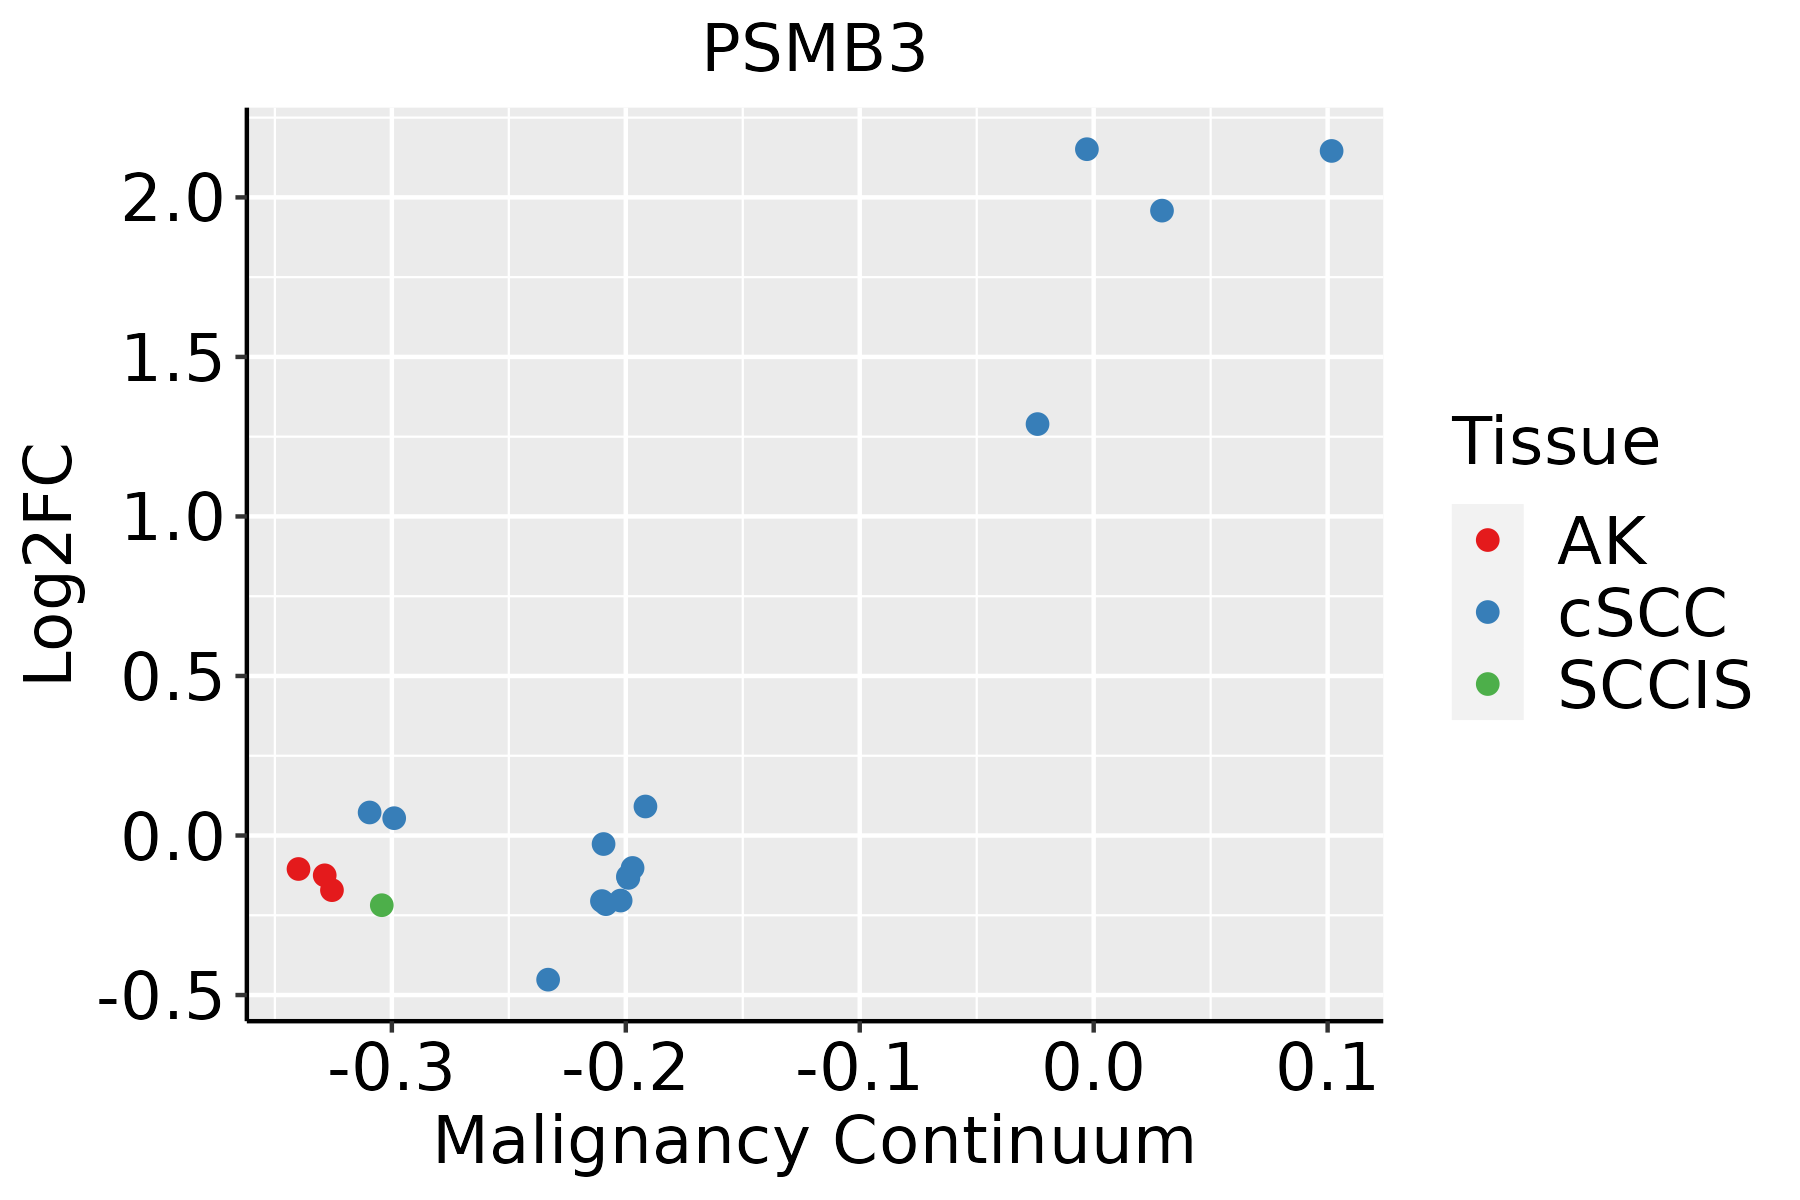 | AK: Actinic keratosis |
| cSCC: Cutaneous squamous cell carcinoma | ||
| SCCIS:squamous cell carcinoma in situ | ||
| Thyroid | 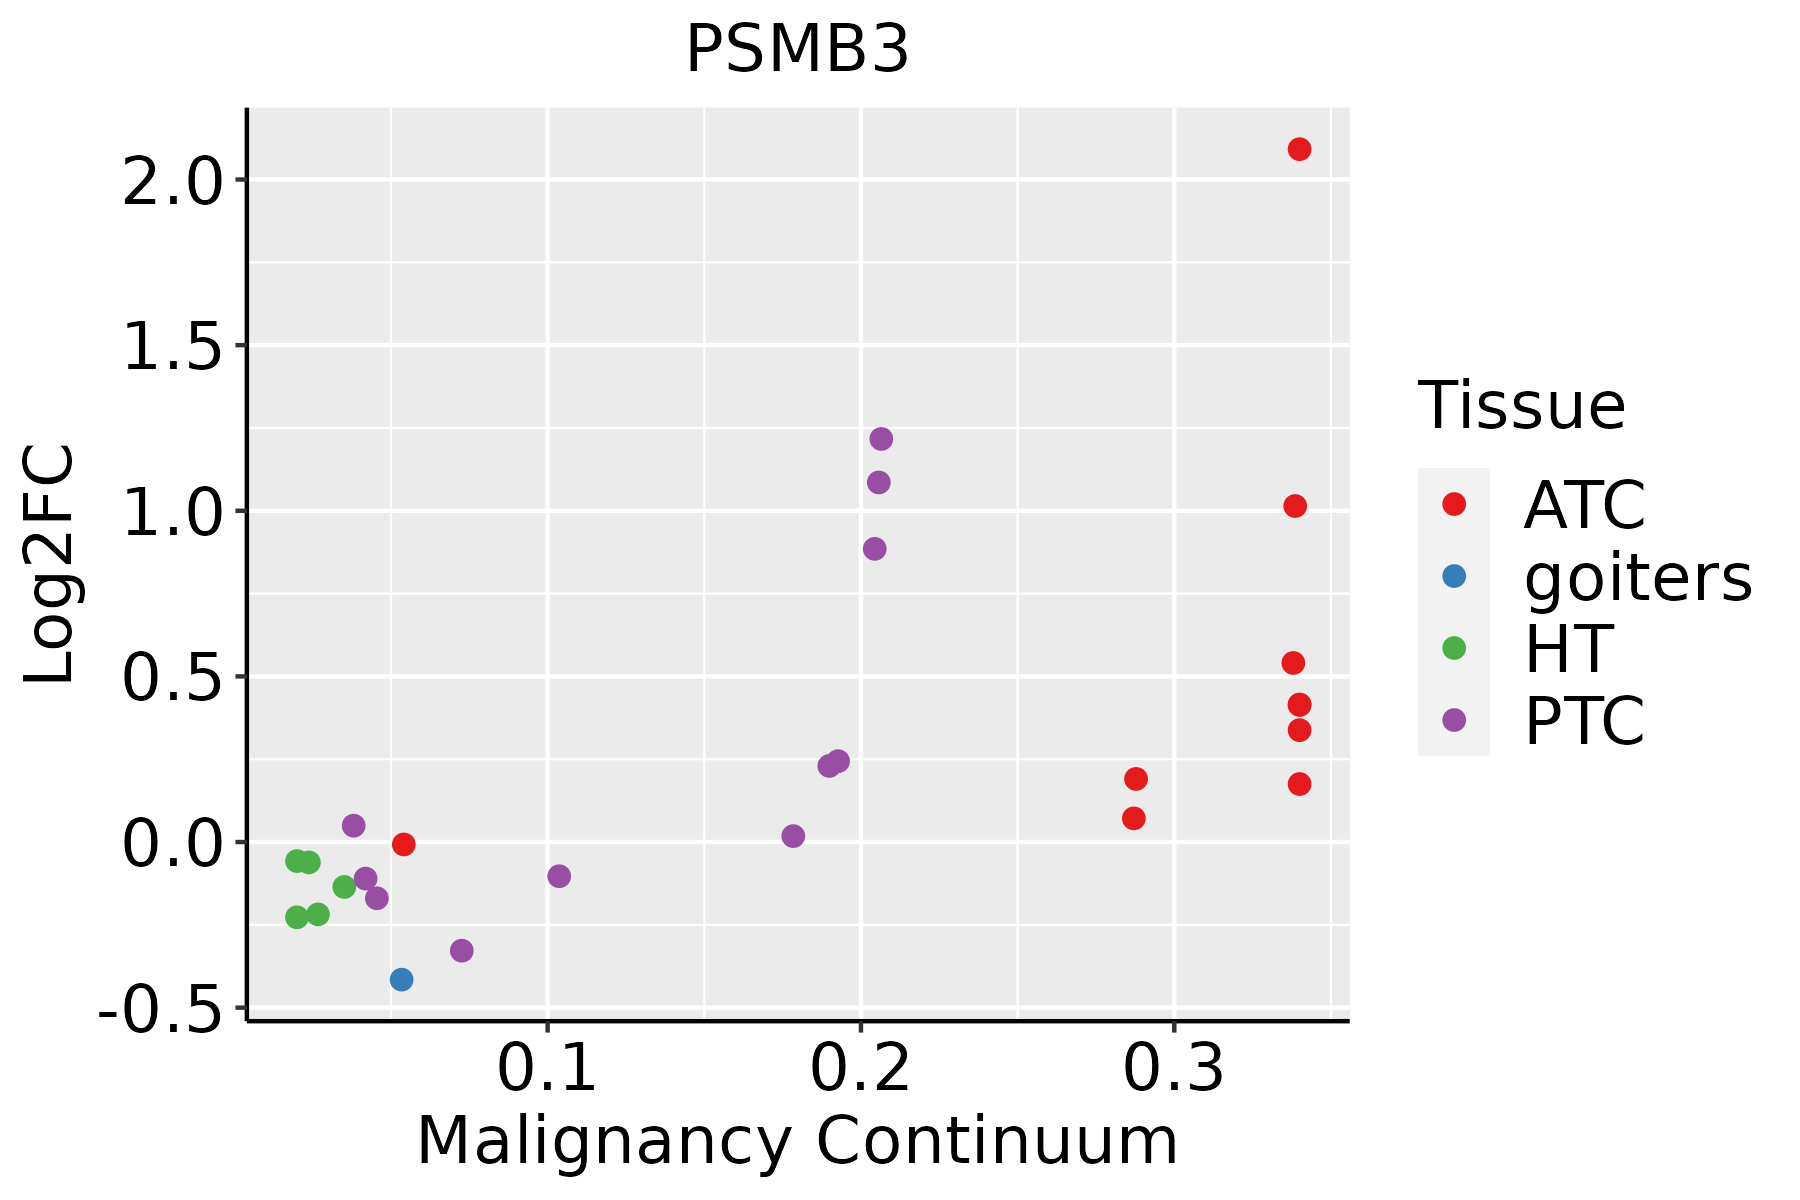 | ATC: Anaplastic thyroid cancer |
| HT: Hashimoto's thyroiditis | ||
| PTC: Papillary thyroid cancer |
| ∗log2FC in expression of this searched gene in stem-like cells from each diseased tissue sample relative to stem-like cells in normal samples in each tissue plotted against the malignancy continuum. Samples are colored based on if they are from different disease stage. |
Top |
Malignant transformation related pathway analysis |
| Find out the enriched GO biological processes and KEGG pathways involved in transition from healthy to precancer to cancer |
| Tissue | Disease Stage | Enriched GO biological Processes |
| Colorectum | AD |  |
| Colorectum | SER |  |
| Colorectum | MSS |  |
| Colorectum | MSI-H |  |
| Colorectum | FAP |  |
| ∗Top 15 enriched GO BP terms are showed in the bar plot of each disease state in each tissue. Each row represents a significant GO biological process which is colored according to the -log10(p.adjust). |
| Page: 1 2 3 4 5 6 7 8 9 |
| GO ID | Tissue | Disease Stage | Description | Gene Ratio | Bg Ratio | pvalue | p.adjust | Count |
| GO:00104989 | Breast | Precancer | proteasomal protein catabolic process | 58/1080 | 490/18723 | 1.54e-07 | 8.05e-06 | 58 |
| GO:00431619 | Breast | Precancer | proteasome-mediated ubiquitin-dependent protein catabolic process | 42/1080 | 412/18723 | 2.49e-04 | 3.72e-03 | 42 |
| GO:001049814 | Breast | IDC | proteasomal protein catabolic process | 75/1434 | 490/18723 | 5.59e-09 | 4.41e-07 | 75 |
| GO:004316114 | Breast | IDC | proteasome-mediated ubiquitin-dependent protein catabolic process | 57/1434 | 412/18723 | 9.55e-06 | 2.68e-04 | 57 |
| GO:001049824 | Breast | DCIS | proteasomal protein catabolic process | 75/1390 | 490/18723 | 1.44e-09 | 1.40e-07 | 75 |
| GO:004316124 | Breast | DCIS | proteasome-mediated ubiquitin-dependent protein catabolic process | 57/1390 | 412/18723 | 3.76e-06 | 1.16e-04 | 57 |
| GO:001049810 | Cervix | CC | proteasomal protein catabolic process | 111/2311 | 490/18723 | 8.98e-11 | 1.58e-08 | 111 |
| GO:004316110 | Cervix | CC | proteasome-mediated ubiquitin-dependent protein catabolic process | 91/2311 | 412/18723 | 1.65e-08 | 1.25e-06 | 91 |
| GO:001049815 | Cervix | N_HPV | proteasomal protein catabolic process | 27/534 | 490/18723 | 9.06e-04 | 1.08e-02 | 27 |
| GO:004316115 | Cervix | N_HPV | proteasome-mediated ubiquitin-dependent protein catabolic process | 21/534 | 412/18723 | 7.76e-03 | 4.97e-02 | 21 |
| GO:0010498 | Colorectum | AD | proteasomal protein catabolic process | 174/3918 | 490/18723 | 3.18e-14 | 7.66e-12 | 174 |
| GO:0043161 | Colorectum | AD | proteasome-mediated ubiquitin-dependent protein catabolic process | 141/3918 | 412/18723 | 1.77e-10 | 1.68e-08 | 141 |
| GO:00104981 | Colorectum | SER | proteasomal protein catabolic process | 132/2897 | 490/18723 | 3.08e-11 | 5.55e-09 | 132 |
| GO:00431611 | Colorectum | SER | proteasome-mediated ubiquitin-dependent protein catabolic process | 105/2897 | 412/18723 | 7.48e-08 | 4.70e-06 | 105 |
| GO:00104982 | Colorectum | MSS | proteasomal protein catabolic process | 157/3467 | 490/18723 | 2.39e-13 | 5.25e-11 | 157 |
| GO:00431612 | Colorectum | MSS | proteasome-mediated ubiquitin-dependent protein catabolic process | 127/3467 | 412/18723 | 7.70e-10 | 6.32e-08 | 127 |
| GO:00104983 | Colorectum | MSI-H | proteasomal protein catabolic process | 71/1319 | 490/18723 | 4.67e-09 | 6.03e-07 | 71 |
| GO:00431613 | Colorectum | MSI-H | proteasome-mediated ubiquitin-dependent protein catabolic process | 53/1319 | 412/18723 | 1.51e-05 | 6.62e-04 | 53 |
| GO:001049816 | Endometrium | AEH | proteasomal protein catabolic process | 108/2100 | 490/18723 | 2.73e-12 | 4.67e-10 | 108 |
| GO:004316116 | Endometrium | AEH | proteasome-mediated ubiquitin-dependent protein catabolic process | 88/2100 | 412/18723 | 1.54e-09 | 1.36e-07 | 88 |
| Page: 1 2 3 |
| Pathway ID | Tissue | Disease Stage | Description | Gene Ratio | Bg Ratio | pvalue | p.adjust | qvalue | Count |
| hsa0501218 | Breast | Precancer | Parkinson disease | 99/684 | 266/8465 | 3.58e-42 | 5.65e-40 | 4.33e-40 | 99 |
| hsa0502016 | Breast | Precancer | Prion disease | 95/684 | 273/8465 | 1.39e-37 | 1.46e-35 | 1.12e-35 | 95 |
| hsa0501616 | Breast | Precancer | Huntington disease | 98/684 | 306/8465 | 2.85e-35 | 2.25e-33 | 1.72e-33 | 98 |
| hsa0501016 | Breast | Precancer | Alzheimer disease | 103/684 | 384/8465 | 1.03e-29 | 4.66e-28 | 3.57e-28 | 103 |
| hsa0501416 | Breast | Precancer | Amyotrophic lateral sclerosis | 98/684 | 364/8465 | 2.13e-28 | 8.41e-27 | 6.44e-27 | 98 |
| hsa0502216 | Breast | Precancer | Pathways of neurodegeneration - multiple diseases | 112/684 | 476/8465 | 6.96e-27 | 2.44e-25 | 1.87e-25 | 112 |
| hsa0501714 | Breast | Precancer | Spinocerebellar ataxia | 29/684 | 143/8465 | 2.79e-06 | 3.83e-05 | 2.94e-05 | 29 |
| hsa0501219 | Breast | Precancer | Parkinson disease | 99/684 | 266/8465 | 3.58e-42 | 5.65e-40 | 4.33e-40 | 99 |
| hsa0502017 | Breast | Precancer | Prion disease | 95/684 | 273/8465 | 1.39e-37 | 1.46e-35 | 1.12e-35 | 95 |
| hsa0501617 | Breast | Precancer | Huntington disease | 98/684 | 306/8465 | 2.85e-35 | 2.25e-33 | 1.72e-33 | 98 |
| hsa0501017 | Breast | Precancer | Alzheimer disease | 103/684 | 384/8465 | 1.03e-29 | 4.66e-28 | 3.57e-28 | 103 |
| hsa0501417 | Breast | Precancer | Amyotrophic lateral sclerosis | 98/684 | 364/8465 | 2.13e-28 | 8.41e-27 | 6.44e-27 | 98 |
| hsa0502217 | Breast | Precancer | Pathways of neurodegeneration - multiple diseases | 112/684 | 476/8465 | 6.96e-27 | 2.44e-25 | 1.87e-25 | 112 |
| hsa0501715 | Breast | Precancer | Spinocerebellar ataxia | 29/684 | 143/8465 | 2.79e-06 | 3.83e-05 | 2.94e-05 | 29 |
| hsa0501224 | Breast | IDC | Parkinson disease | 107/867 | 266/8465 | 2.57e-39 | 8.36e-37 | 6.26e-37 | 107 |
| hsa0502023 | Breast | IDC | Prion disease | 102/867 | 273/8465 | 3.70e-34 | 4.01e-32 | 3.00e-32 | 102 |
| hsa0501623 | Breast | IDC | Huntington disease | 103/867 | 306/8465 | 5.14e-30 | 4.17e-28 | 3.12e-28 | 103 |
| hsa0501023 | Breast | IDC | Alzheimer disease | 107/867 | 384/8465 | 1.70e-23 | 7.88e-22 | 5.90e-22 | 107 |
| hsa0501423 | Breast | IDC | Amyotrophic lateral sclerosis | 102/867 | 364/8465 | 1.29e-22 | 5.22e-21 | 3.91e-21 | 102 |
| hsa0502223 | Breast | IDC | Pathways of neurodegeneration - multiple diseases | 116/867 | 476/8465 | 3.63e-20 | 1.18e-18 | 8.82e-19 | 116 |
| Page: 1 2 3 4 5 6 7 8 9 10 11 12 13 14 15 16 17 18 19 |
Top |
Cell-cell communication analysis |
| Identification of potential cell-cell interactions between two cell types and their ligand-receptor pairs for different disease states |
| Ligand | Receptor | LRpair | Pathway | Tissue | Disease Stage |
| Page: 1 |
Top |
Single-cell gene regulatory network inference analysis |
| Find out the significant the regulons (TFs) and the target genes of each regulon across cell types for different disease states |
| TF | Cell Type | Tissue | Disease Stage | Target Gene | RSS | Regulon Activity |
| ∗The dot plots of a searched regulon are shown for all cell subpopulations in each disease state of each tissue based on the regulon specific score inferred using pySCENIC and by calculating the average expression. |
| Page: 1 |
Top |
Somatic mutation of malignant transformation related genes |
| Annotation of somatic variants for genes involved in malignant transformation |
| Hugo Symbol | Variant Class | Variant Classification | dbSNP RS | HGVSc | HGVSp | HGVSp Short | SWISSPROT | BIOTYPE | SIFT | PolyPhen | Tumor Sample Barcode | Tissue | Histology | Sex | Age | Stage | Therapy Types | Drugs | Outcome |
| PSMB3 | insertion | Frame_Shift_Ins | novel | c.612_613insACCGCGCCCGGCCAAGCTCCTTCCCTTCTTTTGAGAGCTGT | p.Asp205ThrfsTer28 | p.D205Tfs*28 | P49720 | protein_coding | TCGA-A8-A07R-01 | Breast | breast invasive carcinoma | Female | >=65 | III/IV | Ancillary | zoledronic | SD | ||
| PSMB3 | insertion | Frame_Shift_Ins | novel | c.142_143insTAAAACTCCATTTTCATCTTTTGCGTCCT | p.Arg48LeufsTer34 | p.R48Lfs*34 | P49720 | protein_coding | TCGA-A8-A0A4-01 | Breast | breast invasive carcinoma | Female | >=65 | I/II | Hormone Therapy | tamoxiphen | CR | ||
| PSMB3 | insertion | In_Frame_Ins | novel | c.144_145insATGACTAGT | p.Arg48_Leu49insMetThrSer | p.R48_L49insMTS | P49720 | protein_coding | TCGA-A8-A0A4-01 | Breast | breast invasive carcinoma | Female | >=65 | I/II | Hormone Therapy | tamoxiphen | CR | ||
| PSMB3 | SNV | Missense_Mutation | novel | c.183N>T | p.Gln61His | p.Q61H | P49720 | protein_coding | tolerated(0.22) | probably_damaging(0.963) | TCGA-AZ-4315-01 | Colorectum | colon adenocarcinoma | Male | <65 | I/II | Unknown | Unknown | SD |
| PSMB3 | SNV | Missense_Mutation | novel | c.58G>A | p.Val20Met | p.V20M | P49720 | protein_coding | deleterious(0.02) | possibly_damaging(0.812) | TCGA-CK-4951-01 | Colorectum | colon adenocarcinoma | Female | >=65 | I/II | Unknown | Unknown | PD |
| PSMB3 | SNV | Missense_Mutation | novel | c.51N>T | p.Lys17Asn | p.K17N | P49720 | protein_coding | tolerated(0.07) | benign(0.163) | TCGA-AG-A002-01 | Colorectum | rectum adenocarcinoma | Male | <65 | I/II | Unknown | Unknown | SD |
| PSMB3 | SNV | Missense_Mutation | novel | c.68N>A | p.Ala23Asp | p.A23D | P49720 | protein_coding | deleterious(0) | probably_damaging(0.985) | TCGA-A5-A0G1-01 | Endometrium | uterine corpus endometrioid carcinoma | Female | >=65 | I/II | Unknown | Unknown | SD |
| PSMB3 | SNV | Missense_Mutation | novel | c.94N>A | p.Ala32Thr | p.A32T | P49720 | protein_coding | tolerated(0.39) | benign(0.156) | TCGA-A5-A0G2-01 | Endometrium | uterine corpus endometrioid carcinoma | Female | <65 | III/IV | Unknown | Unknown | SD |
| PSMB3 | SNV | Missense_Mutation | rs771740744 | c.196N>T | p.Arg66Cys | p.R66C | P49720 | protein_coding | tolerated(0.06) | benign(0.029) | TCGA-A5-A0G2-01 | Endometrium | uterine corpus endometrioid carcinoma | Female | <65 | III/IV | Unknown | Unknown | SD |
| PSMB3 | SNV | Missense_Mutation | rs201615360 | c.430G>A | p.Glu144Lys | p.E144K | P49720 | protein_coding | deleterious(0.01) | benign(0.068) | TCGA-AX-A2HC-01 | Endometrium | uterine corpus endometrioid carcinoma | Female | <65 | III/IV | Chemotherapy | paclitaxel | PD |
| Page: 1 2 3 |
Top |
Related drugs of malignant transformation related genes |
| Identification of chemicals and drugs interact with genes involved in malignant transfromation |
| (DGIdb 4.0) |
| Entrez ID | Symbol | Category | Interaction Types | Drug Claim Name | Drug Name | PMIDs |
| 5691 | PSMB3 | PROTEASE, DRUGGABLE GENOME | inhibitor | BORTEZOMIB | BORTEZOMIB | |
| 5691 | PSMB3 | PROTEASE, DRUGGABLE GENOME | inhibitor | CHEMBL3545432 | IXAZOMIB CITRATE | |
| 5691 | PSMB3 | PROTEASE, DRUGGABLE GENOME | BORTEZOMIB | BORTEZOMIB | 24524217 | |
| 5691 | PSMB3 | PROTEASE, DRUGGABLE GENOME | inhibitor | CHEMBL2103884 | OPROZOMIB | |
| 5691 | PSMB3 | PROTEASE, DRUGGABLE GENOME | inhibitor | CARFILZOMIB | CARFILZOMIB | |
| 5691 | PSMB3 | PROTEASE, DRUGGABLE GENOME | inhibitor | CHEMBL371405 | MARIZOMIB | |
| 5691 | PSMB3 | PROTEASE, DRUGGABLE GENOME | inhibitor | CHEMBL451887 | CARFILZOMIB | |
| 5691 | PSMB3 | PROTEASE, DRUGGABLE GENOME | inhibitor | CHEMBL325041 | BORTEZOMIB | |
| 5691 | PSMB3 | PROTEASE, DRUGGABLE GENOME | CARFILZOMIB | CARFILZOMIB | 24524217 |
| Page: 1 |

Copyright 2023-Present -The University of Texas Health Science Center at Houston |