
|
|||||
|
 | |
| |
| |
| |
| |
| |
|
Gene: PSENEN |
Gene summary for PSENEN |
| Gene information | Species | Human | Gene symbol | PSENEN | Gene ID | 55851 |
| Gene name | presenilin enhancer, gamma-secretase subunit | |
| Gene Alias | ACNINV2 | |
| Cytomap | 19q13.12 | |
| Gene Type | protein-coding | GO ID | GO:0006508 | UniProtAcc | Q9NZ42 |
Top |
Malignant transformation analysis |
| Identification of the aberrant gene expression in precancerous and cancerous lesions by comparing the gene expression of stem-like cells in diseased tissues with normal stem cells |
| Entrez ID | Symbol | Replicates | Species | Organ | Tissue | Adj P-value | Log2FC | Malignancy |
| 55851 | PSENEN | HTA11_10623_2000001011 | Human | Colorectum | AD | 8.98e-03 | 1.87e-01 | -0.0177 |
| 55851 | PSENEN | HTA11_10711_2000001011 | Human | Colorectum | AD | 4.64e-04 | 1.74e-01 | 0.0338 |
| 55851 | PSENEN | HTA11_7696_3000711011 | Human | Colorectum | AD | 1.58e-13 | 2.58e-01 | 0.0674 |
| 55851 | PSENEN | HTA11_6818_2000001011 | Human | Colorectum | AD | 9.33e-07 | 2.74e-01 | 0.0112 |
| 55851 | PSENEN | HTA11_6818_2000001021 | Human | Colorectum | AD | 3.40e-07 | 2.88e-01 | 0.0588 |
| 55851 | PSENEN | HTA11_99999970781_79442 | Human | Colorectum | MSS | 4.28e-10 | 2.48e-01 | 0.294 |
| 55851 | PSENEN | HTA11_99999965062_69753 | Human | Colorectum | MSI-H | 5.36e-07 | 5.36e-01 | 0.3487 |
| 55851 | PSENEN | HTA11_99999965104_69814 | Human | Colorectum | MSS | 4.35e-15 | 4.56e-01 | 0.281 |
| 55851 | PSENEN | HTA11_99999971662_82457 | Human | Colorectum | MSS | 1.23e-23 | 4.79e-01 | 0.3859 |
| 55851 | PSENEN | HTA11_99999973899_84307 | Human | Colorectum | MSS | 8.26e-07 | 2.82e-01 | 0.2585 |
| 55851 | PSENEN | HTA11_99999974143_84620 | Human | Colorectum | MSS | 4.47e-08 | 2.02e-01 | 0.3005 |
| 55851 | PSENEN | LZE2T | Human | Esophagus | ESCC | 1.10e-03 | 8.90e-01 | 0.082 |
| 55851 | PSENEN | LZE4T | Human | Esophagus | ESCC | 1.61e-15 | 4.06e-01 | 0.0811 |
| 55851 | PSENEN | LZE5T | Human | Esophagus | ESCC | 6.07e-06 | 5.27e-01 | 0.0514 |
| 55851 | PSENEN | LZE7T | Human | Esophagus | ESCC | 5.29e-05 | 5.77e-01 | 0.0667 |
| 55851 | PSENEN | LZE8T | Human | Esophagus | ESCC | 9.45e-10 | 2.61e-01 | 0.067 |
| 55851 | PSENEN | LZE20T | Human | Esophagus | ESCC | 3.46e-07 | 3.84e-01 | 0.0662 |
| 55851 | PSENEN | LZE22D1 | Human | Esophagus | HGIN | 1.14e-04 | 1.17e-01 | 0.0595 |
| 55851 | PSENEN | LZE22T | Human | Esophagus | ESCC | 8.07e-08 | 6.08e-01 | 0.068 |
| 55851 | PSENEN | LZE24T | Human | Esophagus | ESCC | 2.78e-27 | 1.28e+00 | 0.0596 |
| Page: 1 2 3 4 5 6 7 8 9 |
| Tissue | Expression Dynamics | Abbreviation |
| Colorectum (GSE201348) |  | FAP: Familial adenomatous polyposis |
| CRC: Colorectal cancer | ||
| Colorectum (HTA11) |  | AD: Adenomas |
| SER: Sessile serrated lesions | ||
| MSI-H: Microsatellite-high colorectal cancer | ||
| MSS: Microsatellite stable colorectal cancer | ||
| Esophagus | 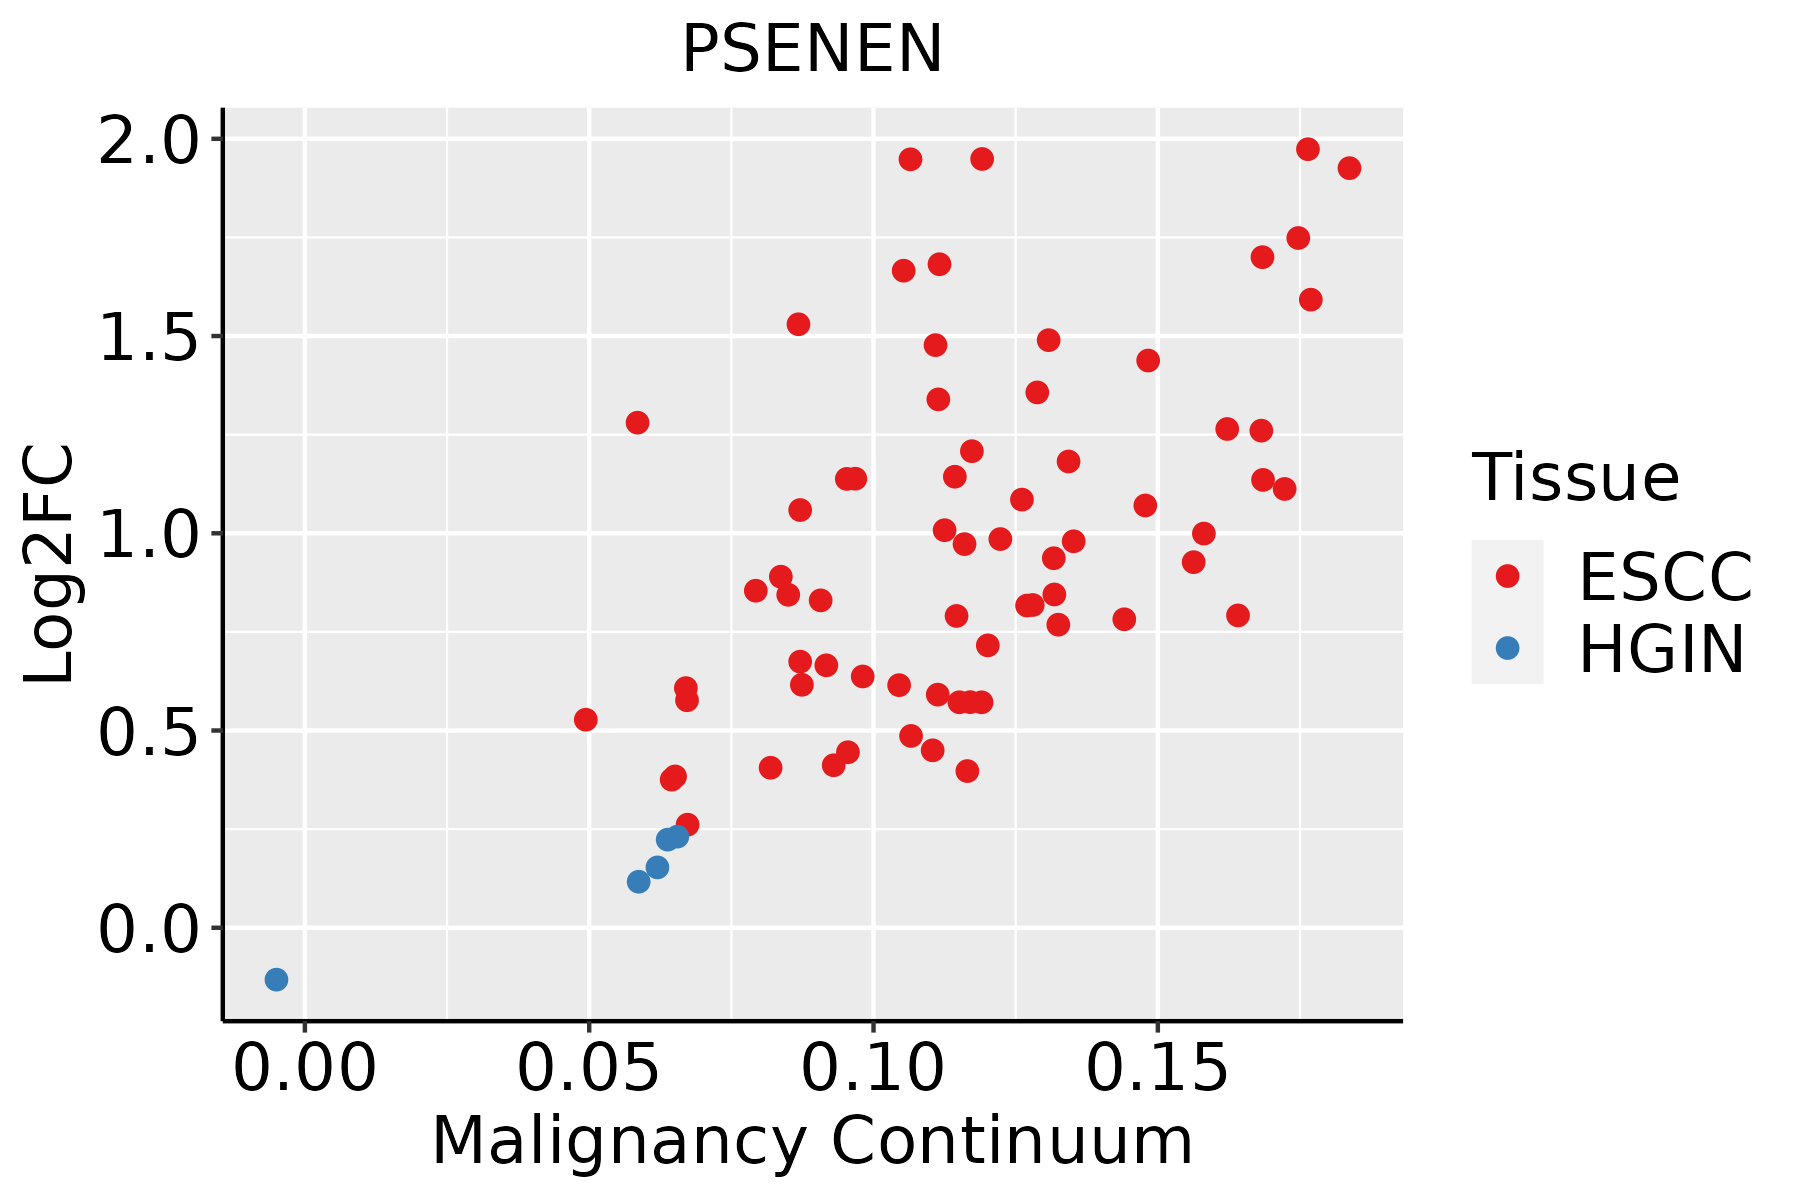 | ESCC: Esophageal squamous cell carcinoma |
| HGIN: High-grade intraepithelial neoplasias | ||
| LGIN: Low-grade intraepithelial neoplasias | ||
| Liver | 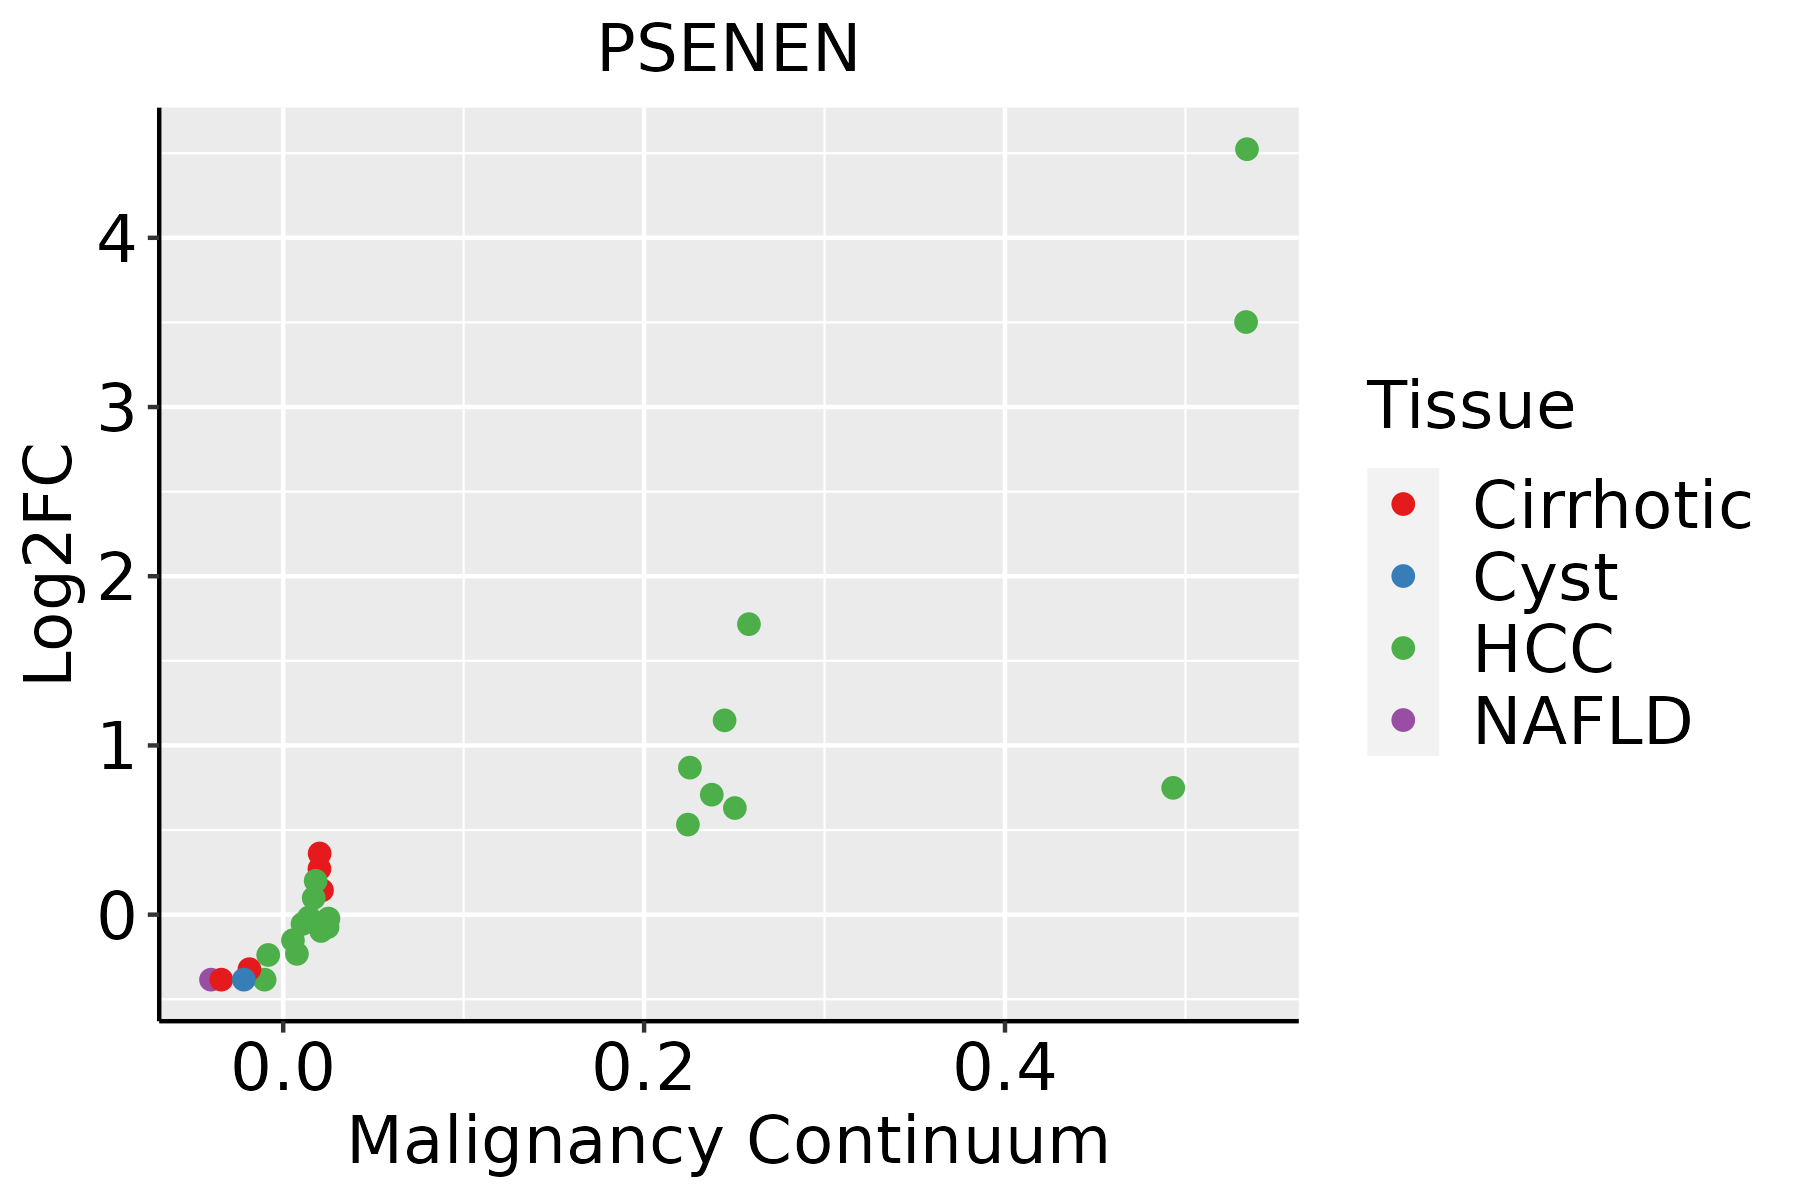 | HCC: Hepatocellular carcinoma |
| NAFLD: Non-alcoholic fatty liver disease | ||
| Oral Cavity | 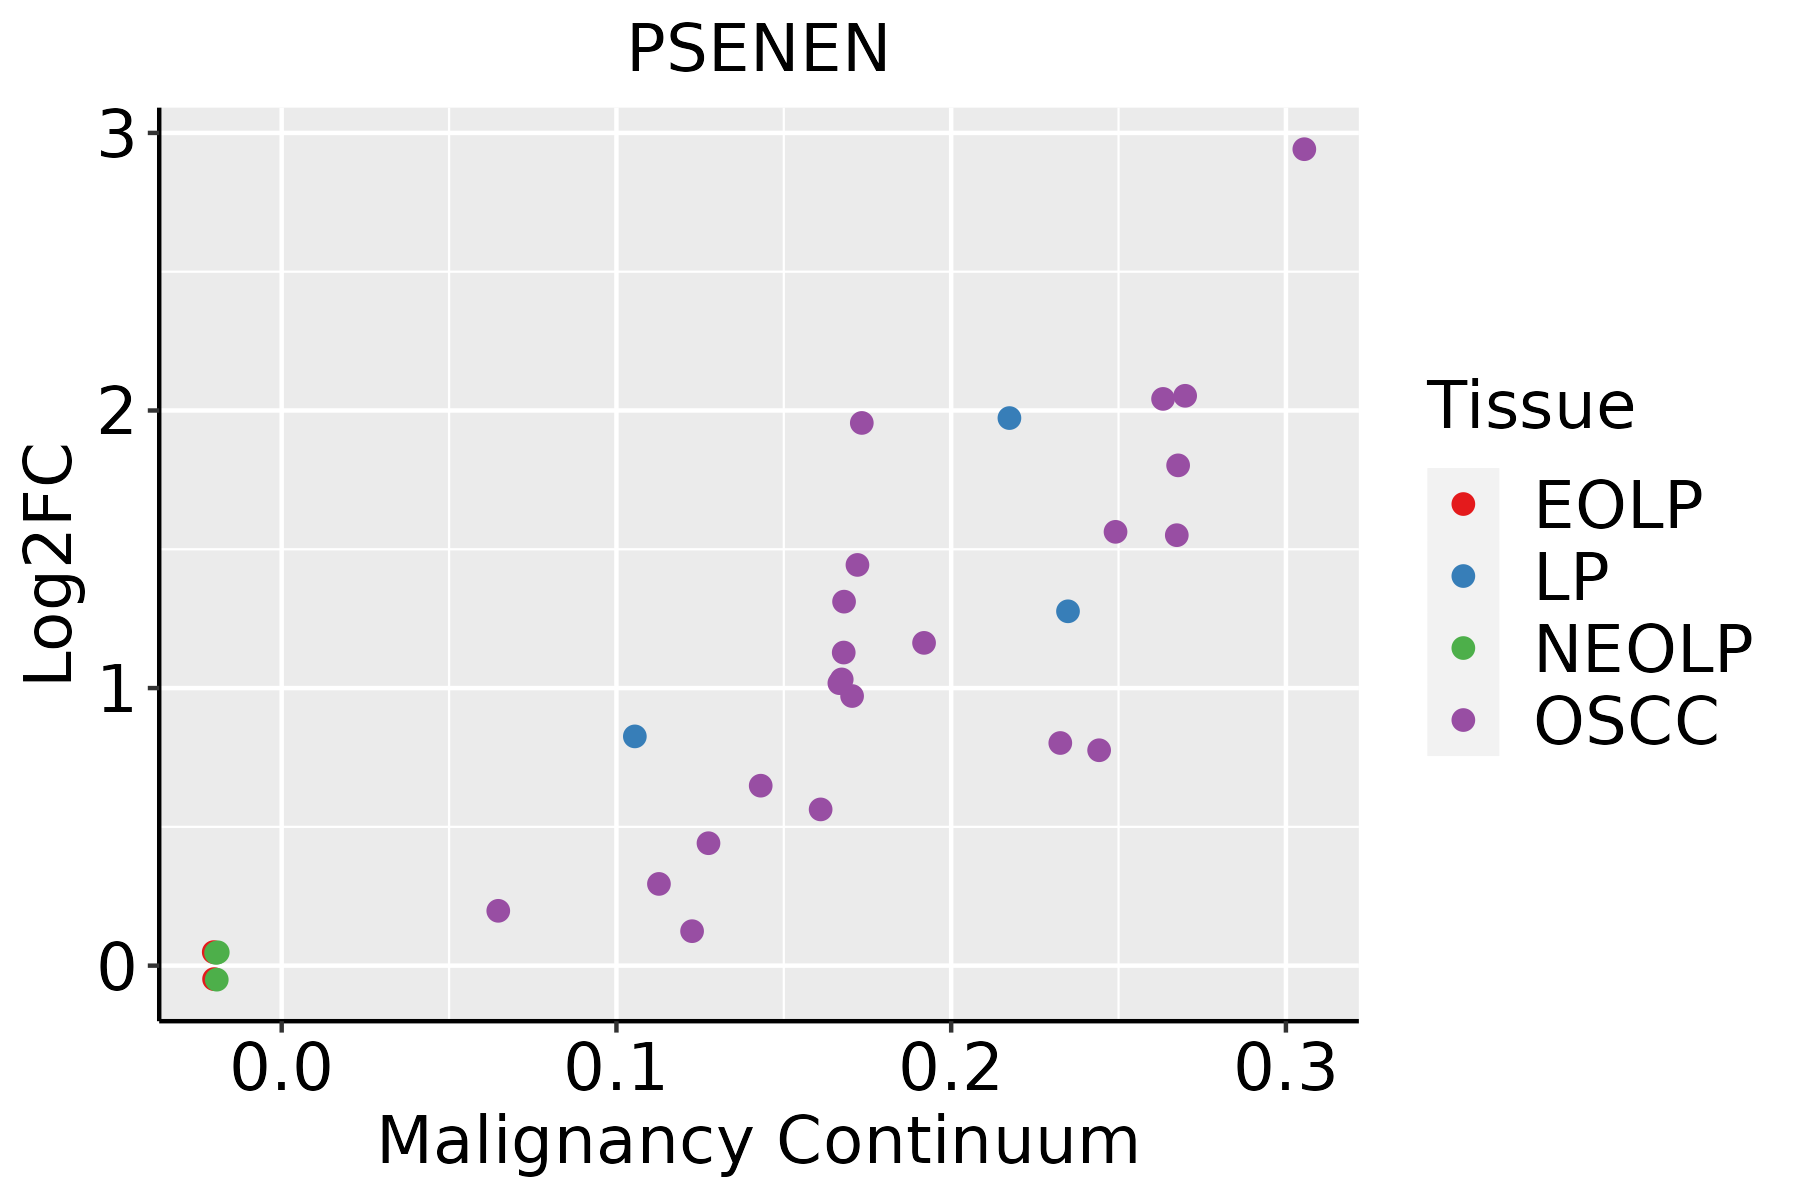 | EOLP: Erosive Oral lichen planus |
| LP: leukoplakia | ||
| NEOLP: Non-erosive oral lichen planus | ||
| OSCC: Oral squamous cell carcinoma | ||
| Prostate | 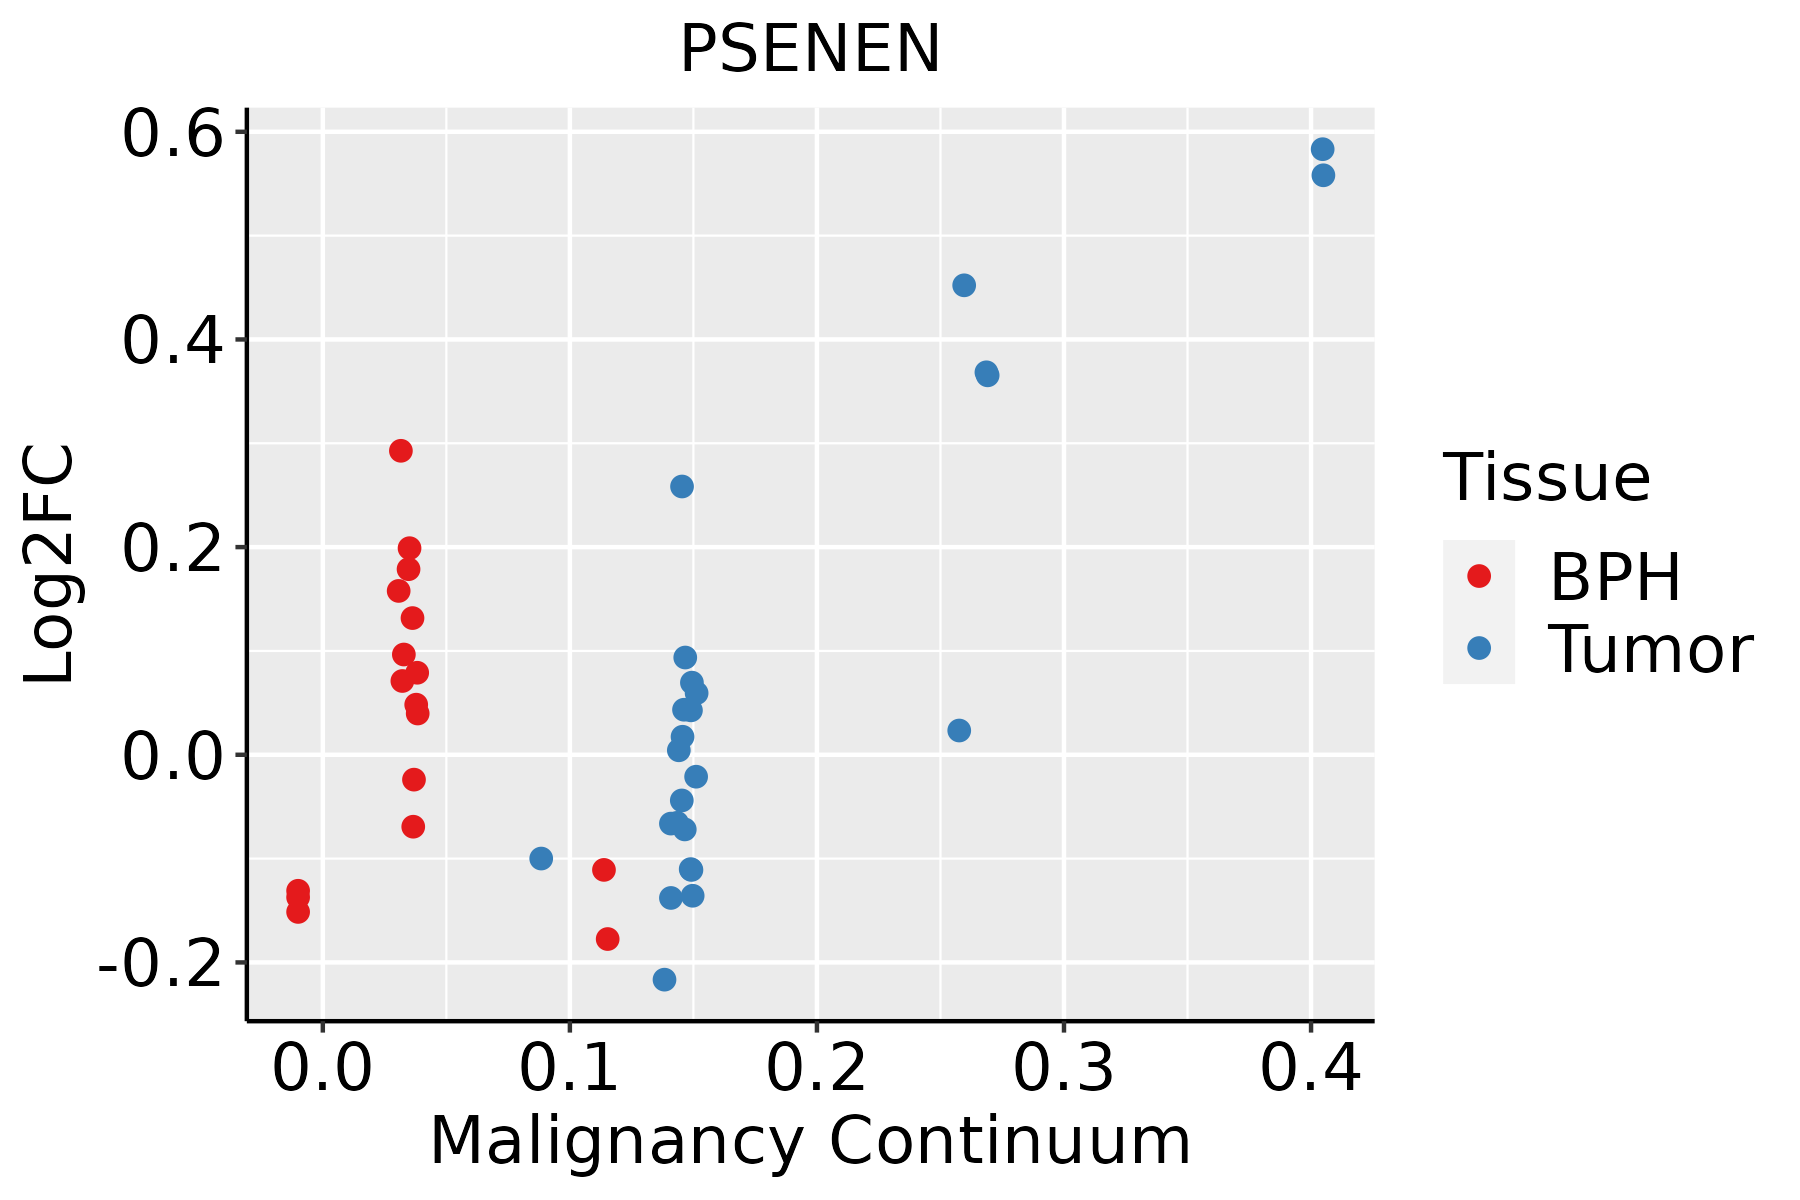 | BPH: Benign Prostatic Hyperplasia |
| Skin | 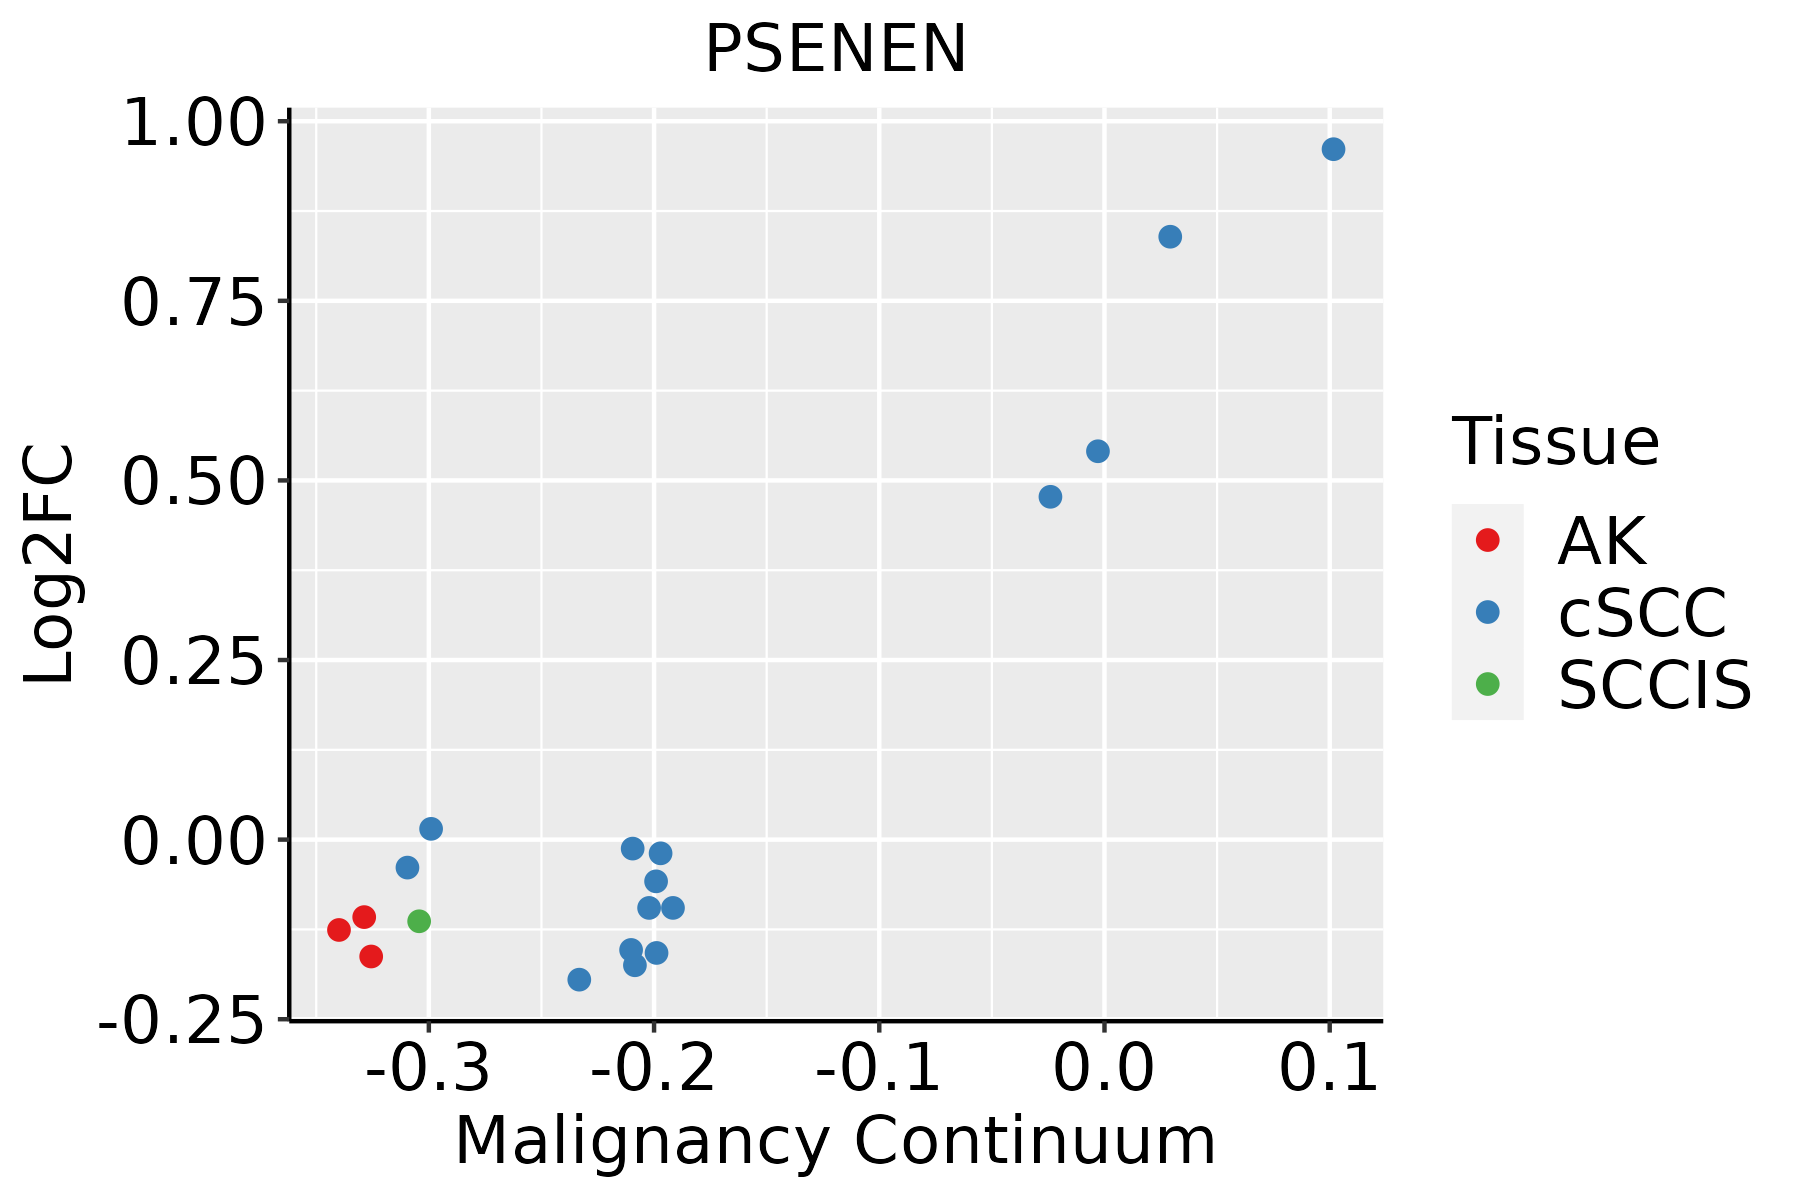 | AK: Actinic keratosis |
| cSCC: Cutaneous squamous cell carcinoma | ||
| SCCIS:squamous cell carcinoma in situ | ||
| Thyroid |  | ATC: Anaplastic thyroid cancer |
| HT: Hashimoto's thyroiditis | ||
| PTC: Papillary thyroid cancer |
| ∗log2FC in expression of this searched gene in stem-like cells from each diseased tissue sample relative to stem-like cells in normal samples in each tissue plotted against the malignancy continuum. Samples are colored based on if they are from different disease stage. |
Top |
Malignant transformation related pathway analysis |
| Find out the enriched GO biological processes and KEGG pathways involved in transition from healthy to precancer to cancer |
| Tissue | Disease Stage | Enriched GO biological Processes |
| Colorectum | AD |  |
| Colorectum | SER |  |
| Colorectum | MSS |  |
| Colorectum | MSI-H |  |
| Colorectum | FAP |  |
| ∗Top 15 enriched GO BP terms are showed in the bar plot of each disease state in each tissue. Each row represents a significant GO biological process which is colored according to the -log10(p.adjust). |
| Page: 1 2 3 4 5 6 7 8 9 |
| GO ID | Tissue | Disease Stage | Description | Gene Ratio | Bg Ratio | pvalue | p.adjust | Count |
| GO:0045862 | Colorectum | AD | positive regulation of proteolysis | 129/3918 | 372/18723 | 4.04e-10 | 3.46e-08 | 129 |
| GO:0052547 | Colorectum | AD | regulation of peptidase activity | 137/3918 | 461/18723 | 4.12e-06 | 1.12e-04 | 137 |
| GO:0010952 | Colorectum | AD | positive regulation of peptidase activity | 68/3918 | 197/18723 | 6.30e-06 | 1.59e-04 | 68 |
| GO:0052548 | Colorectum | AD | regulation of endopeptidase activity | 124/3918 | 432/18723 | 6.58e-05 | 1.07e-03 | 124 |
| GO:0010950 | Colorectum | AD | positive regulation of endopeptidase activity | 59/3918 | 179/18723 | 1.11e-04 | 1.65e-03 | 59 |
| GO:0051604 | Colorectum | AD | protein maturation | 85/3918 | 294/18723 | 6.73e-04 | 6.91e-03 | 85 |
| GO:0033619 | Colorectum | AD | membrane protein proteolysis | 21/3918 | 57/18723 | 4.16e-03 | 2.88e-02 | 21 |
| GO:0016485 | Colorectum | AD | protein processing | 63/3918 | 225/18723 | 6.77e-03 | 4.19e-02 | 63 |
| GO:0007219 | Colorectum | AD | Notch signaling pathway | 50/3918 | 172/18723 | 6.92e-03 | 4.26e-02 | 50 |
| GO:00458621 | Colorectum | SER | positive regulation of proteolysis | 106/2897 | 372/18723 | 8.40e-11 | 1.20e-08 | 106 |
| GO:00525471 | Colorectum | SER | regulation of peptidase activity | 114/2897 | 461/18723 | 1.18e-07 | 7.17e-06 | 114 |
| GO:00525481 | Colorectum | SER | regulation of endopeptidase activity | 103/2897 | 432/18723 | 2.86e-06 | 1.16e-04 | 103 |
| GO:00109521 | Colorectum | SER | positive regulation of peptidase activity | 55/2897 | 197/18723 | 5.44e-06 | 2.00e-04 | 55 |
| GO:00516041 | Colorectum | SER | protein maturation | 73/2897 | 294/18723 | 1.82e-05 | 5.38e-04 | 73 |
| GO:00109501 | Colorectum | SER | positive regulation of endopeptidase activity | 47/2897 | 179/18723 | 1.32e-04 | 2.66e-03 | 47 |
| GO:00164851 | Colorectum | SER | protein processing | 55/2897 | 225/18723 | 2.84e-04 | 4.67e-03 | 55 |
| GO:00458622 | Colorectum | MSS | positive regulation of proteolysis | 119/3467 | 372/18723 | 2.14e-10 | 2.09e-08 | 119 |
| GO:00525472 | Colorectum | MSS | regulation of peptidase activity | 130/3467 | 461/18723 | 1.81e-07 | 8.13e-06 | 130 |
| GO:00109522 | Colorectum | MSS | positive regulation of peptidase activity | 63/3467 | 197/18723 | 3.65e-06 | 1.06e-04 | 63 |
| GO:00525482 | Colorectum | MSS | regulation of endopeptidase activity | 117/3467 | 432/18723 | 6.25e-06 | 1.65e-04 | 117 |
| Page: 1 2 3 4 5 6 7 8 9 |
| Pathway ID | Tissue | Disease Stage | Description | Gene Ratio | Bg Ratio | pvalue | p.adjust | qvalue | Count |
| hsa05010 | Colorectum | AD | Alzheimer disease | 174/2092 | 384/8465 | 1.82e-19 | 9.26e-18 | 5.91e-18 | 174 |
| hsa050101 | Colorectum | AD | Alzheimer disease | 174/2092 | 384/8465 | 1.82e-19 | 9.26e-18 | 5.91e-18 | 174 |
| hsa050102 | Colorectum | SER | Alzheimer disease | 146/1580 | 384/8465 | 6.52e-20 | 2.40e-18 | 1.75e-18 | 146 |
| hsa050103 | Colorectum | SER | Alzheimer disease | 146/1580 | 384/8465 | 6.52e-20 | 2.40e-18 | 1.75e-18 | 146 |
| hsa050104 | Colorectum | MSS | Alzheimer disease | 169/1875 | 384/8465 | 1.21e-22 | 1.01e-20 | 6.21e-21 | 169 |
| hsa050105 | Colorectum | MSS | Alzheimer disease | 169/1875 | 384/8465 | 1.21e-22 | 1.01e-20 | 6.21e-21 | 169 |
| hsa050106 | Colorectum | MSI-H | Alzheimer disease | 91/797 | 384/8465 | 1.76e-17 | 6.41e-16 | 5.37e-16 | 91 |
| hsa050107 | Colorectum | MSI-H | Alzheimer disease | 91/797 | 384/8465 | 1.76e-17 | 6.41e-16 | 5.37e-16 | 91 |
| hsa0501030 | Esophagus | HGIN | Alzheimer disease | 130/1383 | 384/8465 | 5.26e-18 | 1.71e-16 | 1.36e-16 | 130 |
| hsa05010113 | Esophagus | HGIN | Alzheimer disease | 130/1383 | 384/8465 | 5.26e-18 | 1.71e-16 | 1.36e-16 | 130 |
| hsa05010210 | Esophagus | ESCC | Alzheimer disease | 263/4205 | 384/8465 | 1.80e-14 | 5.47e-13 | 2.80e-13 | 263 |
| hsa043306 | Esophagus | ESCC | Notch signaling pathway | 42/4205 | 62/8465 | 2.97e-03 | 7.97e-03 | 4.08e-03 | 42 |
| hsa0501038 | Esophagus | ESCC | Alzheimer disease | 263/4205 | 384/8465 | 1.80e-14 | 5.47e-13 | 2.80e-13 | 263 |
| hsa0433013 | Esophagus | ESCC | Notch signaling pathway | 42/4205 | 62/8465 | 2.97e-03 | 7.97e-03 | 4.08e-03 | 42 |
| hsa0501014 | Liver | Cirrhotic | Alzheimer disease | 180/2530 | 384/8465 | 5.52e-13 | 1.36e-11 | 8.36e-12 | 180 |
| hsa0501015 | Liver | Cirrhotic | Alzheimer disease | 180/2530 | 384/8465 | 5.52e-13 | 1.36e-11 | 8.36e-12 | 180 |
| hsa0501022 | Liver | HCC | Alzheimer disease | 254/4020 | 384/8465 | 3.75e-14 | 8.97e-13 | 4.99e-13 | 254 |
| hsa0501032 | Liver | HCC | Alzheimer disease | 254/4020 | 384/8465 | 3.75e-14 | 8.97e-13 | 4.99e-13 | 254 |
| hsa0501028 | Oral cavity | OSCC | Alzheimer disease | 244/3704 | 384/8465 | 1.18e-15 | 3.60e-14 | 1.83e-14 | 244 |
| hsa043305 | Oral cavity | OSCC | Notch signaling pathway | 44/3704 | 62/8465 | 1.26e-05 | 5.55e-05 | 2.83e-05 | 44 |
| Page: 1 2 |
Top |
Cell-cell communication analysis |
| Identification of potential cell-cell interactions between two cell types and their ligand-receptor pairs for different disease states |
| Ligand | Receptor | LRpair | Pathway | Tissue | Disease Stage |
| Page: 1 |
Top |
Single-cell gene regulatory network inference analysis |
| Find out the significant the regulons (TFs) and the target genes of each regulon across cell types for different disease states |
| TF | Cell Type | Tissue | Disease Stage | Target Gene | RSS | Regulon Activity |
| ∗The dot plots of a searched regulon are shown for all cell subpopulations in each disease state of each tissue based on the regulon specific score inferred using pySCENIC and by calculating the average expression. |
| Page: 1 |
Top |
Somatic mutation of malignant transformation related genes |
| Annotation of somatic variants for genes involved in malignant transformation |
| Hugo Symbol | Variant Class | Variant Classification | dbSNP RS | HGVSc | HGVSp | HGVSp Short | SWISSPROT | BIOTYPE | SIFT | PolyPhen | Tumor Sample Barcode | Tissue | Histology | Sex | Age | Stage | Therapy Types | Drugs | Outcome |
| PSENEN | SNV | Missense_Mutation | rs758352978 | c.116N>A | p.Arg39Gln | p.R39Q | Q9NZ42 | protein_coding | tolerated(0.16) | benign(0.009) | TCGA-E2-A1LH-01 | Breast | breast invasive carcinoma | Female | <65 | I/II | Chemotherapy | adriamycin | SD |
| PSENEN | SNV | Missense_Mutation | novel | c.176N>A | p.Arg59His | p.R59H | Q9NZ42 | protein_coding | tolerated(0.54) | possibly_damaging(0.616) | TCGA-2W-A8YY-01 | Cervix | cervical & endocervical cancer | Female | <65 | I/II | Chemotherapy | cisplatin | CR |
| PSENEN | SNV | Missense_Mutation | novel | c.121N>C | p.Ala41Pro | p.A41P | Q9NZ42 | protein_coding | deleterious(0) | probably_damaging(0.999) | TCGA-A5-A1OF-01 | Endometrium | uterine corpus endometrioid carcinoma | Female | <65 | I/II | Unknown | Unknown | SD |
| PSENEN | SNV | Missense_Mutation | rs201796315 | c.127N>T | p.Leu43Phe | p.L43F | Q9NZ42 | protein_coding | tolerated(0.7) | benign(0.007) | TCGA-AX-A2HD-01 | Endometrium | uterine corpus endometrioid carcinoma | Female | >=65 | III/IV | Unknown | Unknown | SD |
| PSENEN | SNV | Missense_Mutation | novel | c.19N>C | p.Ser7Pro | p.S7P | Q9NZ42 | protein_coding | tolerated(1) | benign(0.007) | TCGA-EO-A22R-01 | Endometrium | uterine corpus endometrioid carcinoma | Female | <65 | I/II | Unknown | Unknown | SD |
| PSENEN | SNV | Missense_Mutation | c.127C>G | p.Leu43Val | p.L43V | Q9NZ42 | protein_coding | tolerated(0.5) | benign(0.007) | TCGA-93-7347-01 | Lung | lung adenocarcinoma | Female | >=65 | I/II | Unknown | Unknown | SD | |
| PSENEN | SNV | Missense_Mutation | c.90G>T | p.Trp30Cys | p.W30C | Q9NZ42 | protein_coding | deleterious(0) | probably_damaging(0.998) | TCGA-70-6722-01 | Lung | lung squamous cell carcinoma | Male | <65 | III/IV | Unknown | Unknown | PD | |
| PSENEN | SNV | Missense_Mutation | novel | c.236A>G | p.Gln79Arg | p.Q79R | Q9NZ42 | protein_coding | deleterious(0.01) | probably_damaging(0.982) | TCGA-77-7141-01 | Lung | lung squamous cell carcinoma | Male | <65 | I/II | Unknown | Unknown | SD |
| PSENEN | SNV | Missense_Mutation | novel | c.61G>C | p.Gly21Arg | p.G21R | Q9NZ42 | protein_coding | deleterious(0.02) | probably_damaging(1) | TCGA-77-7465-01 | Lung | lung squamous cell carcinoma | Male | <65 | I/II | Unknown | Unknown | SD |
| PSENEN | SNV | Missense_Mutation | novel | c.25N>A | p.Glu9Lys | p.E9K | Q9NZ42 | protein_coding | deleterious(0.03) | possibly_damaging(0.509) | TCGA-85-A4CL-01 | Lung | lung squamous cell carcinoma | Male | >=65 | I/II | Unknown | Unknown | SD |
| Page: 1 2 |
Top |
Related drugs of malignant transformation related genes |
| Identification of chemicals and drugs interact with genes involved in malignant transfromation |
| (DGIdb 4.0) |
| Entrez ID | Symbol | Category | Interaction Types | Drug Claim Name | Drug Name | PMIDs |
| 55851 | PSENEN | DRUGGABLE GENOME | inhibitor | RO 4929097 | ||
| 55851 | PSENEN | DRUGGABLE GENOME | inhibitor | CHEMBL1090771 | AVAGACESTAT | |
| 55851 | PSENEN | DRUGGABLE GENOME | BMS-299897 | CHEMBL247471 | ||
| 55851 | PSENEN | DRUGGABLE GENOME | LY-411575 | CHEMBL392068 | 23181502,19443228 | |
| 55851 | PSENEN | DRUGGABLE GENOME | inhibitor | PF03084014 | ||
| 55851 | PSENEN | DRUGGABLE GENOME | inhibitor | MK0752 | ||
| 55851 | PSENEN | DRUGGABLE GENOME | NIC5-15 | METHYLINOSITOL | ||
| 55851 | PSENEN | DRUGGABLE GENOME | GSI-136 | GSI-136 | ||
| 55851 | PSENEN | DRUGGABLE GENOME | SEMAGACESTAT | SEMAGACESTAT | 19443228 | |
| 55851 | PSENEN | DRUGGABLE GENOME | inhibitor | CHEMBL463981 | BEGACESTAT |
| Page: 1 2 |

Copyright 2023-Present -The University of Texas Health Science Center at Houston |