
|
|||||
|
 | |
| |
| |
| |
| |
| |
|
Gene: PRDM1 |
Gene summary for PRDM1 |
| Gene information | Species | Human | Gene symbol | PRDM1 | Gene ID | 639 |
| Gene name | PR/SET domain 1 | |
| Gene Alias | BLIMP1 | |
| Cytomap | 6q21 | |
| Gene Type | protein-coding | GO ID | GO:0000003 | UniProtAcc | O75626 |
Top |
Malignant transformation analysis |
| Identification of the aberrant gene expression in precancerous and cancerous lesions by comparing the gene expression of stem-like cells in diseased tissues with normal stem cells |
| Entrez ID | Symbol | Replicates | Species | Organ | Tissue | Adj P-value | Log2FC | Malignancy |
| 639 | PRDM1 | P47T-E | Human | Esophagus | ESCC | 3.99e-06 | 2.37e-01 | 0.1067 |
| 639 | PRDM1 | P48T-E | Human | Esophagus | ESCC | 4.18e-04 | 1.69e-01 | 0.0959 |
| 639 | PRDM1 | P49T-E | Human | Esophagus | ESCC | 2.72e-03 | 7.17e-01 | 0.1768 |
| 639 | PRDM1 | P52T-E | Human | Esophagus | ESCC | 7.64e-03 | 1.29e-01 | 0.1555 |
| 639 | PRDM1 | P62T-E | Human | Esophagus | ESCC | 4.80e-05 | 1.95e-01 | 0.1302 |
| 639 | PRDM1 | P74T-E | Human | Esophagus | ESCC | 3.12e-05 | 2.53e-01 | 0.1479 |
| 639 | PRDM1 | P75T-E | Human | Esophagus | ESCC | 6.25e-09 | 3.25e-01 | 0.1125 |
| 639 | PRDM1 | P76T-E | Human | Esophagus | ESCC | 9.34e-03 | 1.63e-01 | 0.1207 |
| 639 | PRDM1 | P79T-E | Human | Esophagus | ESCC | 1.05e-03 | 5.00e-02 | 0.1154 |
| 639 | PRDM1 | P82T-E | Human | Esophagus | ESCC | 3.34e-02 | 2.67e-01 | 0.1072 |
| 639 | PRDM1 | P83T-E | Human | Esophagus | ESCC | 2.02e-05 | 2.19e-01 | 0.1738 |
| 639 | PRDM1 | P84T-E | Human | Esophagus | ESCC | 1.73e-04 | 8.24e-01 | 0.0933 |
| 639 | PRDM1 | P89T-E | Human | Esophagus | ESCC | 6.52e-06 | 5.34e-01 | 0.1752 |
| 639 | PRDM1 | P107T-E | Human | Esophagus | ESCC | 2.52e-02 | 1.37e-01 | 0.171 |
| 639 | PRDM1 | P127T-E | Human | Esophagus | ESCC | 3.99e-07 | 3.11e-01 | 0.0826 |
| 639 | PRDM1 | P128T-E | Human | Esophagus | ESCC | 3.00e-08 | 3.80e-01 | 0.1241 |
| 639 | PRDM1 | P130T-E | Human | Esophagus | ESCC | 5.77e-14 | 4.25e-01 | 0.1676 |
| 639 | PRDM1 | C21 | Human | Oral cavity | OSCC | 5.67e-03 | 3.33e-01 | 0.2678 |
| 639 | PRDM1 | C43 | Human | Oral cavity | OSCC | 5.80e-06 | 4.15e-01 | 0.1704 |
| 639 | PRDM1 | C57 | Human | Oral cavity | OSCC | 3.47e-16 | 6.91e-01 | 0.1679 |
| Page: 1 2 3 |
| Tissue | Expression Dynamics | Abbreviation |
| Esophagus |  | ESCC: Esophageal squamous cell carcinoma |
| HGIN: High-grade intraepithelial neoplasias | ||
| LGIN: Low-grade intraepithelial neoplasias | ||
| Oral Cavity | 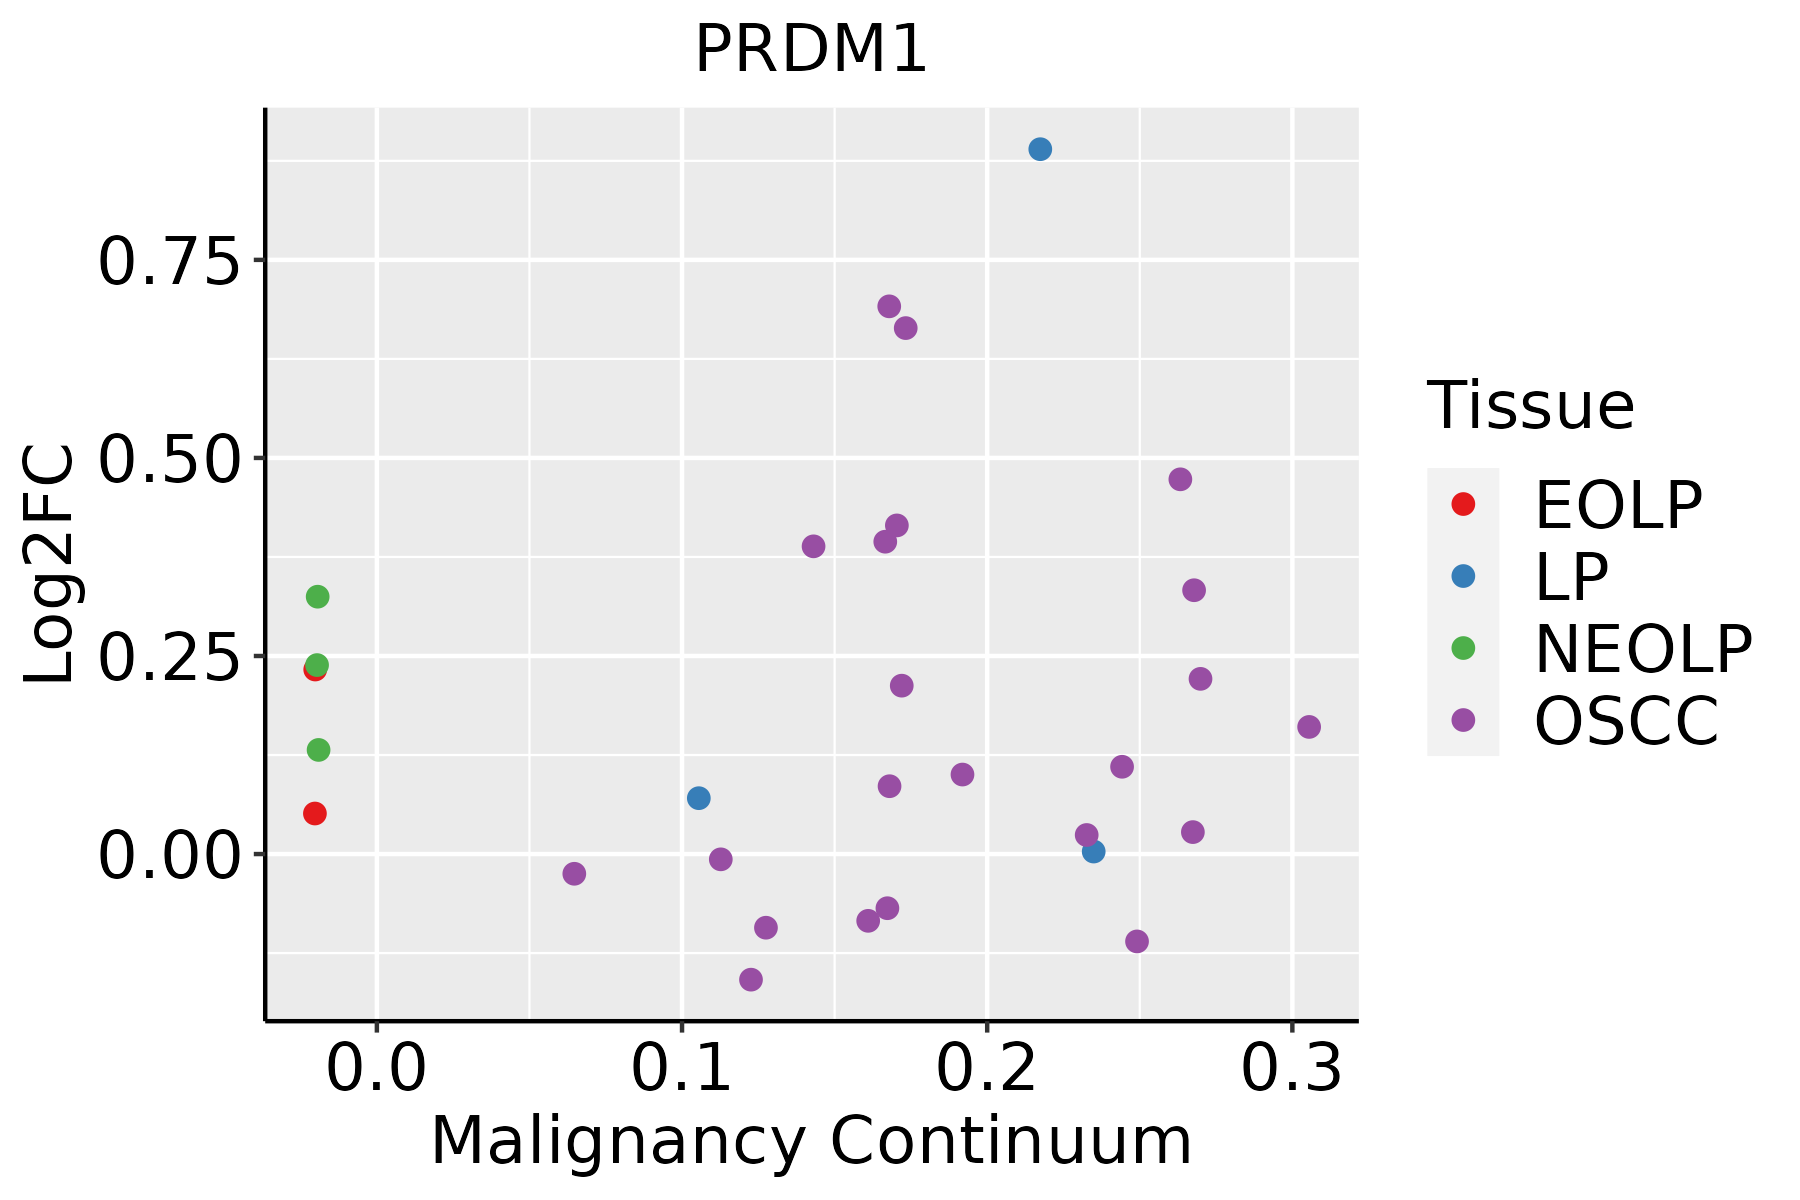 | EOLP: Erosive Oral lichen planus |
| LP: leukoplakia | ||
| NEOLP: Non-erosive oral lichen planus | ||
| OSCC: Oral squamous cell carcinoma | ||
| Prostate | 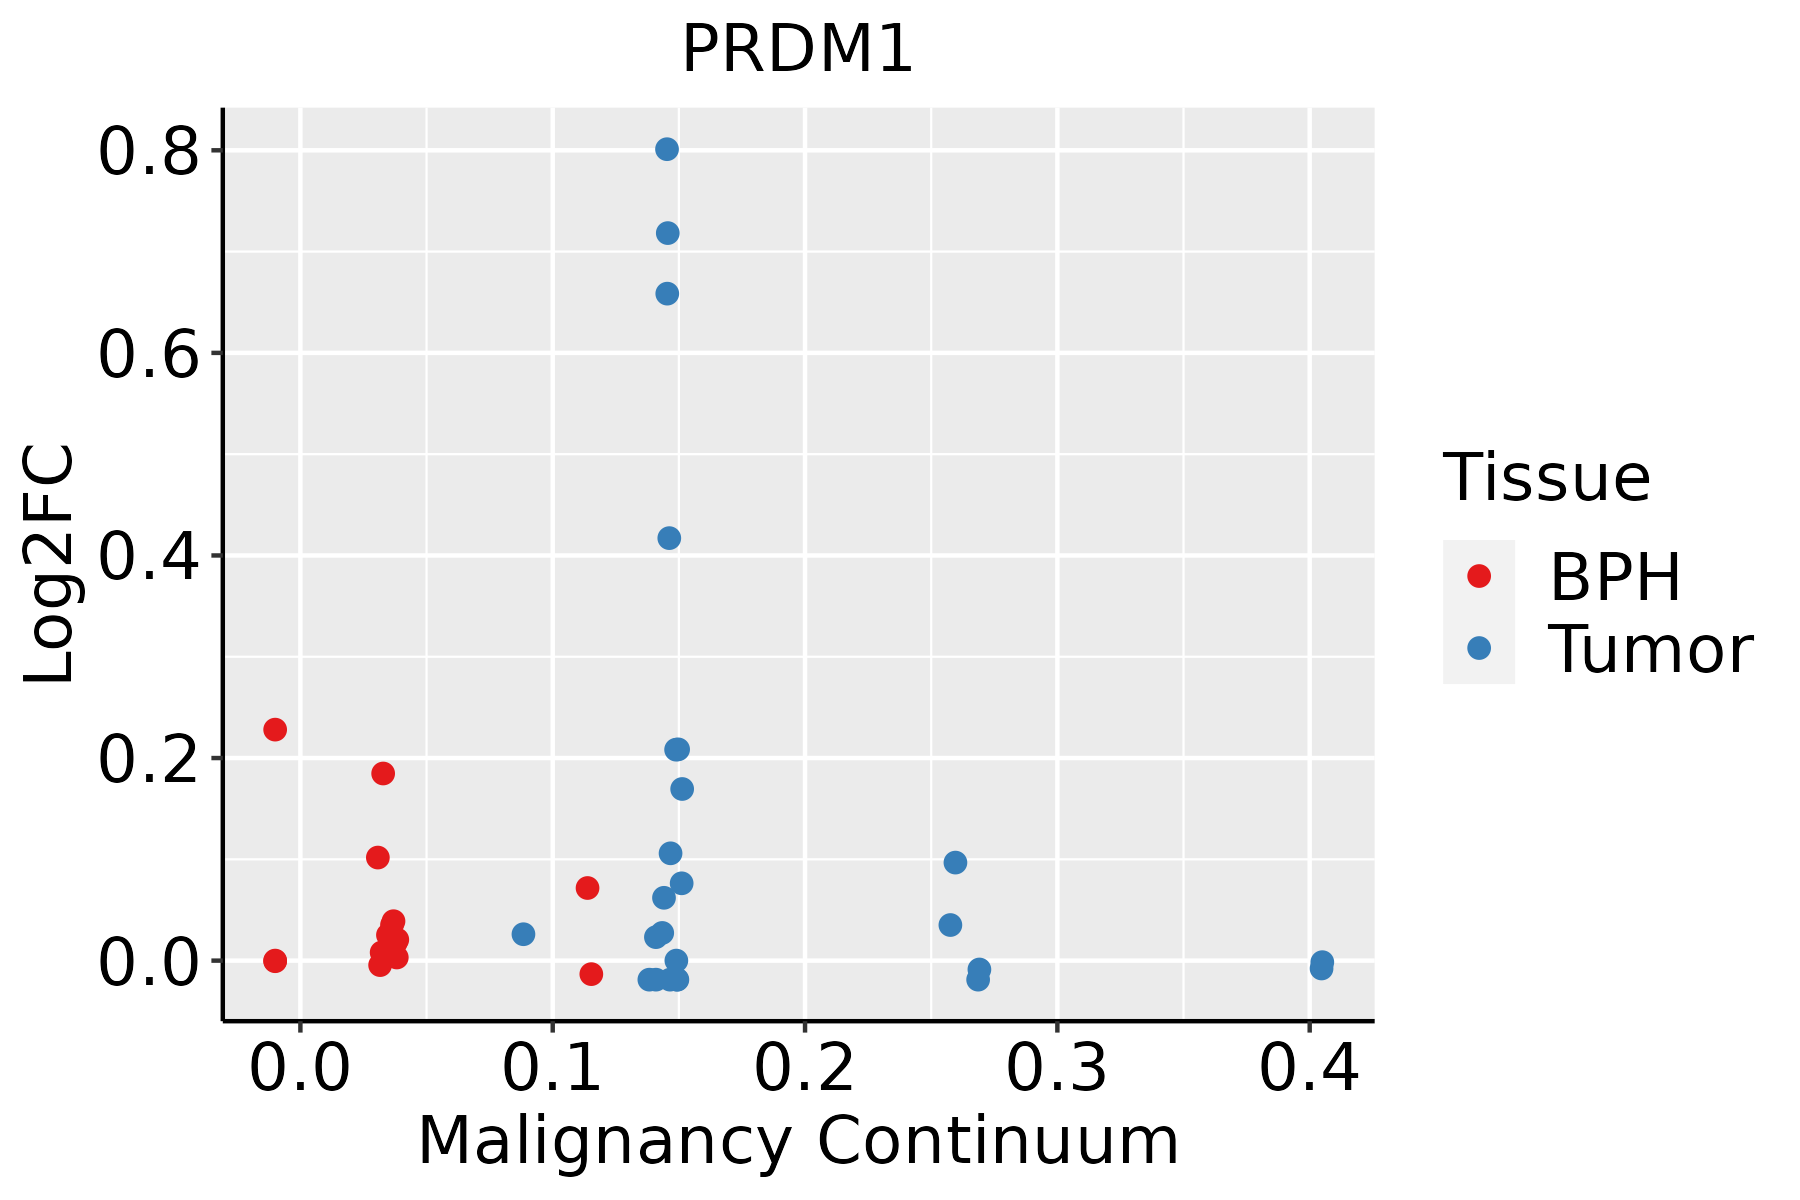 | BPH: Benign Prostatic Hyperplasia |
| Thyroid | 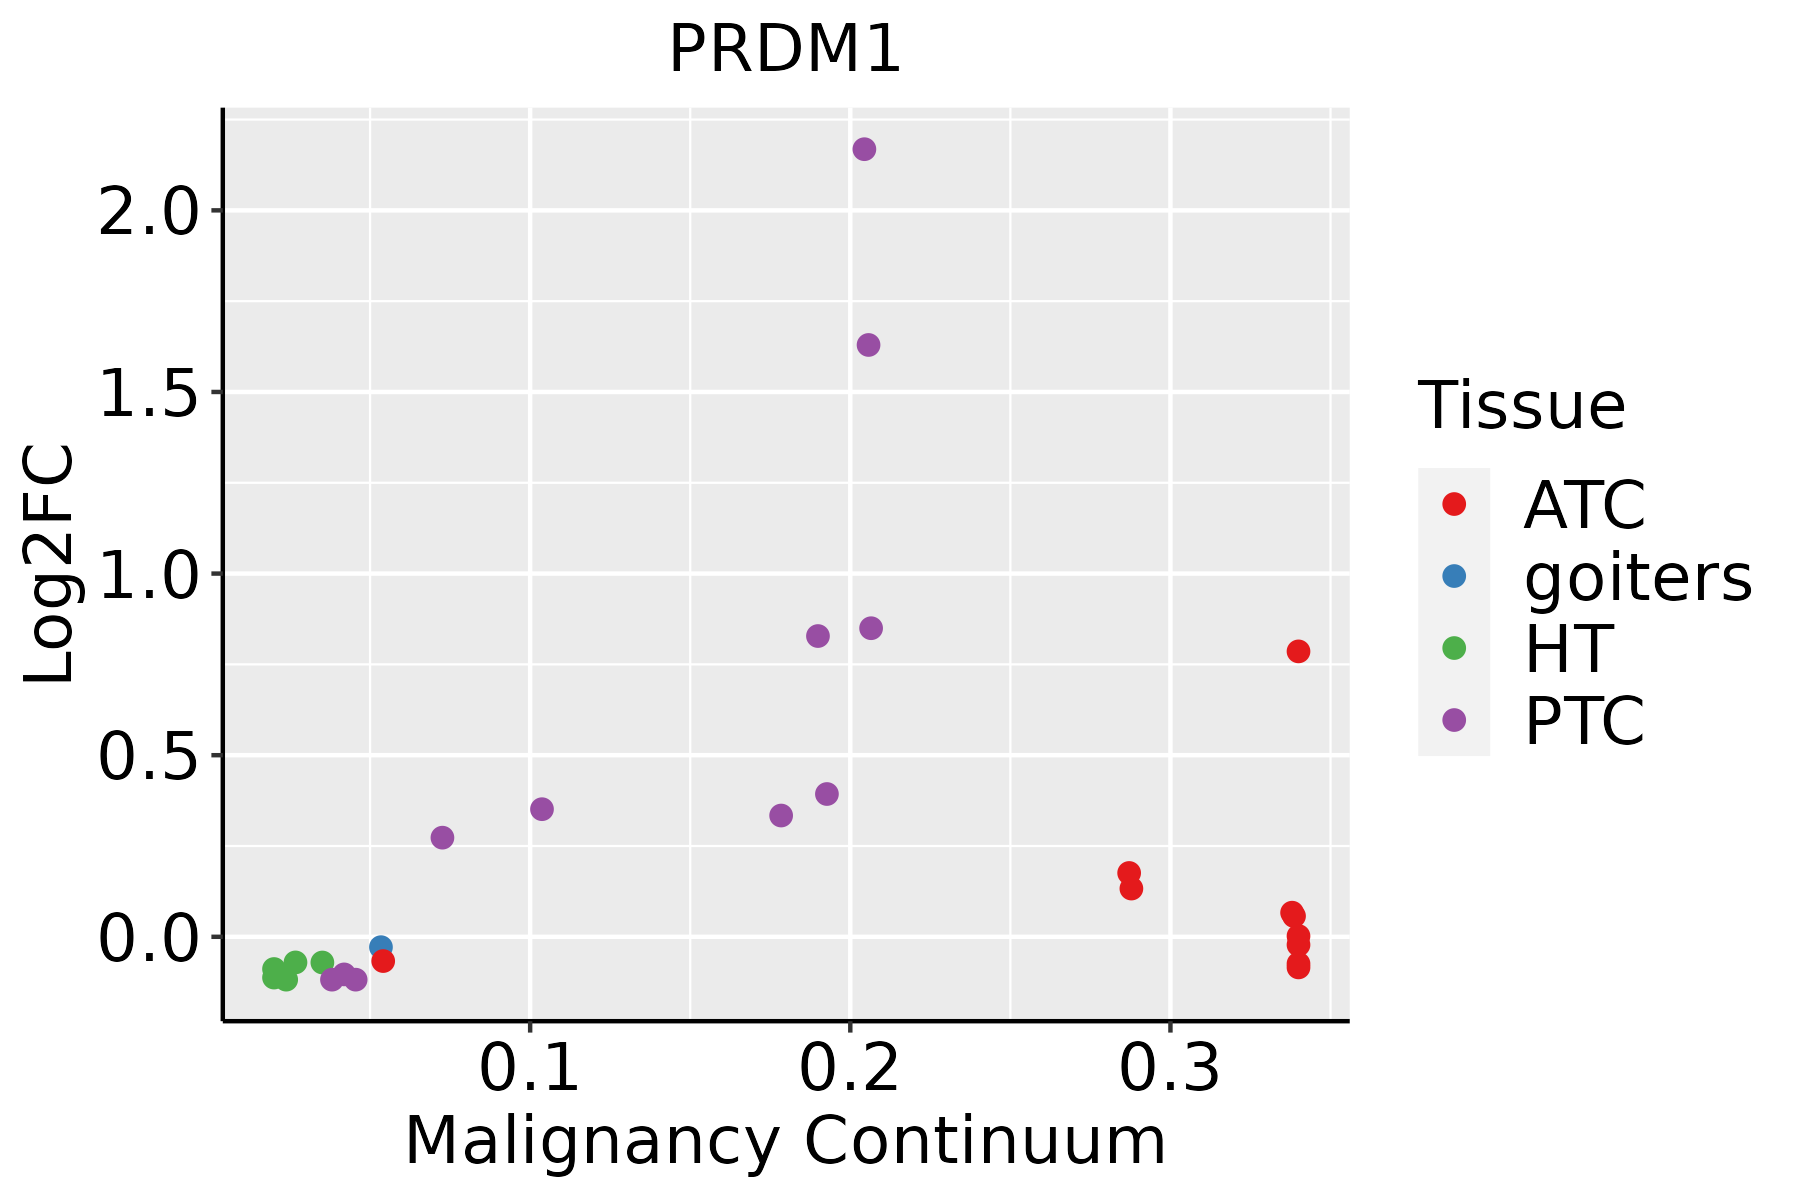 | ATC: Anaplastic thyroid cancer |
| HT: Hashimoto's thyroiditis | ||
| PTC: Papillary thyroid cancer |
| ∗log2FC in expression of this searched gene in stem-like cells from each diseased tissue sample relative to stem-like cells in normal samples in each tissue plotted against the malignancy continuum. Samples are colored based on if they are from different disease stage. |
Top |
Malignant transformation related pathway analysis |
| Find out the enriched GO biological processes and KEGG pathways involved in transition from healthy to precancer to cancer |
| Tissue | Disease Stage | Enriched GO biological Processes |
| Colorectum | AD |  |
| Colorectum | SER |  |
| Colorectum | MSS |  |
| Colorectum | MSI-H |  |
| Colorectum | FAP |  |
| ∗Top 15 enriched GO BP terms are showed in the bar plot of each disease state in each tissue. Each row represents a significant GO biological process which is colored according to the -log10(p.adjust). |
| Page: 1 2 3 4 5 6 7 8 9 |
| GO ID | Tissue | Disease Stage | Description | Gene Ratio | Bg Ratio | pvalue | p.adjust | Count |
| GO:000170119 | Esophagus | ESCC | in utero embryonic development | 243/8552 | 367/18723 | 1.00e-15 | 6.86e-14 | 243 |
| GO:00322592 | Esophagus | ESCC | methylation | 222/8552 | 364/18723 | 2.26e-09 | 5.09e-08 | 222 |
| GO:0001890110 | Esophagus | ESCC | placenta development | 98/8552 | 144/18723 | 4.46e-08 | 8.11e-07 | 98 |
| GO:0061458110 | Esophagus | ESCC | reproductive system development | 247/8552 | 427/18723 | 2.24e-07 | 3.42e-06 | 247 |
| GO:004860818 | Esophagus | ESCC | reproductive structure development | 245/8552 | 424/18723 | 2.82e-07 | 4.14e-06 | 245 |
| GO:000206420 | Esophagus | ESCC | epithelial cell development | 136/8552 | 220/18723 | 9.50e-07 | 1.21e-05 | 136 |
| GO:00097919 | Esophagus | ESCC | post-embryonic development | 56/8552 | 80/18723 | 9.08e-06 | 8.71e-05 | 56 |
| GO:000189219 | Esophagus | ESCC | embryonic placenta development | 57/8552 | 82/18723 | 1.06e-05 | 1.01e-04 | 57 |
| GO:00018937 | Esophagus | ESCC | maternal placenta development | 28/8552 | 35/18723 | 3.40e-05 | 2.78e-04 | 28 |
| GO:1903706110 | Esophagus | ESCC | regulation of hemopoiesis | 201/8552 | 367/18723 | 2.60e-04 | 1.58e-03 | 201 |
| GO:00485687 | Esophagus | ESCC | embryonic organ development | 228/8552 | 427/18723 | 7.28e-04 | 3.79e-03 | 228 |
| GO:004211018 | Esophagus | ESCC | T cell activation | 256/8552 | 487/18723 | 1.18e-03 | 5.87e-03 | 256 |
| GO:19031317 | Esophagus | ESCC | mononuclear cell differentiation | 226/8552 | 426/18723 | 1.20e-03 | 5.88e-03 | 226 |
| GO:190210510 | Esophagus | ESCC | regulation of leukocyte differentiation | 152/8552 | 279/18723 | 1.82e-03 | 8.35e-03 | 152 |
| GO:00601357 | Esophagus | ESCC | maternal process involved in female pregnancy | 40/8552 | 62/18723 | 2.14e-03 | 9.54e-03 | 40 |
| GO:00605763 | Esophagus | ESCC | intestinal epithelial cell development | 12/8552 | 14/18723 | 2.51e-03 | 1.08e-02 | 12 |
| GO:0002066 | Esophagus | ESCC | columnar/cuboidal epithelial cell development | 29/8552 | 44/18723 | 5.41e-03 | 2.02e-02 | 29 |
| GO:00607065 | Esophagus | ESCC | cell differentiation involved in embryonic placenta development | 18/8552 | 25/18723 | 7.04e-03 | 2.56e-02 | 18 |
| GO:00016559 | Esophagus | ESCC | urogenital system development | 177/8552 | 338/18723 | 7.51e-03 | 2.69e-02 | 177 |
| GO:00302176 | Esophagus | ESCC | T cell differentiation | 137/8552 | 257/18723 | 8.09e-03 | 2.87e-02 | 137 |
| Page: 1 2 3 4 5 6 7 8 9 10 11 12 |
| Pathway ID | Tissue | Disease Stage | Description | Gene Ratio | Bg Ratio | pvalue | p.adjust | qvalue | Count |
| Page: 1 |
Top |
Cell-cell communication analysis |
| Identification of potential cell-cell interactions between two cell types and their ligand-receptor pairs for different disease states |
| Ligand | Receptor | LRpair | Pathway | Tissue | Disease Stage |
| Page: 1 |
Top |
Single-cell gene regulatory network inference analysis |
| Find out the significant the regulons (TFs) and the target genes of each regulon across cell types for different disease states |
| TF | Cell Type | Tissue | Disease Stage | Target Gene | RSS | Regulon Activity |
| PRDM1 | IMENT | Colorectum | Healthy | ZC3HAV1,TMCC3,SNX9, etc. | 3.17e-01 |  |
| PRDM1 | AT2L | Lung | AIS | ANKRD28,MZB1,TXNDC5, etc. | 6.50e-01 |  |
| PRDM1 | PLA | Thyroid | HT | RNF213,ETS1,CD2, etc. | 5.77e-01 |  |
| ∗The dot plots of a searched regulon are shown for all cell subpopulations in each disease state of each tissue based on the regulon specific score inferred using pySCENIC and by calculating the average expression. |
| Page: 1 |
Top |
Somatic mutation of malignant transformation related genes |
| Annotation of somatic variants for genes involved in malignant transformation |
| Hugo Symbol | Variant Class | Variant Classification | dbSNP RS | HGVSc | HGVSp | HGVSp Short | SWISSPROT | BIOTYPE | SIFT | PolyPhen | Tumor Sample Barcode | Tissue | Histology | Sex | Age | Stage | Therapy Types | Drugs | Outcome |
| PRDM1 | SNV | Missense_Mutation | c.641N>C | p.Gly214Ala | p.G214A | O75626 | protein_coding | tolerated(0.05) | benign(0.003) | TCGA-A7-A0DA-01 | Breast | breast invasive carcinoma | Female | <65 | I/II | Chemotherapy | adriamycin | SD | |
| PRDM1 | SNV | Missense_Mutation | c.1741G>A | p.Ala581Thr | p.A581T | O75626 | protein_coding | tolerated(0.4) | benign(0.007) | TCGA-A8-A06R-01 | Breast | breast invasive carcinoma | Female | >=65 | I/II | Chemotherapy | 5-fluorouracil | CR | |
| PRDM1 | SNV | Missense_Mutation | c.1629C>A | p.Ser543Arg | p.S543R | O75626 | protein_coding | tolerated(0.4) | benign(0.034) | TCGA-A8-A09N-01 | Breast | breast invasive carcinoma | Female | <65 | III/IV | Unknown | Unknown | SD | |
| PRDM1 | SNV | Missense_Mutation | c.709G>A | p.Glu237Lys | p.E237K | O75626 | protein_coding | tolerated(0.52) | benign(0.009) | TCGA-AC-A23H-01 | Breast | breast invasive carcinoma | Female | >=65 | I/II | Unknown | Unknown | PD | |
| PRDM1 | SNV | Missense_Mutation | c.1735N>A | p.Val579Ile | p.V579I | O75626 | protein_coding | tolerated(0.33) | benign(0.023) | TCGA-AC-A6IW-01 | Breast | breast invasive carcinoma | Female | >=65 | I/II | Unknown | Unknown | SD | |
| PRDM1 | SNV | Missense_Mutation | novel | c.1288N>C | p.Ser430Arg | p.S430R | O75626 | protein_coding | deleterious(0.05) | benign(0.013) | TCGA-AN-A04D-01 | Breast | breast invasive carcinoma | Female | <65 | I/II | Unknown | Unknown | SD |
| PRDM1 | SNV | Missense_Mutation | c.1047C>G | p.Ser349Arg | p.S349R | O75626 | protein_coding | tolerated(0.2) | benign(0.409) | TCGA-AN-A0AT-01 | Breast | breast invasive carcinoma | Female | <65 | I/II | Unknown | Unknown | SD | |
| PRDM1 | SNV | Missense_Mutation | c.461A>G | p.Glu154Gly | p.E154G | O75626 | protein_coding | deleterious(0.02) | possibly_damaging(0.502) | TCGA-B6-A0I9-01 | Breast | breast invasive carcinoma | Female | <65 | III/IV | Unknown | Unknown | PD | |
| PRDM1 | SNV | Missense_Mutation | rs764666878 | c.2298N>C | p.Glu766Asp | p.E766D | O75626 | protein_coding | deleterious(0.04) | probably_damaging(0.96) | TCGA-BH-A42U-01 | Breast | breast invasive carcinoma | Female | >=65 | I/II | Unknown | Unknown | SD |
| PRDM1 | SNV | Missense_Mutation | c.1850N>G | p.His617Arg | p.H617R | O75626 | protein_coding | deleterious(0) | probably_damaging(0.999) | TCGA-D8-A1JP-01 | Breast | breast invasive carcinoma | Female | >=65 | I/II | Hormone Therapy | tamoxiphen | SD |
| Page: 1 2 3 4 5 6 7 8 9 10 |
Top |
Related drugs of malignant transformation related genes |
| Identification of chemicals and drugs interact with genes involved in malignant transfromation |
| (DGIdb 4.0) |
| Entrez ID | Symbol | Category | Interaction Types | Drug Claim Name | Drug Name | PMIDs |
| Page: 1 |

Copyright 2023-Present -The University of Texas Health Science Center at Houston |