
|
|||||
|
 | |
| |
| |
| |
| |
| |
|
Gene: PPP6R1 |
Gene summary for PPP6R1 |
| Gene information | Species | Human | Gene symbol | PPP6R1 | Gene ID | 22870 |
| Gene name | protein phosphatase 6 regulatory subunit 1 | |
| Gene Alias | KIAA1115 | |
| Cytomap | 19q13.42 | |
| Gene Type | protein-coding | GO ID | GO:0006464 | UniProtAcc | Q9UPN7 |
Top |
Malignant transformation analysis |
| Identification of the aberrant gene expression in precancerous and cancerous lesions by comparing the gene expression of stem-like cells in diseased tissues with normal stem cells |
| Entrez ID | Symbol | Replicates | Species | Organ | Tissue | Adj P-value | Log2FC | Malignancy |
| 22870 | PPP6R1 | P19T-E | Human | Esophagus | ESCC | 7.48e-03 | 2.06e-01 | 0.1662 |
| 22870 | PPP6R1 | P20T-E | Human | Esophagus | ESCC | 8.62e-07 | 1.61e-01 | 0.1124 |
| 22870 | PPP6R1 | P21T-E | Human | Esophagus | ESCC | 1.30e-17 | 2.84e-01 | 0.1617 |
| 22870 | PPP6R1 | P22T-E | Human | Esophagus | ESCC | 2.93e-12 | 2.46e-01 | 0.1236 |
| 22870 | PPP6R1 | P23T-E | Human | Esophagus | ESCC | 7.24e-15 | 3.33e-01 | 0.108 |
| 22870 | PPP6R1 | P24T-E | Human | Esophagus | ESCC | 2.60e-05 | 1.39e-01 | 0.1287 |
| 22870 | PPP6R1 | P26T-E | Human | Esophagus | ESCC | 1.82e-10 | 2.70e-01 | 0.1276 |
| 22870 | PPP6R1 | P27T-E | Human | Esophagus | ESCC | 1.70e-11 | 2.17e-01 | 0.1055 |
| 22870 | PPP6R1 | P28T-E | Human | Esophagus | ESCC | 1.92e-15 | 3.37e-01 | 0.1149 |
| 22870 | PPP6R1 | P30T-E | Human | Esophagus | ESCC | 1.72e-15 | 4.28e-01 | 0.137 |
| 22870 | PPP6R1 | P31T-E | Human | Esophagus | ESCC | 2.96e-13 | 2.16e-01 | 0.1251 |
| 22870 | PPP6R1 | P32T-E | Human | Esophagus | ESCC | 1.29e-23 | 3.34e-01 | 0.1666 |
| 22870 | PPP6R1 | P36T-E | Human | Esophagus | ESCC | 2.66e-18 | 4.54e-01 | 0.1187 |
| 22870 | PPP6R1 | P37T-E | Human | Esophagus | ESCC | 4.68e-31 | 6.06e-01 | 0.1371 |
| 22870 | PPP6R1 | P39T-E | Human | Esophagus | ESCC | 3.99e-07 | 1.68e-01 | 0.0894 |
| 22870 | PPP6R1 | P40T-E | Human | Esophagus | ESCC | 1.20e-04 | 1.72e-01 | 0.109 |
| 22870 | PPP6R1 | P42T-E | Human | Esophagus | ESCC | 2.34e-14 | 2.79e-01 | 0.1175 |
| 22870 | PPP6R1 | P44T-E | Human | Esophagus | ESCC | 2.29e-03 | 1.19e-01 | 0.1096 |
| 22870 | PPP6R1 | P47T-E | Human | Esophagus | ESCC | 4.49e-15 | 2.50e-01 | 0.1067 |
| 22870 | PPP6R1 | P48T-E | Human | Esophagus | ESCC | 6.40e-07 | 1.41e-01 | 0.0959 |
| Page: 1 2 3 4 5 6 |
| Tissue | Expression Dynamics | Abbreviation |
| Esophagus |  | ESCC: Esophageal squamous cell carcinoma |
| HGIN: High-grade intraepithelial neoplasias | ||
| LGIN: Low-grade intraepithelial neoplasias | ||
| Liver | 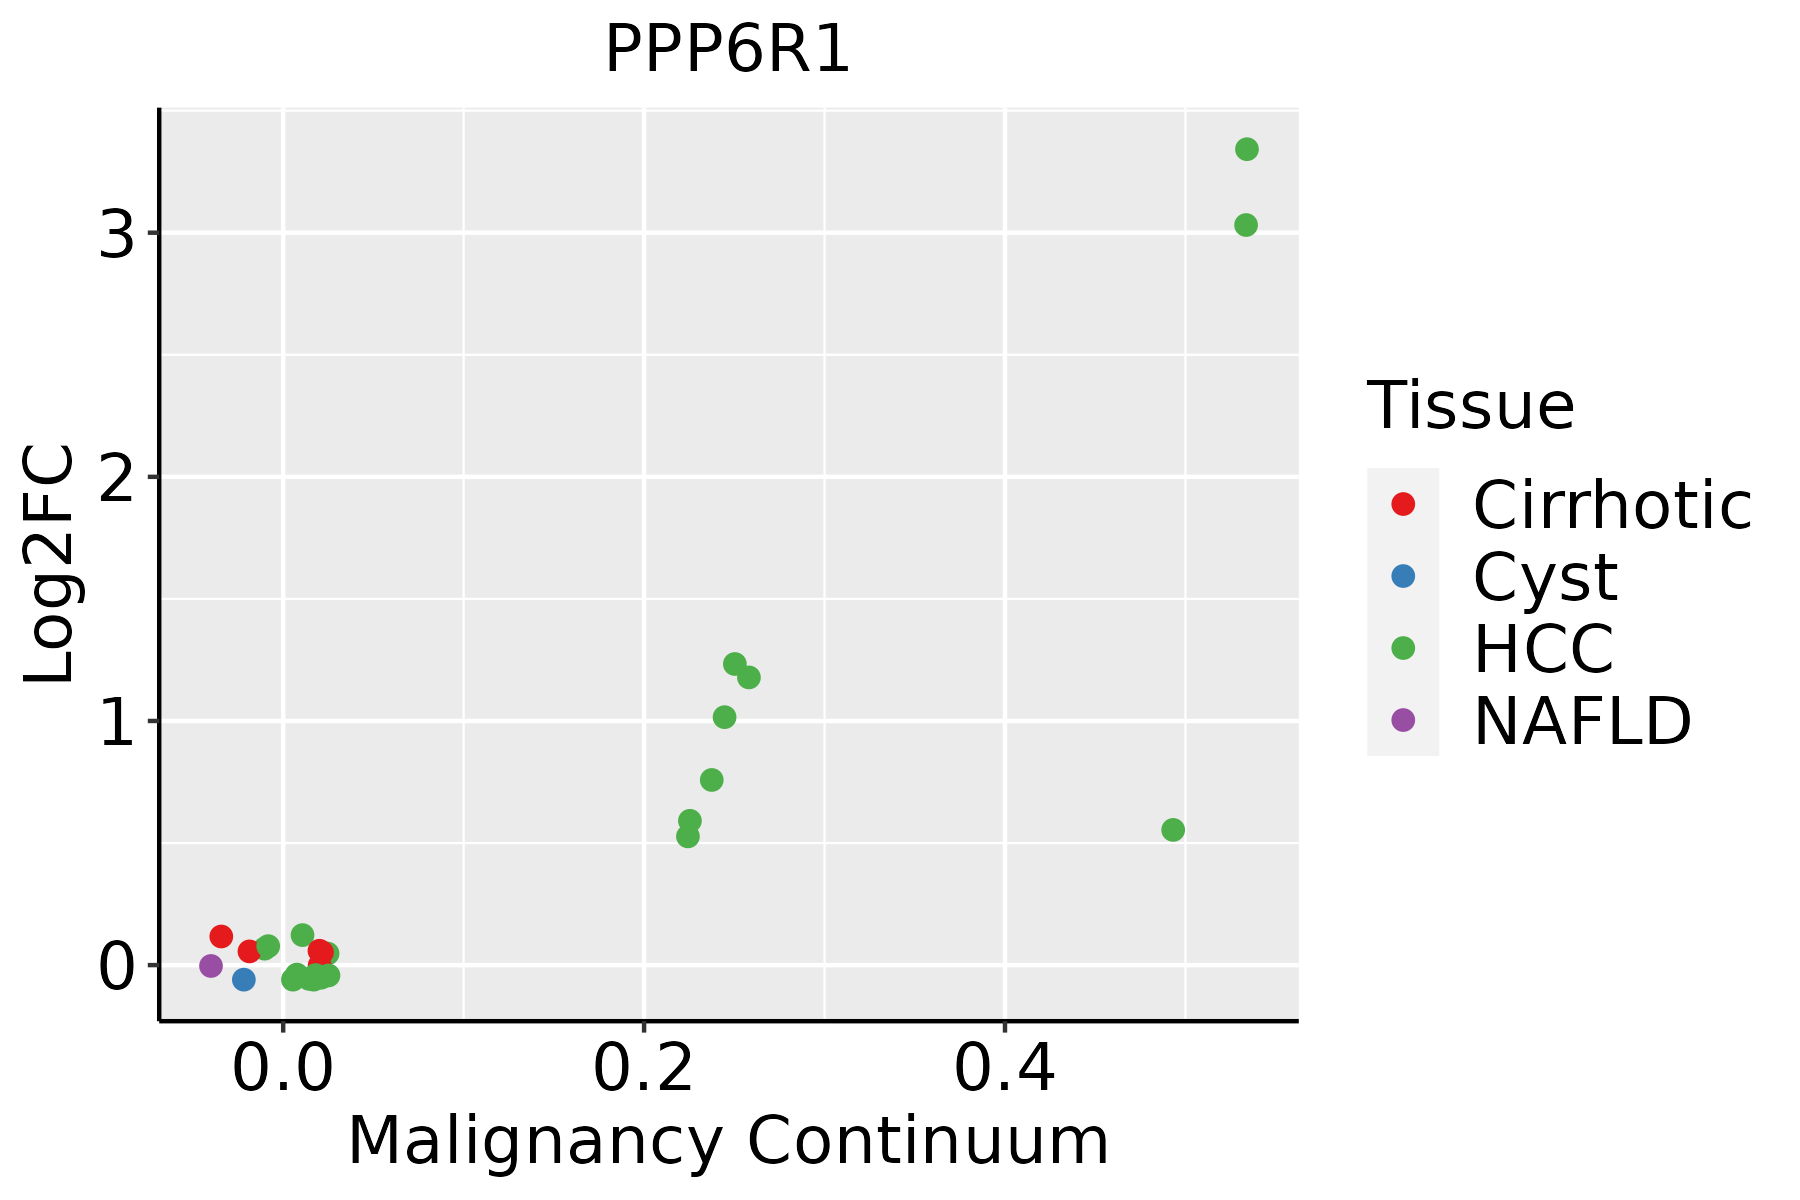 | HCC: Hepatocellular carcinoma |
| NAFLD: Non-alcoholic fatty liver disease | ||
| Oral Cavity | 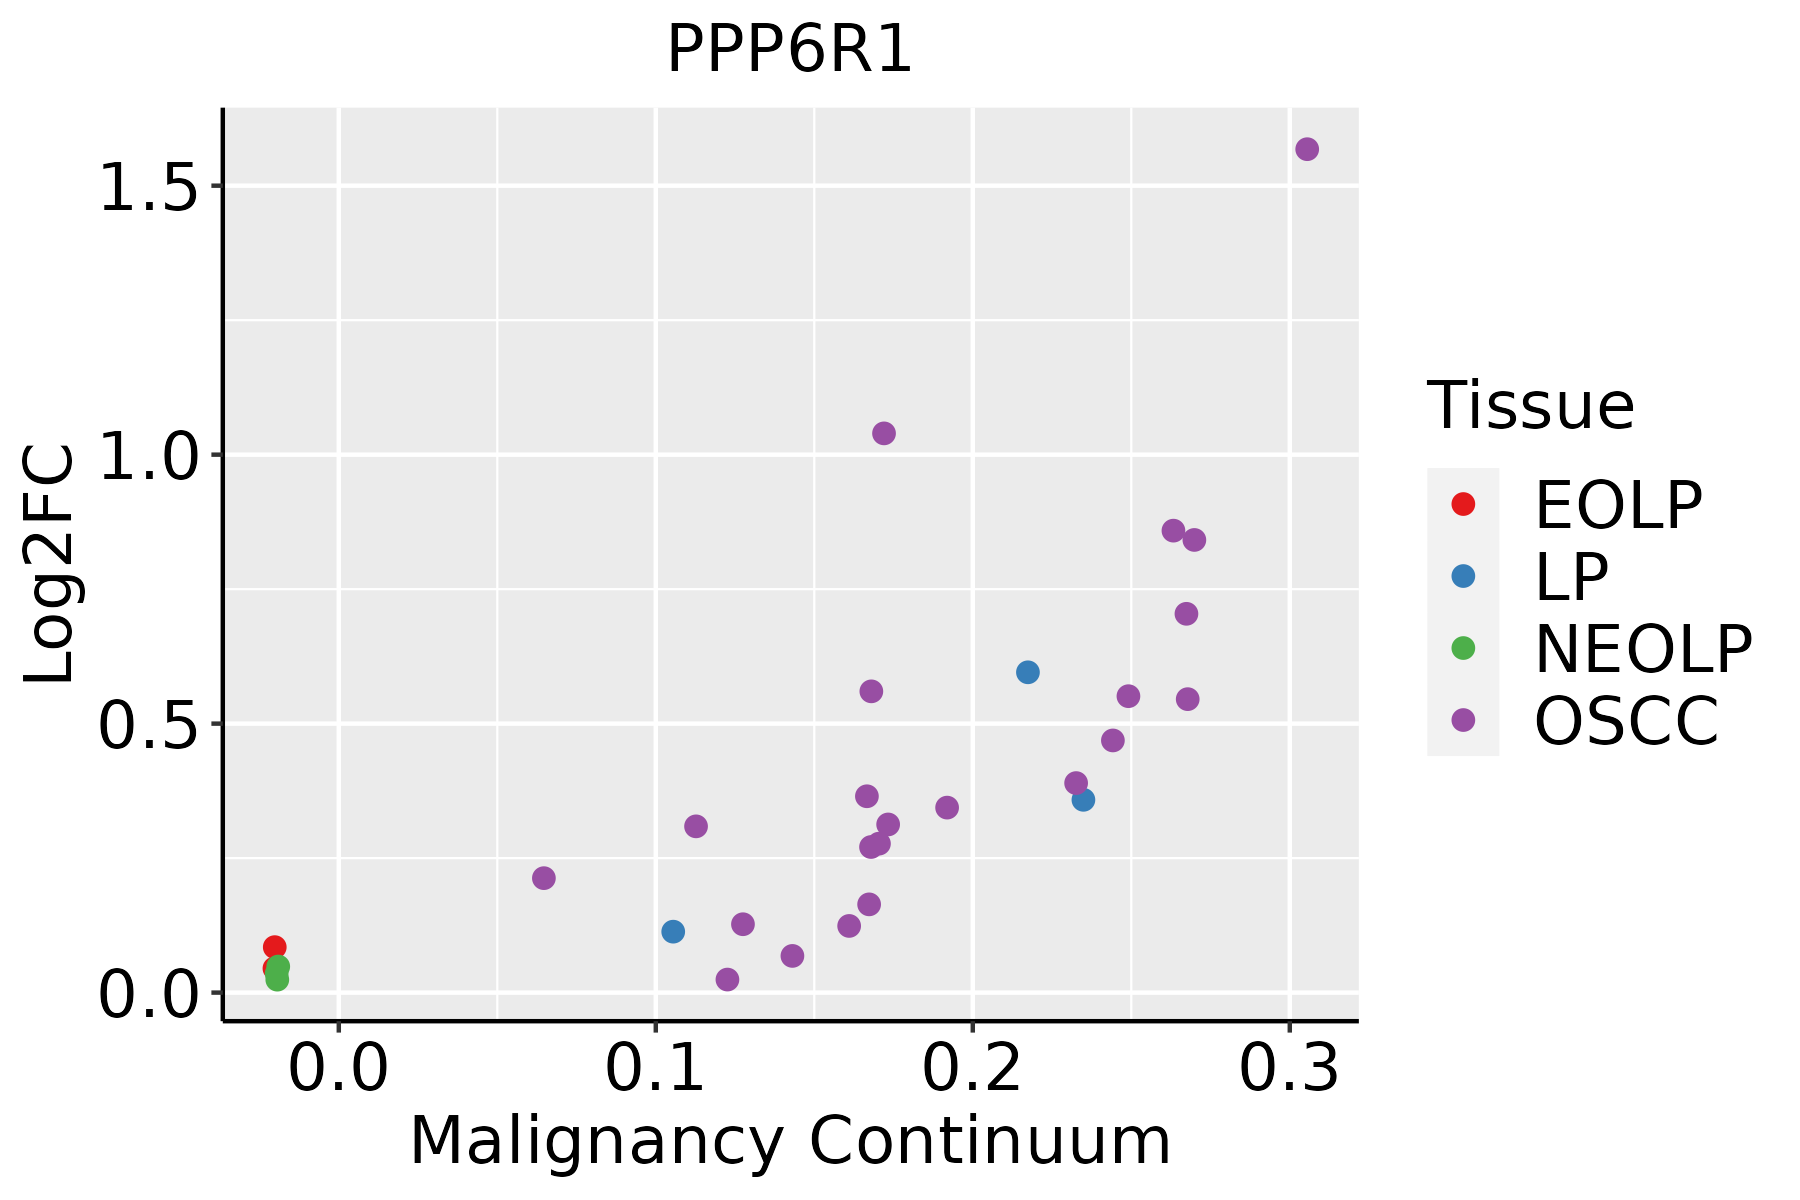 | EOLP: Erosive Oral lichen planus |
| LP: leukoplakia | ||
| NEOLP: Non-erosive oral lichen planus | ||
| OSCC: Oral squamous cell carcinoma | ||
| Thyroid |  | ATC: Anaplastic thyroid cancer |
| HT: Hashimoto's thyroiditis | ||
| PTC: Papillary thyroid cancer |
| ∗log2FC in expression of this searched gene in stem-like cells from each diseased tissue sample relative to stem-like cells in normal samples in each tissue plotted against the malignancy continuum. Samples are colored based on if they are from different disease stage. |
Top |
Malignant transformation related pathway analysis |
| Find out the enriched GO biological processes and KEGG pathways involved in transition from healthy to precancer to cancer |
| Tissue | Disease Stage | Enriched GO biological Processes |
| Colorectum | AD |  |
| Colorectum | SER |  |
| Colorectum | MSS |  |
| Colorectum | MSI-H |  |
| Colorectum | FAP |  |
| ∗Top 15 enriched GO BP terms are showed in the bar plot of each disease state in each tissue. Each row represents a significant GO biological process which is colored according to the -log10(p.adjust). |
| Page: 1 2 3 4 5 6 7 8 9 |
| GO ID | Tissue | Disease Stage | Description | Gene Ratio | Bg Ratio | pvalue | p.adjust | Count |
| GO:000647017 | Esophagus | HGIN | protein dephosphorylation | 61/2587 | 281/18723 | 1.86e-04 | 3.51e-03 | 61 |
| GO:003530425 | Esophagus | HGIN | regulation of protein dephosphorylation | 24/2587 | 90/18723 | 9.27e-04 | 1.17e-02 | 24 |
| GO:004366619 | Esophagus | HGIN | regulation of phosphoprotein phosphatase activity | 16/2587 | 58/18723 | 4.35e-03 | 3.84e-02 | 16 |
| GO:003530320 | Esophagus | HGIN | regulation of dephosphorylation | 29/2587 | 128/18723 | 4.41e-03 | 3.87e-02 | 29 |
| GO:001631110 | Esophagus | ESCC | dephosphorylation | 251/8552 | 417/18723 | 1.26e-09 | 2.99e-08 | 251 |
| GO:000647018 | Esophagus | ESCC | protein dephosphorylation | 177/8552 | 281/18723 | 3.13e-09 | 6.72e-08 | 177 |
| GO:0035304111 | Esophagus | ESCC | regulation of protein dephosphorylation | 66/8552 | 90/18723 | 8.82e-08 | 1.48e-06 | 66 |
| GO:0035303111 | Esophagus | ESCC | regulation of dephosphorylation | 88/8552 | 128/18723 | 1.04e-07 | 1.71e-06 | 88 |
| GO:0043666110 | Esophagus | ESCC | regulation of phosphoprotein phosphatase activity | 40/8552 | 58/18723 | 2.83e-04 | 1.71e-03 | 40 |
| GO:001092115 | Esophagus | ESCC | regulation of phosphatase activity | 52/8552 | 84/18723 | 1.98e-03 | 8.90e-03 | 52 |
| GO:001631121 | Liver | HCC | dephosphorylation | 230/7958 | 417/18723 | 1.00e-07 | 1.96e-06 | 230 |
| GO:000647021 | Liver | HCC | protein dephosphorylation | 162/7958 | 281/18723 | 1.91e-07 | 3.46e-06 | 162 |
| GO:003530412 | Liver | HCC | regulation of protein dephosphorylation | 62/7958 | 90/18723 | 3.66e-07 | 6.22e-06 | 62 |
| GO:003530312 | Liver | HCC | regulation of dephosphorylation | 80/7958 | 128/18723 | 3.85e-06 | 4.98e-05 | 80 |
| GO:004366612 | Liver | HCC | regulation of phosphoprotein phosphatase activity | 39/7958 | 58/18723 | 1.22e-04 | 1.02e-03 | 39 |
| GO:00109217 | Liver | HCC | regulation of phosphatase activity | 50/7958 | 84/18723 | 1.22e-03 | 6.74e-03 | 50 |
| GO:000647015 | Oral cavity | OSCC | protein dephosphorylation | 162/7305 | 281/18723 | 1.56e-10 | 4.56e-09 | 162 |
| GO:00163119 | Oral cavity | OSCC | dephosphorylation | 220/7305 | 417/18723 | 6.33e-09 | 1.34e-07 | 220 |
| GO:003530319 | Oral cavity | OSCC | regulation of dephosphorylation | 80/7305 | 128/18723 | 6.10e-08 | 1.10e-06 | 80 |
| GO:003530420 | Oral cavity | OSCC | regulation of protein dephosphorylation | 60/7305 | 90/18723 | 9.75e-08 | 1.67e-06 | 60 |
| Page: 1 2 |
| Pathway ID | Tissue | Disease Stage | Description | Gene Ratio | Bg Ratio | pvalue | p.adjust | qvalue | Count |
| Page: 1 |
Top |
Cell-cell communication analysis |
| Identification of potential cell-cell interactions between two cell types and their ligand-receptor pairs for different disease states |
| Ligand | Receptor | LRpair | Pathway | Tissue | Disease Stage |
| Page: 1 |
Top |
Single-cell gene regulatory network inference analysis |
| Find out the significant the regulons (TFs) and the target genes of each regulon across cell types for different disease states |
| TF | Cell Type | Tissue | Disease Stage | Target Gene | RSS | Regulon Activity |
| ∗The dot plots of a searched regulon are shown for all cell subpopulations in each disease state of each tissue based on the regulon specific score inferred using pySCENIC and by calculating the average expression. |
| Page: 1 |
Top |
Somatic mutation of malignant transformation related genes |
| Annotation of somatic variants for genes involved in malignant transformation |
| Hugo Symbol | Variant Class | Variant Classification | dbSNP RS | HGVSc | HGVSp | HGVSp Short | SWISSPROT | BIOTYPE | SIFT | PolyPhen | Tumor Sample Barcode | Tissue | Histology | Sex | Age | Stage | Therapy Types | Drugs | Outcome |
| PPP6R1 | SNV | Missense_Mutation | c.788N>A | p.Ser263Tyr | p.S263Y | Q9UPN7 | protein_coding | deleterious(0) | probably_damaging(0.992) | TCGA-A2-A0CW-01 | Breast | breast invasive carcinoma | Female | >=65 | I/II | Hormone Therapy | anastrozole | SD | |
| PPP6R1 | SNV | Missense_Mutation | c.1597N>T | p.Asp533Tyr | p.D533Y | Q9UPN7 | protein_coding | deleterious(0) | probably_damaging(0.988) | TCGA-AO-A03V-01 | Breast | breast invasive carcinoma | Female | <65 | I/II | Chemotherapy | fluorouracil | SD | |
| PPP6R1 | SNV | Missense_Mutation | c.1633N>A | p.Glu545Lys | p.E545K | Q9UPN7 | protein_coding | tolerated(0.3) | benign(0.024) | TCGA-BH-A1EV-01 | Breast | breast invasive carcinoma | Female | <65 | III/IV | Unknown | Unknown | PD | |
| PPP6R1 | SNV | Missense_Mutation | rs753320702 | c.658N>T | p.Arg220Cys | p.R220C | Q9UPN7 | protein_coding | deleterious(0.01) | probably_damaging(0.997) | TCGA-LL-A8F5-01 | Breast | breast invasive carcinoma | Female | <65 | I/II | Chemotherapy | cyclophosphamide | SD |
| PPP6R1 | deletion | Frame_Shift_Del | novel | c.64delN | p.Leu22Ter | p.L22* | Q9UPN7 | protein_coding | TCGA-EW-A2FV-01 | Breast | breast invasive carcinoma | Female | <65 | III/IV | Chemotherapy | docetaxel | SD | ||
| PPP6R1 | SNV | Missense_Mutation | novel | c.2350N>A | p.Glu784Lys | p.E784K | Q9UPN7 | protein_coding | tolerated_low_confidence(0.32) | benign(0.005) | TCGA-2W-A8YY-01 | Cervix | cervical & endocervical cancer | Female | <65 | I/II | Chemotherapy | cisplatin | CR |
| PPP6R1 | SNV | Missense_Mutation | novel | c.670N>A | p.Glu224Lys | p.E224K | Q9UPN7 | protein_coding | deleterious(0) | possibly_damaging(0.9) | TCGA-VS-A9UC-01 | Cervix | cervical & endocervical cancer | Female | <65 | I/II | Chemotherapy | cisplatin | SD |
| PPP6R1 | SNV | Missense_Mutation | c.170N>C | p.Met57Thr | p.M57T | Q9UPN7 | protein_coding | deleterious(0) | possibly_damaging(0.694) | TCGA-A6-6780-01 | Colorectum | colon adenocarcinoma | Male | >=65 | I/II | Unknown | Unknown | SD | |
| PPP6R1 | SNV | Missense_Mutation | c.1862N>G | p.Asp621Gly | p.D621G | Q9UPN7 | protein_coding | deleterious(0.02) | probably_damaging(0.965) | TCGA-AA-3693-01 | Colorectum | colon adenocarcinoma | Female | >=65 | III/IV | Unknown | Unknown | SD | |
| PPP6R1 | SNV | Missense_Mutation | novel | c.2034G>C | p.Glu678Asp | p.E678D | Q9UPN7 | protein_coding | tolerated(0.21) | benign(0.003) | TCGA-AA-3864-01 | Colorectum | colon adenocarcinoma | Male | >=65 | I/II | Unknown | Unknown | SD |
| Page: 1 2 3 4 5 6 7 |
Top |
Related drugs of malignant transformation related genes |
| Identification of chemicals and drugs interact with genes involved in malignant transfromation |
| (DGIdb 4.0) |
| Entrez ID | Symbol | Category | Interaction Types | Drug Claim Name | Drug Name | PMIDs |
| Page: 1 |

Copyright 2023-Present -The University of Texas Health Science Center at Houston |