
|
|||||
|
 | |
| |
| |
| |
| |
| |
|
Gene: PPP1R37 |
Gene summary for PPP1R37 |
| Gene information | Species | Human | Gene symbol | PPP1R37 | Gene ID | 284352 |
| Gene name | protein phosphatase 1 regulatory subunit 37 | |
| Gene Alias | LRRC68 | |
| Cytomap | 19q13.32 | |
| Gene Type | protein-coding | GO ID | GO:0008150 | UniProtAcc | O75864 |
Top |
Malignant transformation analysis |
| Identification of the aberrant gene expression in precancerous and cancerous lesions by comparing the gene expression of stem-like cells in diseased tissues with normal stem cells |
| Entrez ID | Symbol | Replicates | Species | Organ | Tissue | Adj P-value | Log2FC | Malignancy |
| 284352 | PPP1R37 | P27T-E | Human | Esophagus | ESCC | 6.49e-24 | 4.00e-01 | 0.1055 |
| 284352 | PPP1R37 | P28T-E | Human | Esophagus | ESCC | 1.58e-26 | 4.89e-01 | 0.1149 |
| 284352 | PPP1R37 | P30T-E | Human | Esophagus | ESCC | 1.05e-11 | 3.86e-01 | 0.137 |
| 284352 | PPP1R37 | P31T-E | Human | Esophagus | ESCC | 2.87e-19 | 2.98e-01 | 0.1251 |
| 284352 | PPP1R37 | P32T-E | Human | Esophagus | ESCC | 2.19e-20 | 3.28e-01 | 0.1666 |
| 284352 | PPP1R37 | P36T-E | Human | Esophagus | ESCC | 8.96e-12 | 3.83e-01 | 0.1187 |
| 284352 | PPP1R37 | P37T-E | Human | Esophagus | ESCC | 9.65e-15 | 2.89e-01 | 0.1371 |
| 284352 | PPP1R37 | P39T-E | Human | Esophagus | ESCC | 7.49e-09 | 1.77e-01 | 0.0894 |
| 284352 | PPP1R37 | P40T-E | Human | Esophagus | ESCC | 6.67e-10 | 2.68e-01 | 0.109 |
| 284352 | PPP1R37 | P42T-E | Human | Esophagus | ESCC | 5.45e-11 | 2.65e-01 | 0.1175 |
| 284352 | PPP1R37 | P44T-E | Human | Esophagus | ESCC | 1.96e-04 | 1.16e-01 | 0.1096 |
| 284352 | PPP1R37 | P47T-E | Human | Esophagus | ESCC | 1.28e-13 | 2.33e-01 | 0.1067 |
| 284352 | PPP1R37 | P48T-E | Human | Esophagus | ESCC | 7.31e-15 | 2.41e-01 | 0.0959 |
| 284352 | PPP1R37 | P49T-E | Human | Esophagus | ESCC | 6.00e-08 | 3.94e-01 | 0.1768 |
| 284352 | PPP1R37 | P52T-E | Human | Esophagus | ESCC | 8.37e-18 | 3.95e-01 | 0.1555 |
| 284352 | PPP1R37 | P54T-E | Human | Esophagus | ESCC | 4.03e-31 | 6.44e-01 | 0.0975 |
| 284352 | PPP1R37 | P56T-E | Human | Esophagus | ESCC | 4.78e-04 | 6.31e-01 | 0.1613 |
| 284352 | PPP1R37 | P57T-E | Human | Esophagus | ESCC | 4.15e-13 | 3.61e-01 | 0.0926 |
| 284352 | PPP1R37 | P61T-E | Human | Esophagus | ESCC | 1.19e-21 | 4.62e-01 | 0.099 |
| 284352 | PPP1R37 | P62T-E | Human | Esophagus | ESCC | 1.94e-32 | 4.97e-01 | 0.1302 |
| Page: 1 2 3 4 5 |
| Tissue | Expression Dynamics | Abbreviation |
| Esophagus | 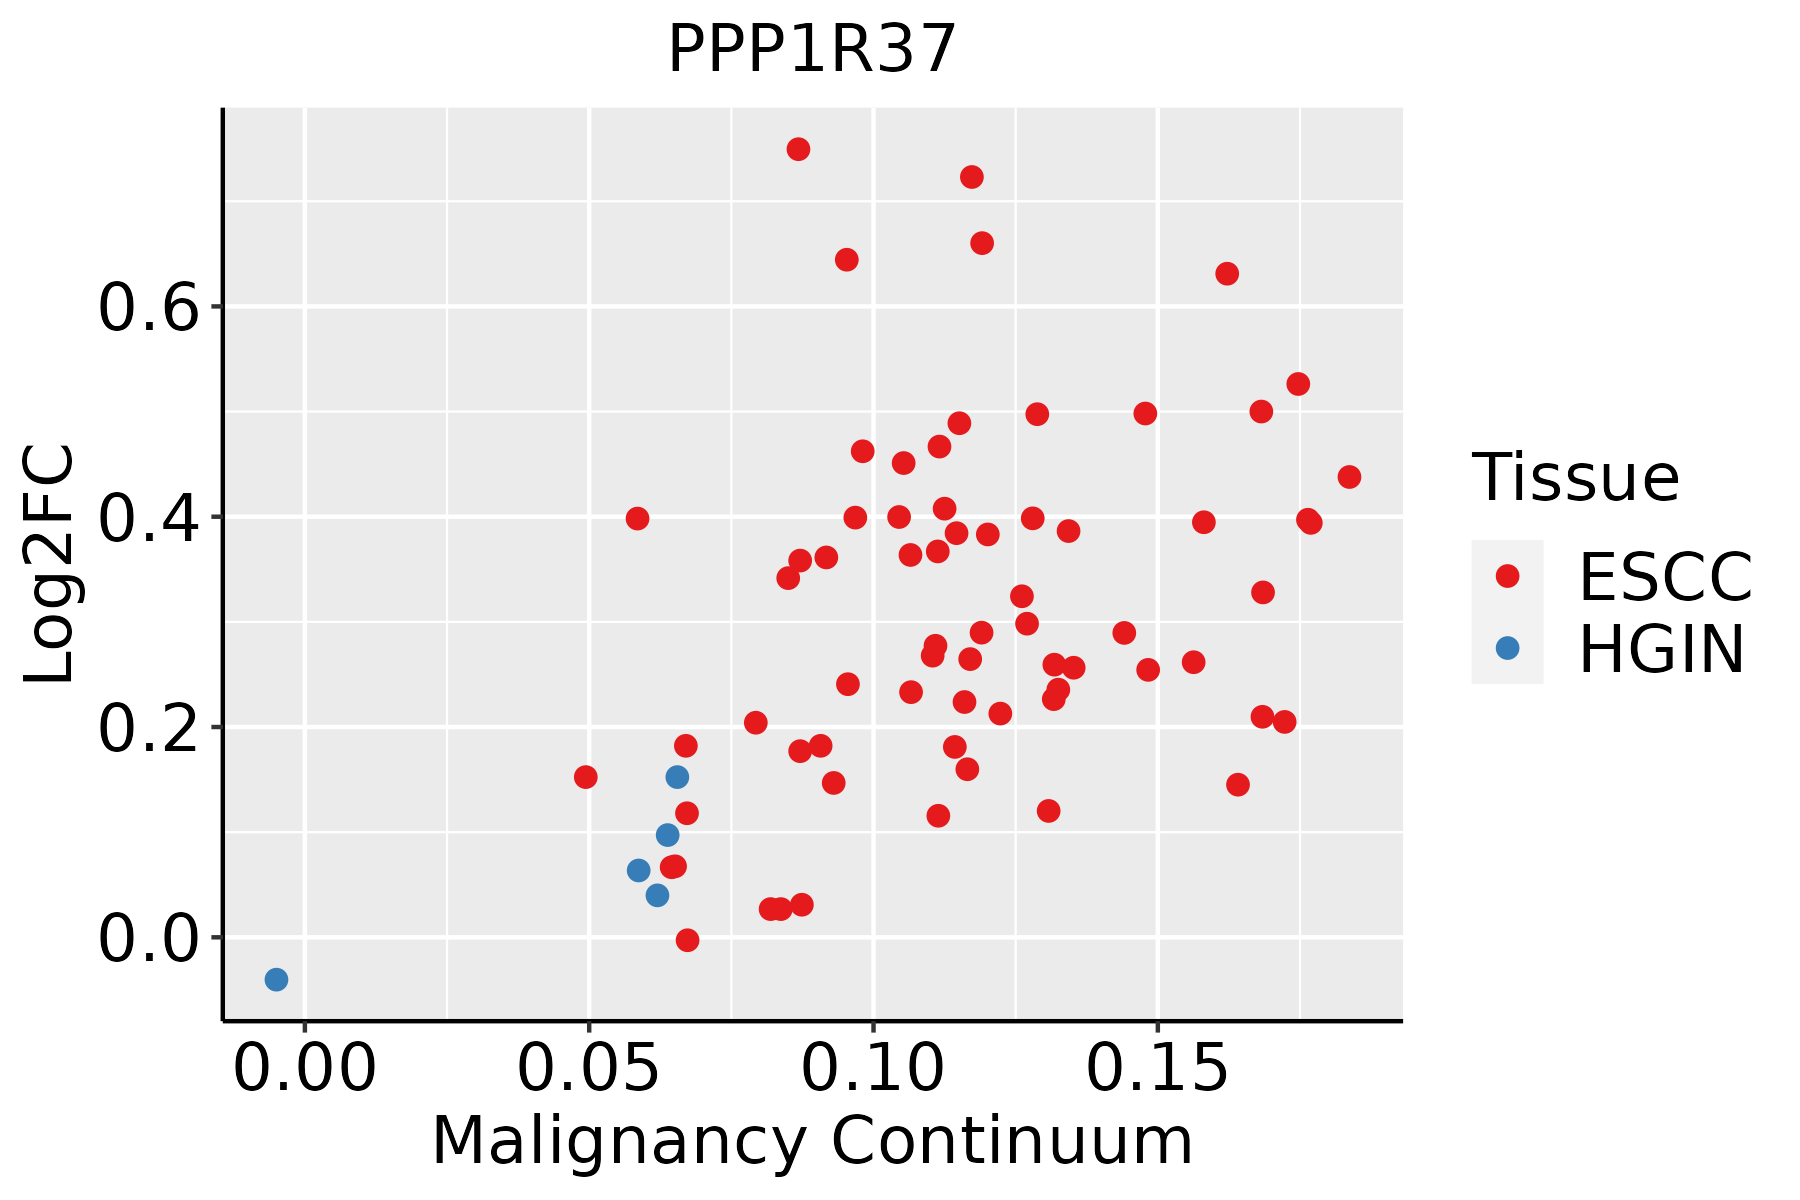 | ESCC: Esophageal squamous cell carcinoma |
| HGIN: High-grade intraepithelial neoplasias | ||
| LGIN: Low-grade intraepithelial neoplasias | ||
| Liver | 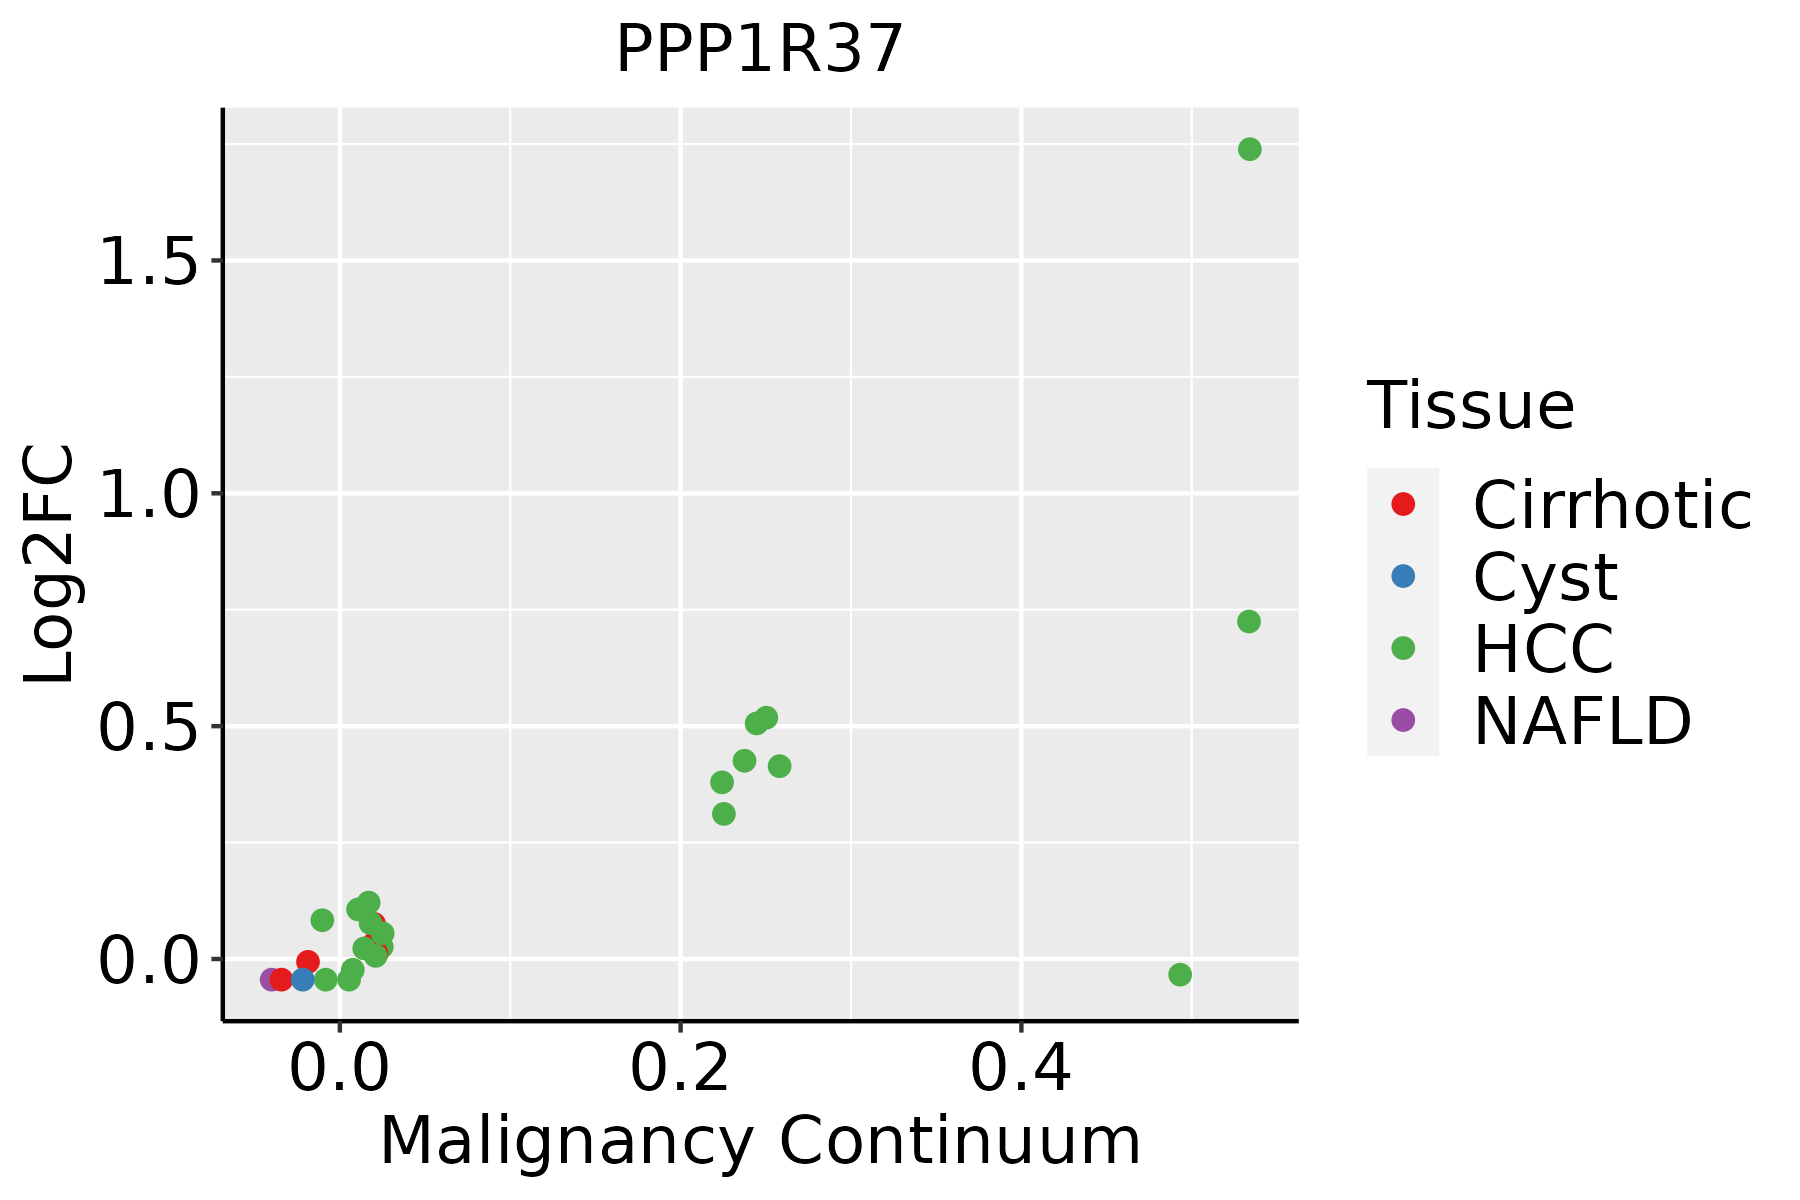 | HCC: Hepatocellular carcinoma |
| NAFLD: Non-alcoholic fatty liver disease | ||
| Oral Cavity |  | EOLP: Erosive Oral lichen planus |
| LP: leukoplakia | ||
| NEOLP: Non-erosive oral lichen planus | ||
| OSCC: Oral squamous cell carcinoma |
| ∗log2FC in expression of this searched gene in stem-like cells from each diseased tissue sample relative to stem-like cells in normal samples in each tissue plotted against the malignancy continuum. Samples are colored based on if they are from different disease stage. |
Top |
Malignant transformation related pathway analysis |
| Find out the enriched GO biological processes and KEGG pathways involved in transition from healthy to precancer to cancer |
| Tissue | Disease Stage | Enriched GO biological Processes |
| Colorectum | AD |  |
| Colorectum | SER |  |
| Colorectum | MSS |  |
| Colorectum | MSI-H |  |
| Colorectum | FAP |  |
| ∗Top 15 enriched GO BP terms are showed in the bar plot of each disease state in each tissue. Each row represents a significant GO biological process which is colored according to the -log10(p.adjust). |
| Page: 1 2 3 4 5 6 7 8 9 |
| GO ID | Tissue | Disease Stage | Description | Gene Ratio | Bg Ratio | pvalue | p.adjust | Count |
| Page: 1 |
| Pathway ID | Tissue | Disease Stage | Description | Gene Ratio | Bg Ratio | pvalue | p.adjust | qvalue | Count |
| Page: 1 |
Top |
Cell-cell communication analysis |
| Identification of potential cell-cell interactions between two cell types and their ligand-receptor pairs for different disease states |
| Ligand | Receptor | LRpair | Pathway | Tissue | Disease Stage |
| Page: 1 |
Top |
Single-cell gene regulatory network inference analysis |
| Find out the significant the regulons (TFs) and the target genes of each regulon across cell types for different disease states |
| TF | Cell Type | Tissue | Disease Stage | Target Gene | RSS | Regulon Activity |
| ∗The dot plots of a searched regulon are shown for all cell subpopulations in each disease state of each tissue based on the regulon specific score inferred using pySCENIC and by calculating the average expression. |
| Page: 1 |
Top |
Somatic mutation of malignant transformation related genes |
| Annotation of somatic variants for genes involved in malignant transformation |
| Hugo Symbol | Variant Class | Variant Classification | dbSNP RS | HGVSc | HGVSp | HGVSp Short | SWISSPROT | BIOTYPE | SIFT | PolyPhen | Tumor Sample Barcode | Tissue | Histology | Sex | Age | Stage | Therapy Types | Drugs | Outcome |
| PPP1R37 | SNV | Missense_Mutation | novel | c.1718N>A | p.Arg573Gln | p.R573Q | O75864 | protein_coding | deleterious(0) | probably_damaging(0.965) | TCGA-E9-A5UO-01 | Breast | breast invasive carcinoma | Female | <65 | I/II | Unknown | Unknown | SD |
| PPP1R37 | SNV | Missense_Mutation | c.1159N>A | p.Glu387Lys | p.E387K | O75864 | protein_coding | deleterious(0.03) | benign(0.047) | TCGA-IR-A3LK-01 | Cervix | cervical & endocervical cancer | Female | >=65 | I/II | Chemotherapy | cisplatin | PD | |
| PPP1R37 | SNV | Missense_Mutation | novel | c.1400N>T | p.Pro467Leu | p.P467L | O75864 | protein_coding | deleterious(0.04) | benign(0.026) | TCGA-VS-A9U6-01 | Cervix | cervical & endocervical cancer | Female | <65 | I/II | Chemotherapy | cisplatin | PD |
| PPP1R37 | SNV | Missense_Mutation | novel | c.1000N>G | p.Ser334Gly | p.S334G | O75864 | protein_coding | tolerated(0.07) | benign(0.011) | TCGA-A5-A1OF-01 | Endometrium | uterine corpus endometrioid carcinoma | Female | <65 | I/II | Unknown | Unknown | SD |
| PPP1R37 | SNV | Missense_Mutation | novel | c.1643G>A | p.Ser548Asn | p.S548N | O75864 | protein_coding | tolerated_low_confidence(0.2) | benign(0.102) | TCGA-DF-A2KN-01 | Endometrium | uterine corpus endometrioid carcinoma | Female | Unknown | I/II | Unknown | Unknown | SD |
| PPP1R37 | SNV | Missense_Mutation | novel | c.328N>A | p.Asp110Asn | p.D110N | O75864 | protein_coding | tolerated(0.05) | benign(0.011) | TCGA-DF-A2KU-01 | Endometrium | uterine corpus endometrioid carcinoma | Female | Unknown | I/II | Unknown | Unknown | SD |
| PPP1R37 | SNV | Missense_Mutation | novel | c.1295N>T | p.Ala432Val | p.A432V | O75864 | protein_coding | tolerated(0.13) | benign(0.043) | TCGA-DF-A2KU-01 | Endometrium | uterine corpus endometrioid carcinoma | Female | Unknown | I/II | Unknown | Unknown | SD |
| PPP1R37 | SNV | Missense_Mutation | novel | c.455C>T | p.Ser152Leu | p.S152L | O75864 | protein_coding | tolerated(0.07) | benign(0.173) | TCGA-EO-A22U-01 | Endometrium | uterine corpus endometrioid carcinoma | Female | >=65 | I/II | Unknown | Unknown | SD |
| PPP1R37 | SNV | Missense_Mutation | rs757346574 | c.569C>T | p.Thr190Met | p.T190M | O75864 | protein_coding | deleterious(0) | benign(0.301) | TCGA-EO-A22U-01 | Endometrium | uterine corpus endometrioid carcinoma | Female | >=65 | I/II | Unknown | Unknown | SD |
| PPP1R37 | SNV | Missense_Mutation | novel | c.1435G>A | p.Ala479Thr | p.A479T | O75864 | protein_coding | tolerated(0.61) | benign(0.043) | TCGA-EO-A22U-01 | Endometrium | uterine corpus endometrioid carcinoma | Female | >=65 | I/II | Unknown | Unknown | SD |
| Page: 1 2 |
Top |
Related drugs of malignant transformation related genes |
| Identification of chemicals and drugs interact with genes involved in malignant transfromation |
| (DGIdb 4.0) |
| Entrez ID | Symbol | Category | Interaction Types | Drug Claim Name | Drug Name | PMIDs |
| Page: 1 |

Copyright 2023-Present -The University of Texas Health Science Center at Houston |