
|
|||||
|
 | |
| |
| |
| |
| |
| |
|
Gene: PPP1R35 |
Gene summary for PPP1R35 |
| Gene information | Species | Human | Gene symbol | PPP1R35 | Gene ID | 221908 |
| Gene name | protein phosphatase 1 regulatory subunit 35 | |
| Gene Alias | C7orf47 | |
| Cytomap | 7q22.1 | |
| Gene Type | protein-coding | GO ID | GO:0006793 | UniProtAcc | Q8TAP8 |
Top |
Malignant transformation analysis |
| Identification of the aberrant gene expression in precancerous and cancerous lesions by comparing the gene expression of stem-like cells in diseased tissues with normal stem cells |
| Entrez ID | Symbol | Replicates | Species | Organ | Tissue | Adj P-value | Log2FC | Malignancy |
| 221908 | PPP1R35 | P22T-E | Human | Esophagus | ESCC | 1.54e-29 | 4.87e-01 | 0.1236 |
| 221908 | PPP1R35 | P23T-E | Human | Esophagus | ESCC | 3.97e-53 | 1.47e+00 | 0.108 |
| 221908 | PPP1R35 | P24T-E | Human | Esophagus | ESCC | 8.50e-14 | 3.09e-01 | 0.1287 |
| 221908 | PPP1R35 | P26T-E | Human | Esophagus | ESCC | 7.24e-24 | 4.05e-01 | 0.1276 |
| 221908 | PPP1R35 | P27T-E | Human | Esophagus | ESCC | 1.61e-08 | 2.77e-01 | 0.1055 |
| 221908 | PPP1R35 | P28T-E | Human | Esophagus | ESCC | 6.18e-58 | 1.04e+00 | 0.1149 |
| 221908 | PPP1R35 | P30T-E | Human | Esophagus | ESCC | 2.36e-23 | 8.87e-01 | 0.137 |
| 221908 | PPP1R35 | P31T-E | Human | Esophagus | ESCC | 3.46e-17 | 2.42e-01 | 0.1251 |
| 221908 | PPP1R35 | P32T-E | Human | Esophagus | ESCC | 1.50e-18 | 4.18e-01 | 0.1666 |
| 221908 | PPP1R35 | P36T-E | Human | Esophagus | ESCC | 1.15e-18 | 8.40e-01 | 0.1187 |
| 221908 | PPP1R35 | P37T-E | Human | Esophagus | ESCC | 1.15e-10 | 2.40e-01 | 0.1371 |
| 221908 | PPP1R35 | P38T-E | Human | Esophagus | ESCC | 2.07e-07 | 3.23e-01 | 0.127 |
| 221908 | PPP1R35 | P39T-E | Human | Esophagus | ESCC | 2.52e-17 | 2.93e-01 | 0.0894 |
| 221908 | PPP1R35 | P40T-E | Human | Esophagus | ESCC | 3.19e-11 | 3.04e-01 | 0.109 |
| 221908 | PPP1R35 | P42T-E | Human | Esophagus | ESCC | 1.47e-29 | 6.59e-01 | 0.1175 |
| 221908 | PPP1R35 | P44T-E | Human | Esophagus | ESCC | 1.62e-07 | 2.31e-01 | 0.1096 |
| 221908 | PPP1R35 | P47T-E | Human | Esophagus | ESCC | 9.02e-34 | 6.70e-01 | 0.1067 |
| 221908 | PPP1R35 | P48T-E | Human | Esophagus | ESCC | 2.62e-17 | 3.18e-01 | 0.0959 |
| 221908 | PPP1R35 | P49T-E | Human | Esophagus | ESCC | 3.68e-14 | 1.03e+00 | 0.1768 |
| 221908 | PPP1R35 | P52T-E | Human | Esophagus | ESCC | 2.52e-22 | 5.78e-01 | 0.1555 |
| Page: 1 2 3 4 5 6 |
| Tissue | Expression Dynamics | Abbreviation |
| Esophagus | 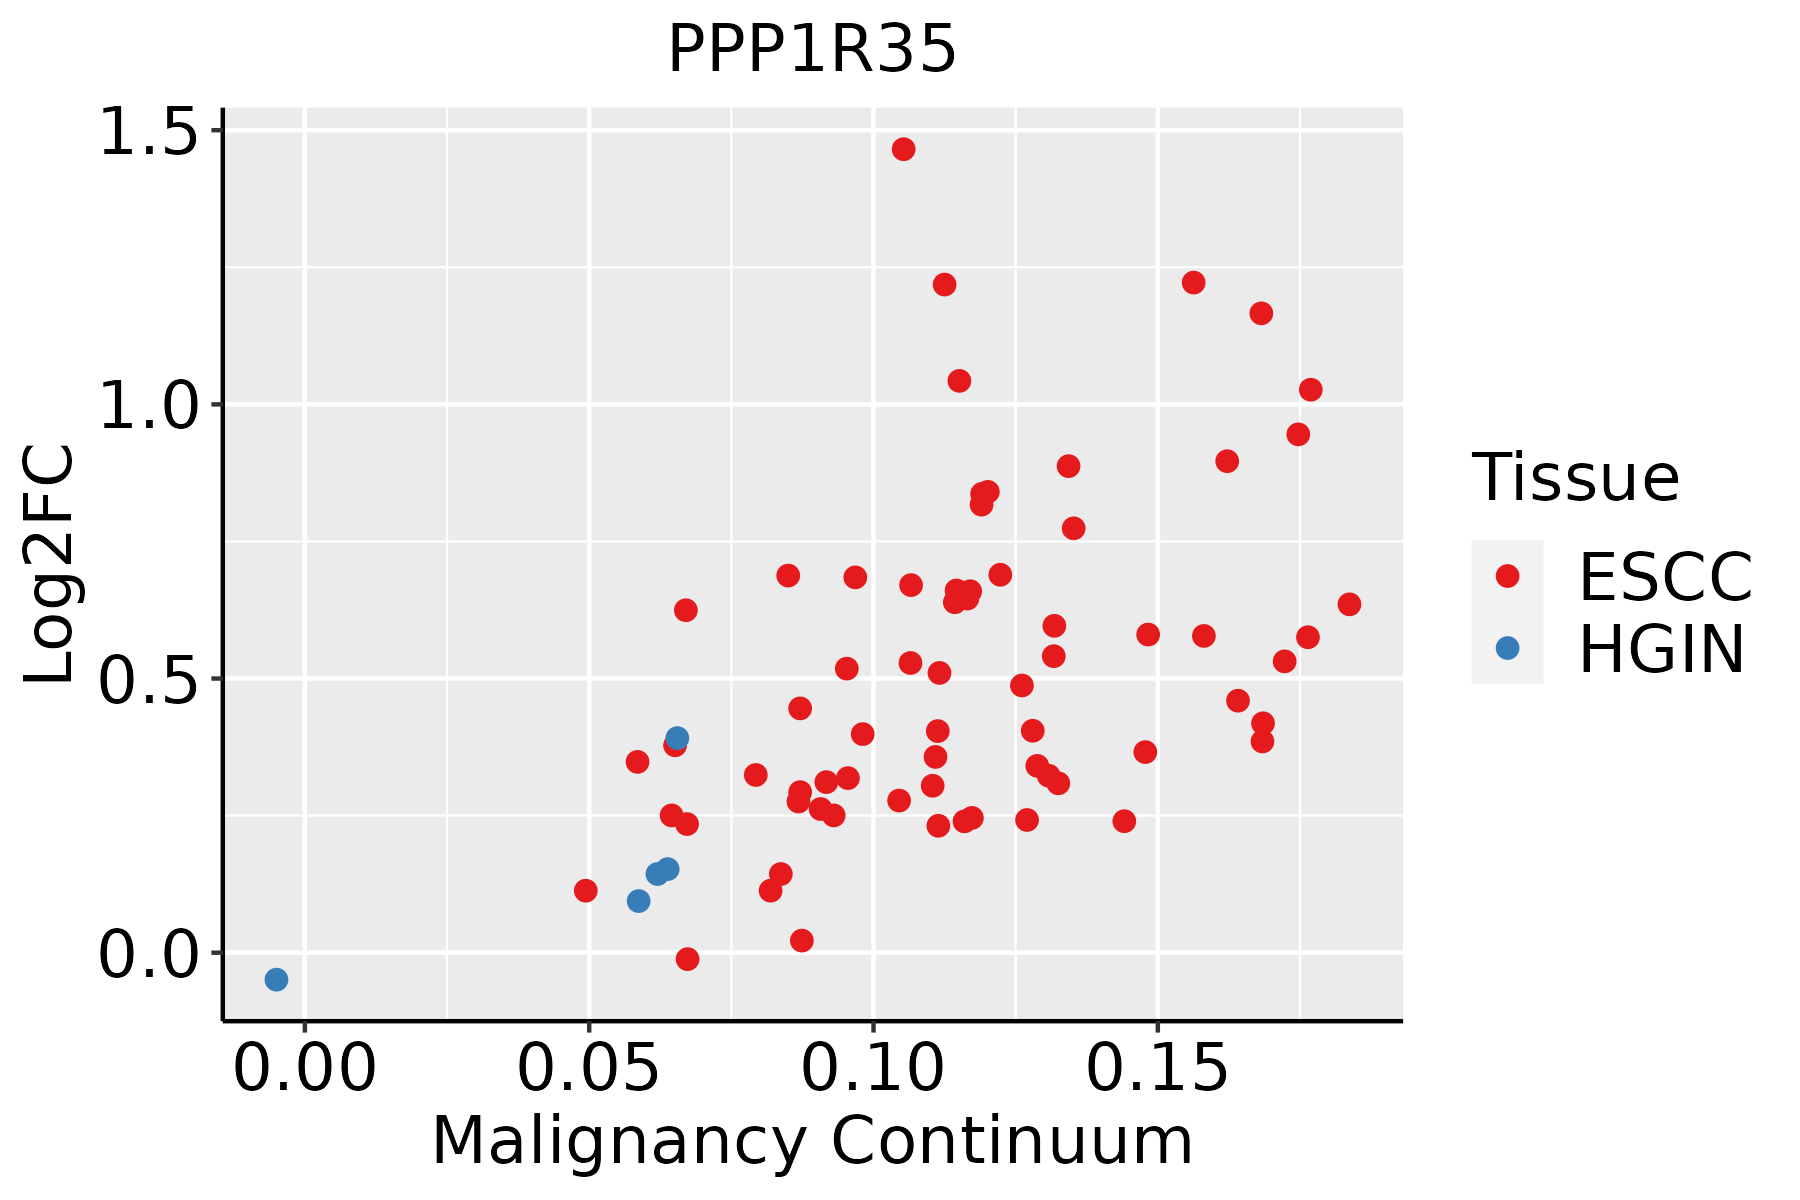 | ESCC: Esophageal squamous cell carcinoma |
| HGIN: High-grade intraepithelial neoplasias | ||
| LGIN: Low-grade intraepithelial neoplasias | ||
| Liver | 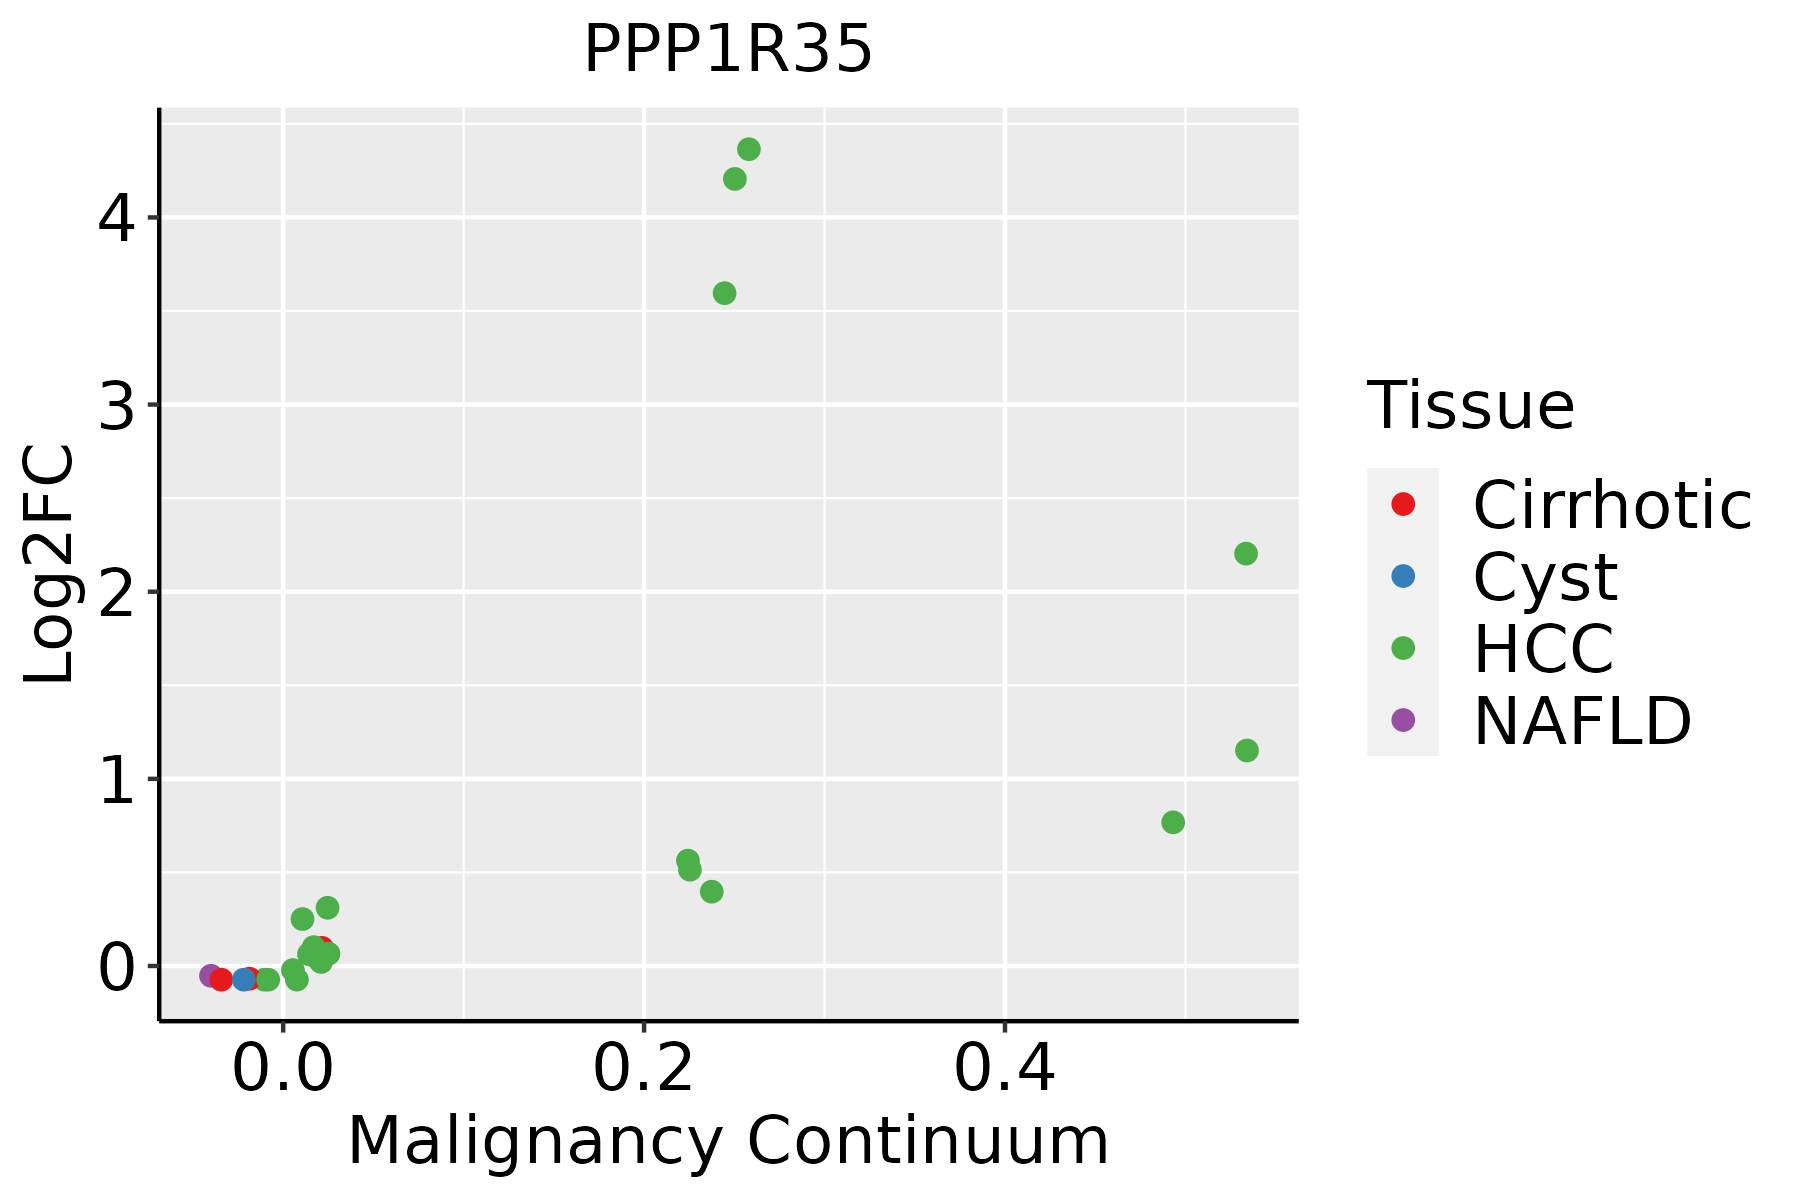 | HCC: Hepatocellular carcinoma |
| NAFLD: Non-alcoholic fatty liver disease | ||
| Oral Cavity |  | EOLP: Erosive Oral lichen planus |
| LP: leukoplakia | ||
| NEOLP: Non-erosive oral lichen planus | ||
| OSCC: Oral squamous cell carcinoma | ||
| Skin |  | AK: Actinic keratosis |
| cSCC: Cutaneous squamous cell carcinoma | ||
| SCCIS:squamous cell carcinoma in situ | ||
| Thyroid |  | ATC: Anaplastic thyroid cancer |
| HT: Hashimoto's thyroiditis | ||
| PTC: Papillary thyroid cancer |
| ∗log2FC in expression of this searched gene in stem-like cells from each diseased tissue sample relative to stem-like cells in normal samples in each tissue plotted against the malignancy continuum. Samples are colored based on if they are from different disease stage. |
Top |
Malignant transformation related pathway analysis |
| Find out the enriched GO biological processes and KEGG pathways involved in transition from healthy to precancer to cancer |
| Tissue | Disease Stage | Enriched GO biological Processes |
| Colorectum | AD |  |
| Colorectum | SER |  |
| Colorectum | MSS |  |
| Colorectum | MSI-H |  |
| Colorectum | FAP |  |
| ∗Top 15 enriched GO BP terms are showed in the bar plot of each disease state in each tissue. Each row represents a significant GO biological process which is colored according to the -log10(p.adjust). |
| Page: 1 2 3 4 5 6 7 8 9 |
| GO ID | Tissue | Disease Stage | Description | Gene Ratio | Bg Ratio | pvalue | p.adjust | Count |
| GO:0010563111 | Esophagus | ESCC | negative regulation of phosphorus metabolic process | 274/8552 | 442/18723 | 2.32e-12 | 9.41e-11 | 274 |
| GO:0045936111 | Esophagus | ESCC | negative regulation of phosphate metabolic process | 273/8552 | 441/18723 | 3.18e-12 | 1.25e-10 | 273 |
| GO:001631110 | Esophagus | ESCC | dephosphorylation | 251/8552 | 417/18723 | 1.26e-09 | 2.99e-08 | 251 |
| GO:0035303111 | Esophagus | ESCC | regulation of dephosphorylation | 88/8552 | 128/18723 | 1.04e-07 | 1.71e-06 | 88 |
| GO:0051346110 | Esophagus | ESCC | negative regulation of hydrolase activity | 208/8552 | 379/18723 | 1.76e-04 | 1.14e-03 | 208 |
| GO:00353056 | Esophagus | ESCC | negative regulation of dephosphorylation | 31/8552 | 45/18723 | 1.40e-03 | 6.62e-03 | 31 |
| GO:001092115 | Esophagus | ESCC | regulation of phosphatase activity | 52/8552 | 84/18723 | 1.98e-03 | 8.90e-03 | 52 |
| GO:001056322 | Liver | HCC | negative regulation of phosphorus metabolic process | 259/7958 | 442/18723 | 4.29e-12 | 1.92e-10 | 259 |
| GO:004593622 | Liver | HCC | negative regulation of phosphate metabolic process | 258/7958 | 441/18723 | 6.00e-12 | 2.60e-10 | 258 |
| GO:001631121 | Liver | HCC | dephosphorylation | 230/7958 | 417/18723 | 1.00e-07 | 1.96e-06 | 230 |
| GO:003530312 | Liver | HCC | regulation of dephosphorylation | 80/7958 | 128/18723 | 3.85e-06 | 4.98e-05 | 80 |
| GO:005134622 | Liver | HCC | negative regulation of hydrolase activity | 195/7958 | 379/18723 | 2.44e-04 | 1.82e-03 | 195 |
| GO:00109217 | Liver | HCC | regulation of phosphatase activity | 50/7958 | 84/18723 | 1.22e-03 | 6.74e-03 | 50 |
| GO:0035305 | Liver | HCC | negative regulation of dephosphorylation | 28/7958 | 45/18723 | 5.99e-03 | 2.45e-02 | 28 |
| GO:0010923 | Liver | HCC | negative regulation of phosphatase activity | 23/7958 | 36/18723 | 7.85e-03 | 3.11e-02 | 23 |
| GO:001056320 | Oral cavity | OSCC | negative regulation of phosphorus metabolic process | 246/7305 | 442/18723 | 6.12e-13 | 2.89e-11 | 246 |
| GO:004593620 | Oral cavity | OSCC | negative regulation of phosphate metabolic process | 245/7305 | 441/18723 | 8.85e-13 | 4.09e-11 | 245 |
| GO:00163119 | Oral cavity | OSCC | dephosphorylation | 220/7305 | 417/18723 | 6.33e-09 | 1.34e-07 | 220 |
| GO:003530319 | Oral cavity | OSCC | regulation of dephosphorylation | 80/7305 | 128/18723 | 6.10e-08 | 1.10e-06 | 80 |
| GO:005134618 | Oral cavity | OSCC | negative regulation of hydrolase activity | 182/7305 | 379/18723 | 1.98e-04 | 1.32e-03 | 182 |
| Page: 1 2 3 |
| Pathway ID | Tissue | Disease Stage | Description | Gene Ratio | Bg Ratio | pvalue | p.adjust | qvalue | Count |
| Page: 1 |
Top |
Cell-cell communication analysis |
| Identification of potential cell-cell interactions between two cell types and their ligand-receptor pairs for different disease states |
| Ligand | Receptor | LRpair | Pathway | Tissue | Disease Stage |
| Page: 1 |
Top |
Single-cell gene regulatory network inference analysis |
| Find out the significant the regulons (TFs) and the target genes of each regulon across cell types for different disease states |
| TF | Cell Type | Tissue | Disease Stage | Target Gene | RSS | Regulon Activity |
| ∗The dot plots of a searched regulon are shown for all cell subpopulations in each disease state of each tissue based on the regulon specific score inferred using pySCENIC and by calculating the average expression. |
| Page: 1 |
Top |
Somatic mutation of malignant transformation related genes |
| Annotation of somatic variants for genes involved in malignant transformation |
| Hugo Symbol | Variant Class | Variant Classification | dbSNP RS | HGVSc | HGVSp | HGVSp Short | SWISSPROT | BIOTYPE | SIFT | PolyPhen | Tumor Sample Barcode | Tissue | Histology | Sex | Age | Stage | Therapy Types | Drugs | Outcome |
| PPP1R35 | SNV | Missense_Mutation | c.610N>C | p.Asp204His | p.D204H | Q8TAP8 | protein_coding | deleterious(0) | probably_damaging(0.982) | TCGA-AC-A23H-01 | Breast | breast invasive carcinoma | Female | >=65 | I/II | Unknown | Unknown | PD | |
| PPP1R35 | SNV | Missense_Mutation | novel | c.726C>A | p.Phe242Leu | p.F242L | Q8TAP8 | protein_coding | deleterious(0) | probably_damaging(0.98) | TCGA-C8-A8HQ-01 | Breast | breast invasive carcinoma | Female | <65 | I/II | Unknown | Unknown | SD |
| PPP1R35 | SNV | Missense_Mutation | c.23C>T | p.Ser8Leu | p.S8L | Q8TAP8 | protein_coding | deleterious_low_confidence(0.02) | benign(0.127) | TCGA-WS-AB45-01 | Colorectum | colon adenocarcinoma | Female | <65 | I/II | Unknown | Unknown | SD | |
| PPP1R35 | SNV | Missense_Mutation | novel | c.673N>A | p.Gly225Ser | p.G225S | Q8TAP8 | protein_coding | tolerated(0.05) | benign(0.164) | TCGA-EO-A22U-01 | Endometrium | uterine corpus endometrioid carcinoma | Female | >=65 | I/II | Unknown | Unknown | SD |
| PPP1R35 | SNV | Missense_Mutation | c.83N>A | p.Pro28His | p.P28H | Q8TAP8 | protein_coding | deleterious(0) | probably_damaging(0.999) | TCGA-33-4566-01 | Lung | lung squamous cell carcinoma | Male | <65 | I/II | Unknown | Unknown | SD | |
| PPP1R35 | SNV | Missense_Mutation | novel | c.404N>C | p.Arg135Thr | p.R135T | Q8TAP8 | protein_coding | deleterious(0.02) | possibly_damaging(0.503) | TCGA-MF-A522-01 | Lung | lung squamous cell carcinoma | Male | <65 | I/II | Chemotherapy | cisplatin | PD |
| Page: 1 |
Top |
Related drugs of malignant transformation related genes |
| Identification of chemicals and drugs interact with genes involved in malignant transfromation |
| (DGIdb 4.0) |
| Entrez ID | Symbol | Category | Interaction Types | Drug Claim Name | Drug Name | PMIDs |
| Page: 1 |

Copyright 2023-Present -The University of Texas Health Science Center at Houston |