
|
|||||
|
 | |
| |
| |
| |
| |
| |
|
Gene: PPP1R1C |
Gene summary for PPP1R1C |
| Gene information | Species | Human | Gene symbol | PPP1R1C | Gene ID | 151242 |
| Gene name | protein phosphatase 1 regulatory inhibitor subunit 1C | |
| Gene Alias | IPP5 | |
| Cytomap | 2q31.3-q32.1 | |
| Gene Type | protein-coding | GO ID | GO:0007049 | UniProtAcc | Q8WVI7 |
Top |
Malignant transformation analysis |
| Identification of the aberrant gene expression in precancerous and cancerous lesions by comparing the gene expression of stem-like cells in diseased tissues with normal stem cells |
| Entrez ID | Symbol | Replicates | Species | Organ | Tissue | Adj P-value | Log2FC | Malignancy |
| 151242 | PPP1R1C | P75T-E | Human | Esophagus | ESCC | 3.53e-05 | 1.40e-01 | 0.1125 |
| 151242 | PPP1R1C | P82T-E | Human | Esophagus | ESCC | 6.32e-09 | 4.07e-01 | 0.1072 |
| 151242 | PPP1R1C | P89T-E | Human | Esophagus | ESCC | 8.39e-10 | 5.51e-01 | 0.1752 |
| 151242 | PPP1R1C | P91T-E | Human | Esophagus | ESCC | 2.37e-04 | 3.08e-01 | 0.1828 |
| 151242 | PPP1R1C | P107T-E | Human | Esophagus | ESCC | 4.36e-03 | 1.14e-01 | 0.171 |
| 151242 | PPP1R1C | P128T-E | Human | Esophagus | ESCC | 2.32e-21 | 6.22e-01 | 0.1241 |
| 151242 | PPP1R1C | P130T-E | Human | Esophagus | ESCC | 2.88e-06 | 2.32e-01 | 0.1676 |
| 151242 | PPP1R1C | RNA-P25T1-P25T1-1 | Human | Lung | AIS | 1.27e-19 | 8.28e-01 | -0.2116 |
| 151242 | PPP1R1C | RNA-P25T1-P25T1-2 | Human | Lung | AIS | 3.98e-07 | 8.06e-01 | -0.1941 |
| 151242 | PPP1R1C | RNA-P25T1-P25T1-3 | Human | Lung | AIS | 3.02e-07 | 7.94e-01 | -0.2107 |
| 151242 | PPP1R1C | RNA-P25T1-P25T1-4 | Human | Lung | AIS | 5.76e-16 | 7.77e-01 | -0.2119 |
| 151242 | PPP1R1C | RNA-P6T2-P6T2-1 | Human | Lung | IAC | 3.71e-12 | 4.64e-01 | -0.0166 |
| 151242 | PPP1R1C | RNA-P6T2-P6T2-2 | Human | Lung | IAC | 1.22e-09 | 4.06e-01 | -0.0132 |
| 151242 | PPP1R1C | RNA-P6T2-P6T2-3 | Human | Lung | IAC | 1.25e-12 | 4.38e-01 | -0.013 |
| 151242 | PPP1R1C | RNA-P6T2-P6T2-4 | Human | Lung | IAC | 5.67e-06 | 3.19e-01 | -0.0121 |
| Page: 1 2 |
| Tissue | Expression Dynamics | Abbreviation |
| Esophagus | 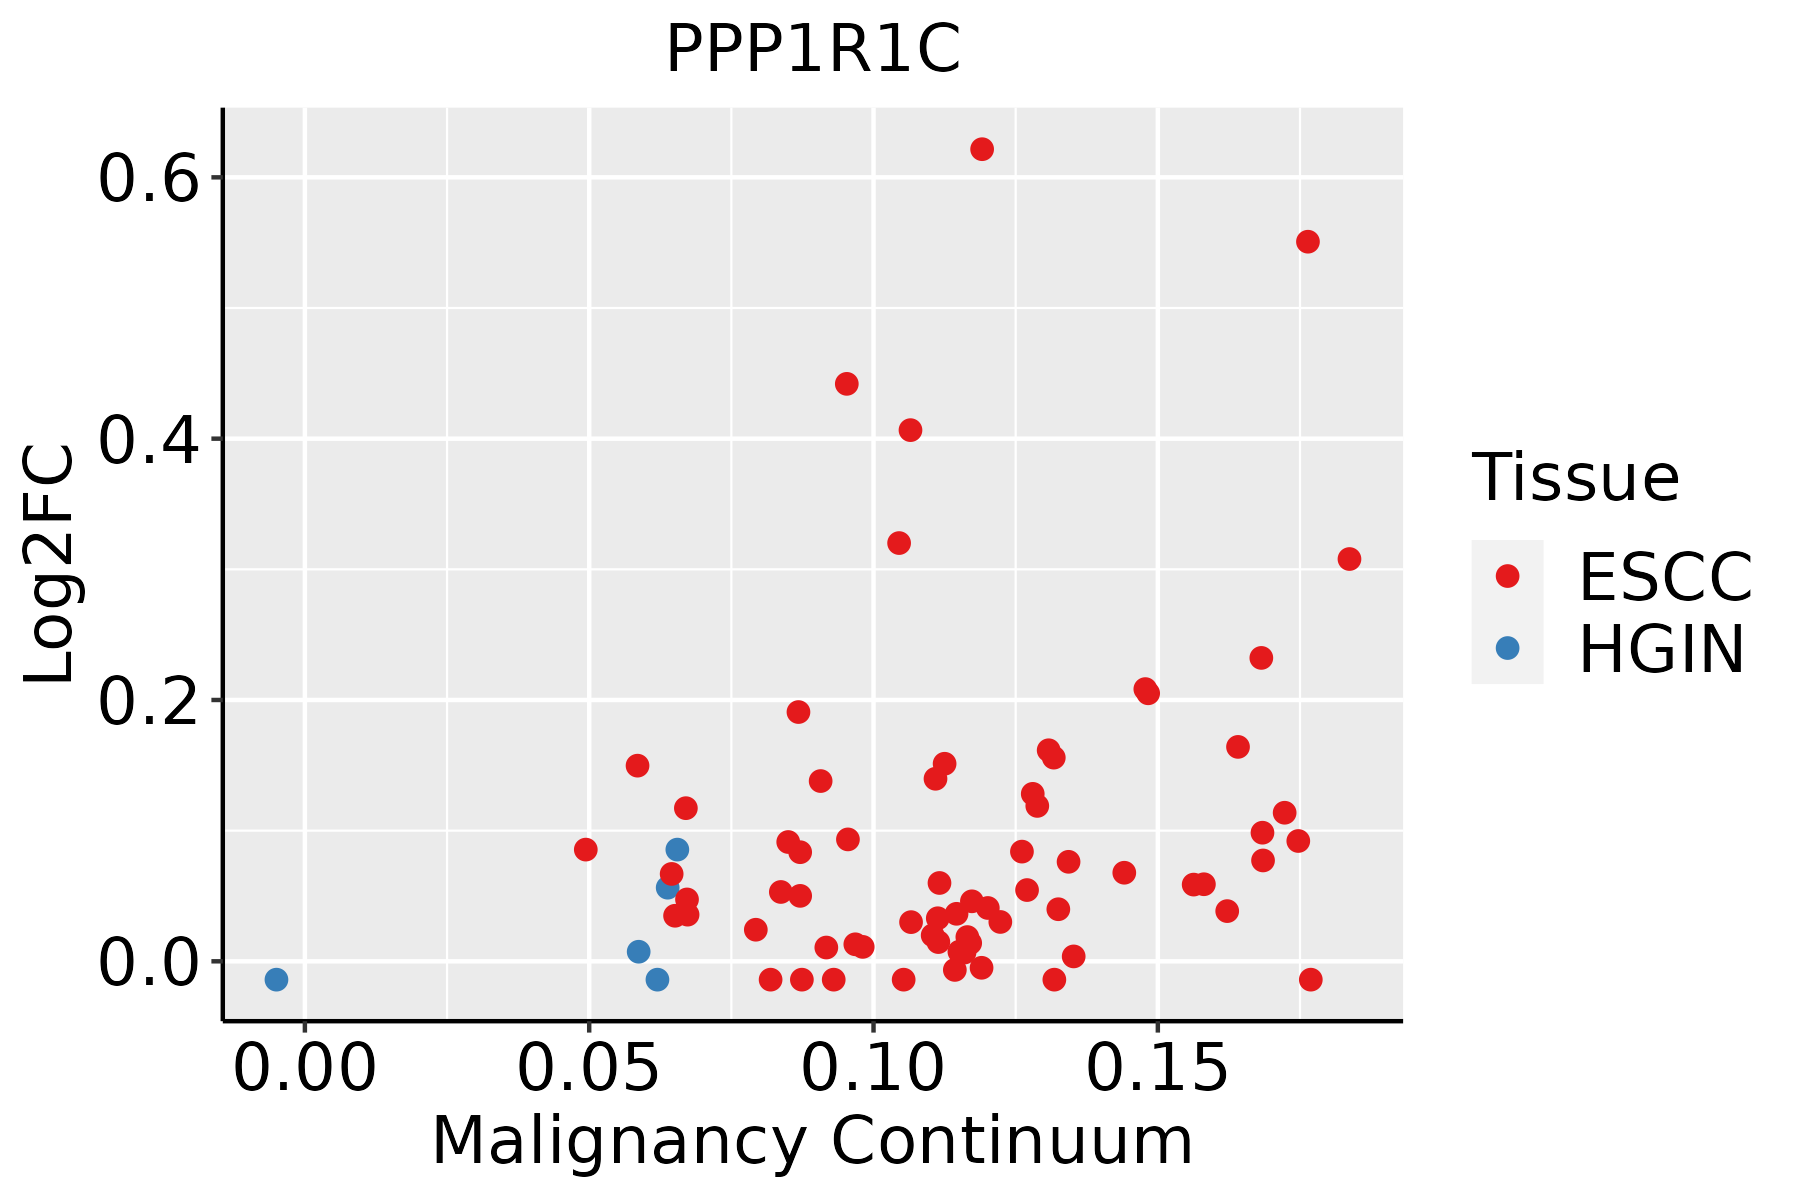 | ESCC: Esophageal squamous cell carcinoma |
| HGIN: High-grade intraepithelial neoplasias | ||
| LGIN: Low-grade intraepithelial neoplasias | ||
| Lung | 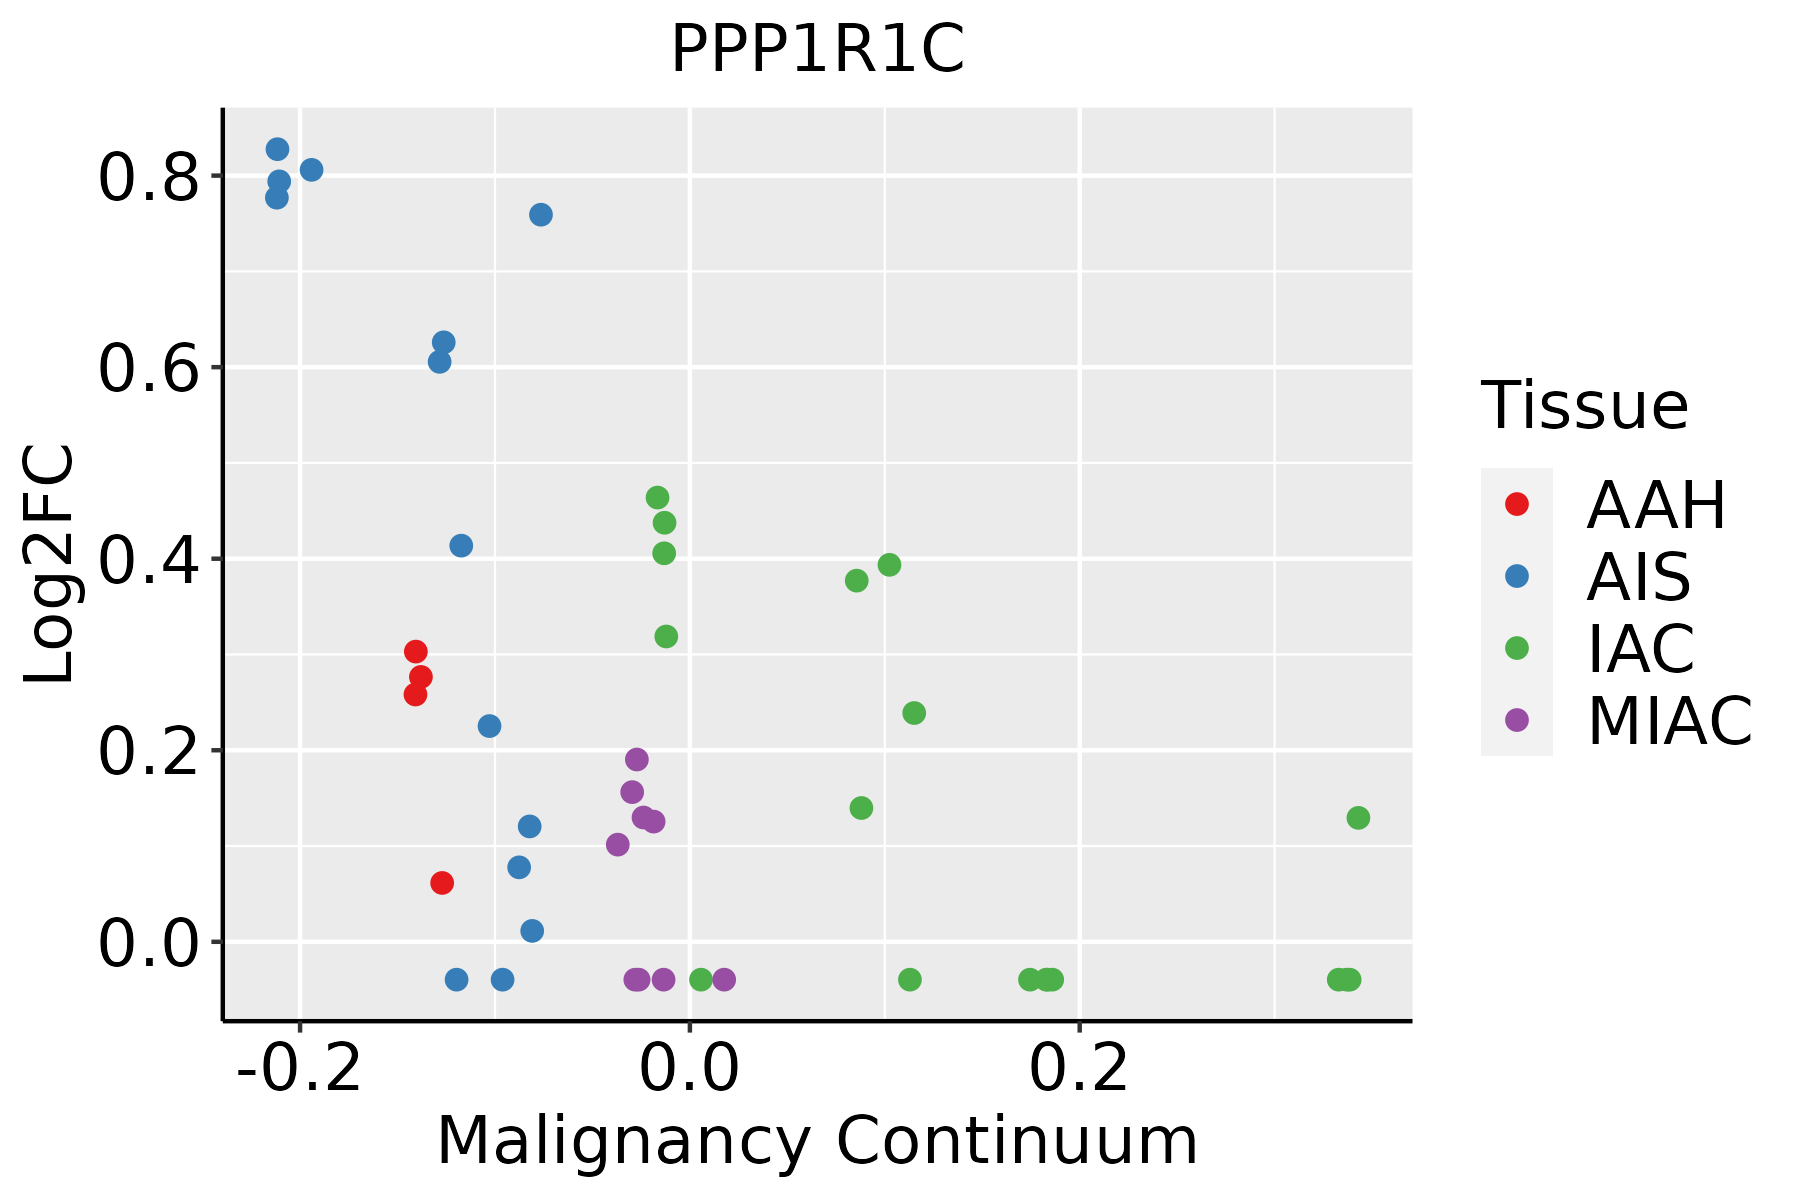 | AAH: Atypical adenomatous hyperplasia |
| AIS: Adenocarcinoma in situ | ||
| IAC: Invasive lung adenocarcinoma | ||
| MIA: Minimally invasive adenocarcinoma |
| ∗log2FC in expression of this searched gene in stem-like cells from each diseased tissue sample relative to stem-like cells in normal samples in each tissue plotted against the malignancy continuum. Samples are colored based on if they are from different disease stage. |
Top |
Malignant transformation related pathway analysis |
| Find out the enriched GO biological processes and KEGG pathways involved in transition from healthy to precancer to cancer |
| Tissue | Disease Stage | Enriched GO biological Processes |
| Colorectum | AD |  |
| Colorectum | SER |  |
| Colorectum | MSS |  |
| Colorectum | MSI-H |  |
| Colorectum | FAP |  |
| ∗Top 15 enriched GO BP terms are showed in the bar plot of each disease state in each tissue. Each row represents a significant GO biological process which is colored according to the -log10(p.adjust). |
| Page: 1 2 3 4 5 6 7 8 9 |
| GO ID | Tissue | Disease Stage | Description | Gene Ratio | Bg Ratio | pvalue | p.adjust | Count |
| Page: 1 |
| Pathway ID | Tissue | Disease Stage | Description | Gene Ratio | Bg Ratio | pvalue | p.adjust | qvalue | Count |
| Page: 1 |
Top |
Cell-cell communication analysis |
| Identification of potential cell-cell interactions between two cell types and their ligand-receptor pairs for different disease states |
| Ligand | Receptor | LRpair | Pathway | Tissue | Disease Stage |
| Page: 1 |
Top |
Single-cell gene regulatory network inference analysis |
| Find out the significant the regulons (TFs) and the target genes of each regulon across cell types for different disease states |
| TF | Cell Type | Tissue | Disease Stage | Target Gene | RSS | Regulon Activity |
| ∗The dot plots of a searched regulon are shown for all cell subpopulations in each disease state of each tissue based on the regulon specific score inferred using pySCENIC and by calculating the average expression. |
| Page: 1 |
Top |
Somatic mutation of malignant transformation related genes |
| Annotation of somatic variants for genes involved in malignant transformation |
| Hugo Symbol | Variant Class | Variant Classification | dbSNP RS | HGVSc | HGVSp | HGVSp Short | SWISSPROT | BIOTYPE | SIFT | PolyPhen | Tumor Sample Barcode | Tissue | Histology | Sex | Age | Stage | Therapy Types | Drugs | Outcome |
| PPP1R1C | SNV | Missense_Mutation | c.307N>A | p.Glu103Lys | p.E103K | Q8WVI7 | protein_coding | deleterious(0.01) | benign(0.183) | TCGA-AR-A1AO-01 | Breast | breast invasive carcinoma | Female | <65 | I/II | Chemotherapy | doxorubicin | SD | |
| PPP1R1C | deletion | Frame_Shift_Del | novel | c.179delN | p.Asn63ThrfsTer24 | p.N63Tfs*24 | Q8WVI7 | protein_coding | TCGA-EA-A3HU-01 | Cervix | cervical & endocervical cancer | Female | <65 | I/II | Unknown | Unknown | SD | ||
| PPP1R1C | SNV | Missense_Mutation | rs768049964 | c.341G>A | p.Arg114Gln | p.R114Q | Q8WVI7 | protein_coding | tolerated_low_confidence(0.24) | benign(0) | TCGA-AU-6004-01 | Colorectum | colon adenocarcinoma | Female | >=65 | I/II | Unknown | Unknown | SD |
| PPP1R1C | SNV | Missense_Mutation | novel | c.301N>A | p.Pro101Thr | p.P101T | Q8WVI7 | protein_coding | deleterious(0.02) | probably_damaging(0.998) | TCGA-AP-A1DK-01 | Endometrium | uterine corpus endometrioid carcinoma | Female | <65 | I/II | Unknown | Unknown | SD |
| PPP1R1C | SNV | Missense_Mutation | c.207G>T | p.Gln69His | p.Q69H | Q8WVI7 | protein_coding | tolerated(0.14) | probably_damaging(0.997) | TCGA-BS-A0UV-01 | Endometrium | uterine corpus endometrioid carcinoma | Female | <65 | III/IV | Unknown | Unknown | SD | |
| PPP1R1C | SNV | Missense_Mutation | novel | c.150G>T | p.Glu50Asp | p.E50D | Q8WVI7 | protein_coding | tolerated(1) | benign(0.022) | TCGA-E6-A1LX-01 | Endometrium | uterine corpus endometrioid carcinoma | Female | <65 | I/II | Unknown | Unknown | SD |
| PPP1R1C | insertion | Frame_Shift_Ins | novel | c.18_19insA | p.Ile9AspfsTer15 | p.I9Dfs*15 | Q8WVI7 | protein_coding | TCGA-EO-A22U-01 | Endometrium | uterine corpus endometrioid carcinoma | Female | >=65 | I/II | Unknown | Unknown | SD | ||
| PPP1R1C | SNV | Missense_Mutation | c.48N>A | p.Phe16Leu | p.F16L | Q8WVI7 | protein_coding | tolerated(1) | benign(0.203) | TCGA-05-5425-01 | Lung | lung adenocarcinoma | Male | >=65 | I/II | Targeted Molecular therapy | gefitinib | PD | |
| PPP1R1C | SNV | Missense_Mutation | novel | c.85G>T | p.Gly29Cys | p.G29C | Q8WVI7 | protein_coding | tolerated_low_confidence(0.16) | benign(0.006) | TCGA-91-A4BC-01 | Lung | lung adenocarcinoma | Male | <65 | I/II | Unknown | Unknown | SD |
| PPP1R1C | SNV | Missense_Mutation | c.65N>T | p.Pro22Leu | p.P22L | Q8WVI7 | protein_coding | deleterious(0) | probably_damaging(0.999) | TCGA-CG-4437-01 | Stomach | stomach adenocarcinoma | Male | >=65 | I/II | Unknown | Unknown | SD |
| Page: 1 |
Top |
Related drugs of malignant transformation related genes |
| Identification of chemicals and drugs interact with genes involved in malignant transfromation |
| (DGIdb 4.0) |
| Entrez ID | Symbol | Category | Interaction Types | Drug Claim Name | Drug Name | PMIDs |
| Page: 1 |

Copyright 2023-Present -The University of Texas Health Science Center at Houston |