
|
|||||
|
 | |
| |
| |
| |
| |
| |
|
Gene: POLD4 |
Gene summary for POLD4 |
| Gene information | Species | Human | Gene symbol | POLD4 | Gene ID | 57804 |
| Gene name | DNA polymerase delta 4, accessory subunit | |
| Gene Alias | POLDS | |
| Cytomap | 11q13.2 | |
| Gene Type | protein-coding | GO ID | GO:0000731 | UniProtAcc | Q9HCU8 |
Top |
Malignant transformation analysis |
| Identification of the aberrant gene expression in precancerous and cancerous lesions by comparing the gene expression of stem-like cells in diseased tissues with normal stem cells |
| Entrez ID | Symbol | Replicates | Species | Organ | Tissue | Adj P-value | Log2FC | Malignancy |
| 57804 | POLD4 | P5T-E | Human | Esophagus | ESCC | 1.12e-88 | 1.54e+00 | 0.1327 |
| 57804 | POLD4 | P8T-E | Human | Esophagus | ESCC | 6.61e-112 | 2.12e+00 | 0.0889 |
| 57804 | POLD4 | P9T-E | Human | Esophagus | ESCC | 5.27e-53 | 1.16e+00 | 0.1131 |
| 57804 | POLD4 | P10T-E | Human | Esophagus | ESCC | 1.41e-37 | 5.78e-01 | 0.116 |
| 57804 | POLD4 | P11T-E | Human | Esophagus | ESCC | 4.42e-37 | 1.13e+00 | 0.1426 |
| 57804 | POLD4 | P12T-E | Human | Esophagus | ESCC | 7.78e-83 | 1.53e+00 | 0.1122 |
| 57804 | POLD4 | P15T-E | Human | Esophagus | ESCC | 3.34e-88 | 1.67e+00 | 0.1149 |
| 57804 | POLD4 | P16T-E | Human | Esophagus | ESCC | 5.17e-45 | 8.59e-01 | 0.1153 |
| 57804 | POLD4 | P17T-E | Human | Esophagus | ESCC | 4.56e-36 | 1.11e+00 | 0.1278 |
| 57804 | POLD4 | P19T-E | Human | Esophagus | ESCC | 1.26e-31 | 1.83e+00 | 0.1662 |
| 57804 | POLD4 | P20T-E | Human | Esophagus | ESCC | 2.40e-84 | 1.60e+00 | 0.1124 |
| 57804 | POLD4 | P21T-E | Human | Esophagus | ESCC | 4.78e-103 | 1.86e+00 | 0.1617 |
| 57804 | POLD4 | P22T-E | Human | Esophagus | ESCC | 2.45e-66 | 1.05e+00 | 0.1236 |
| 57804 | POLD4 | P23T-E | Human | Esophagus | ESCC | 2.01e-82 | 1.63e+00 | 0.108 |
| 57804 | POLD4 | P24T-E | Human | Esophagus | ESCC | 1.71e-98 | 1.82e+00 | 0.1287 |
| 57804 | POLD4 | P26T-E | Human | Esophagus | ESCC | 4.51e-84 | 1.38e+00 | 0.1276 |
| 57804 | POLD4 | P27T-E | Human | Esophagus | ESCC | 3.56e-64 | 1.02e+00 | 0.1055 |
| 57804 | POLD4 | P28T-E | Human | Esophagus | ESCC | 3.75e-82 | 1.33e+00 | 0.1149 |
| 57804 | POLD4 | P30T-E | Human | Esophagus | ESCC | 9.20e-66 | 1.64e+00 | 0.137 |
| 57804 | POLD4 | P31T-E | Human | Esophagus | ESCC | 2.72e-80 | 1.29e+00 | 0.1251 |
| Page: 1 2 3 4 5 6 7 8 |
| Tissue | Expression Dynamics | Abbreviation |
| Cervix | 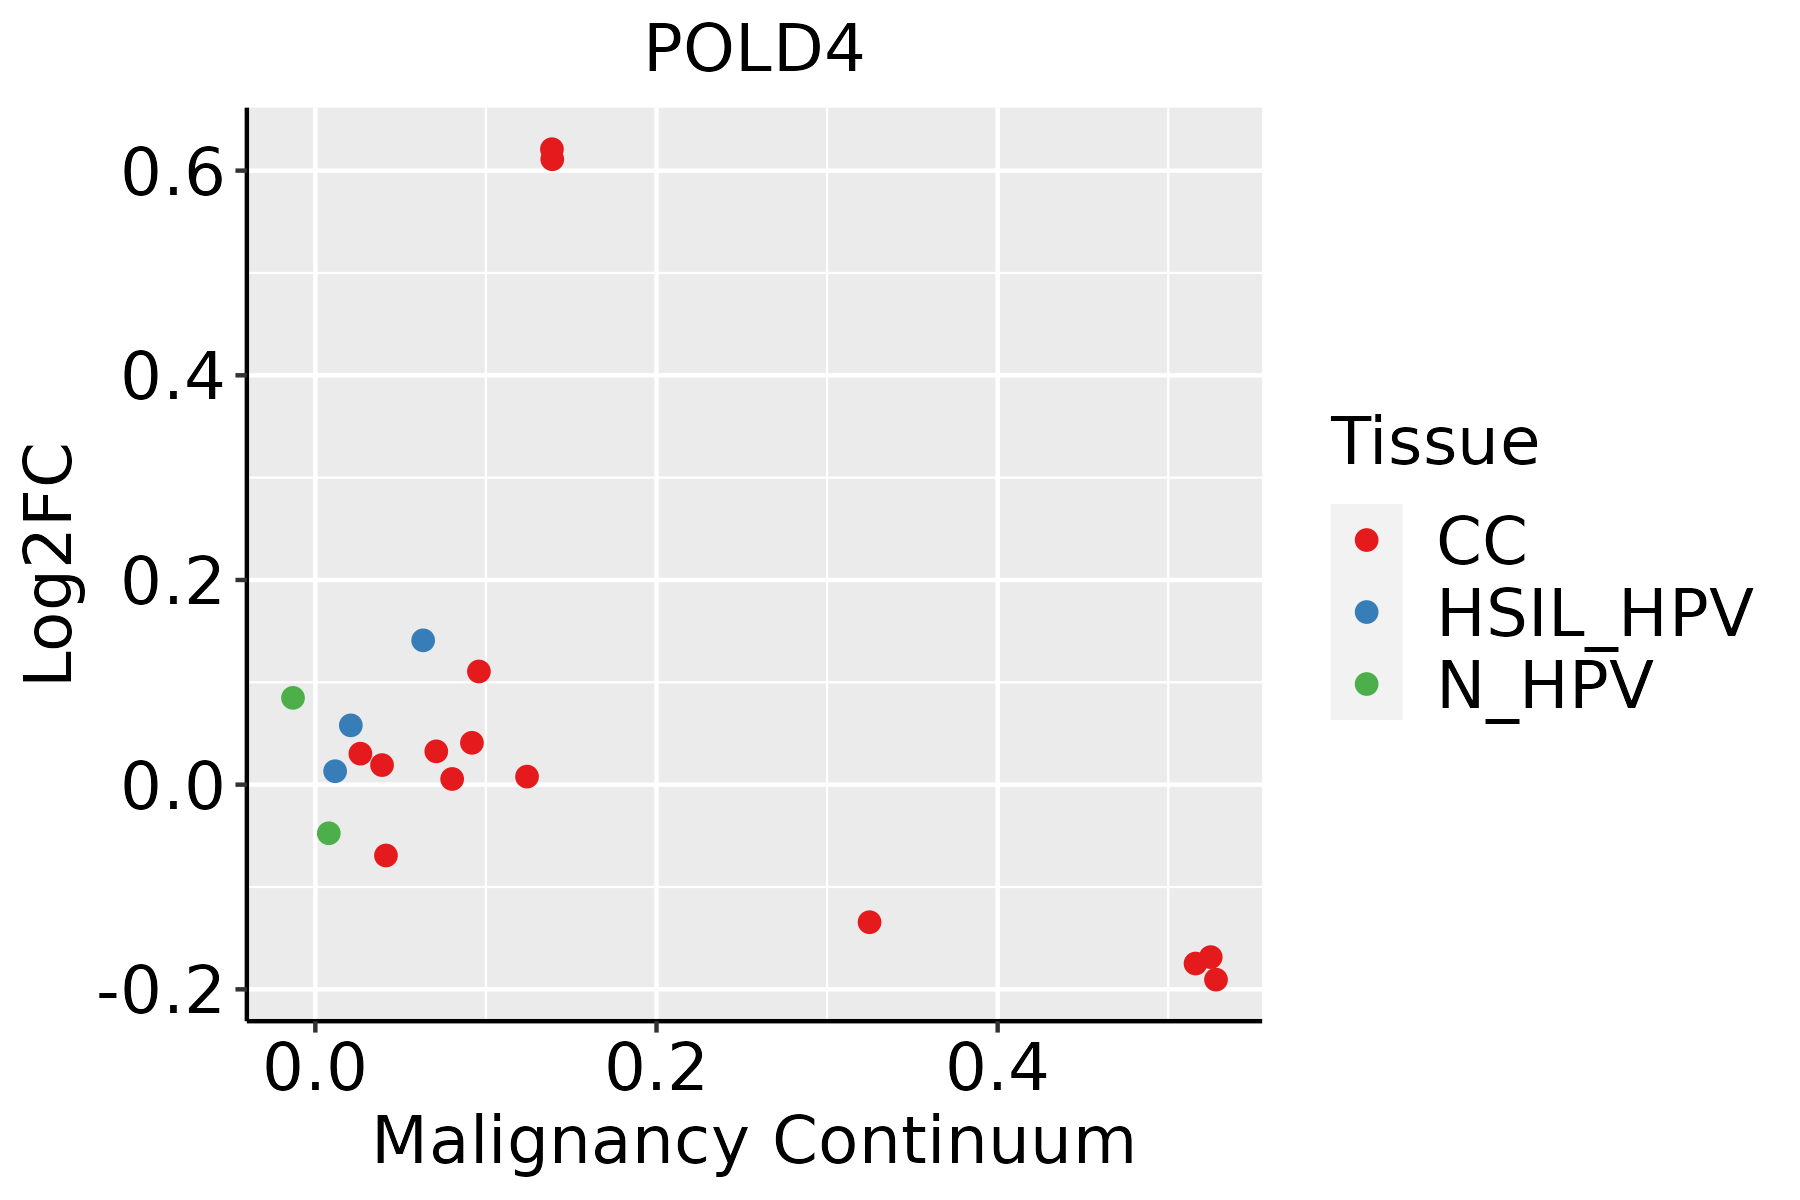 | CC: Cervix cancer |
| HSIL_HPV: HPV-infected high-grade squamous intraepithelial lesions | ||
| N_HPV: HPV-infected normal cervix | ||
| Esophagus | 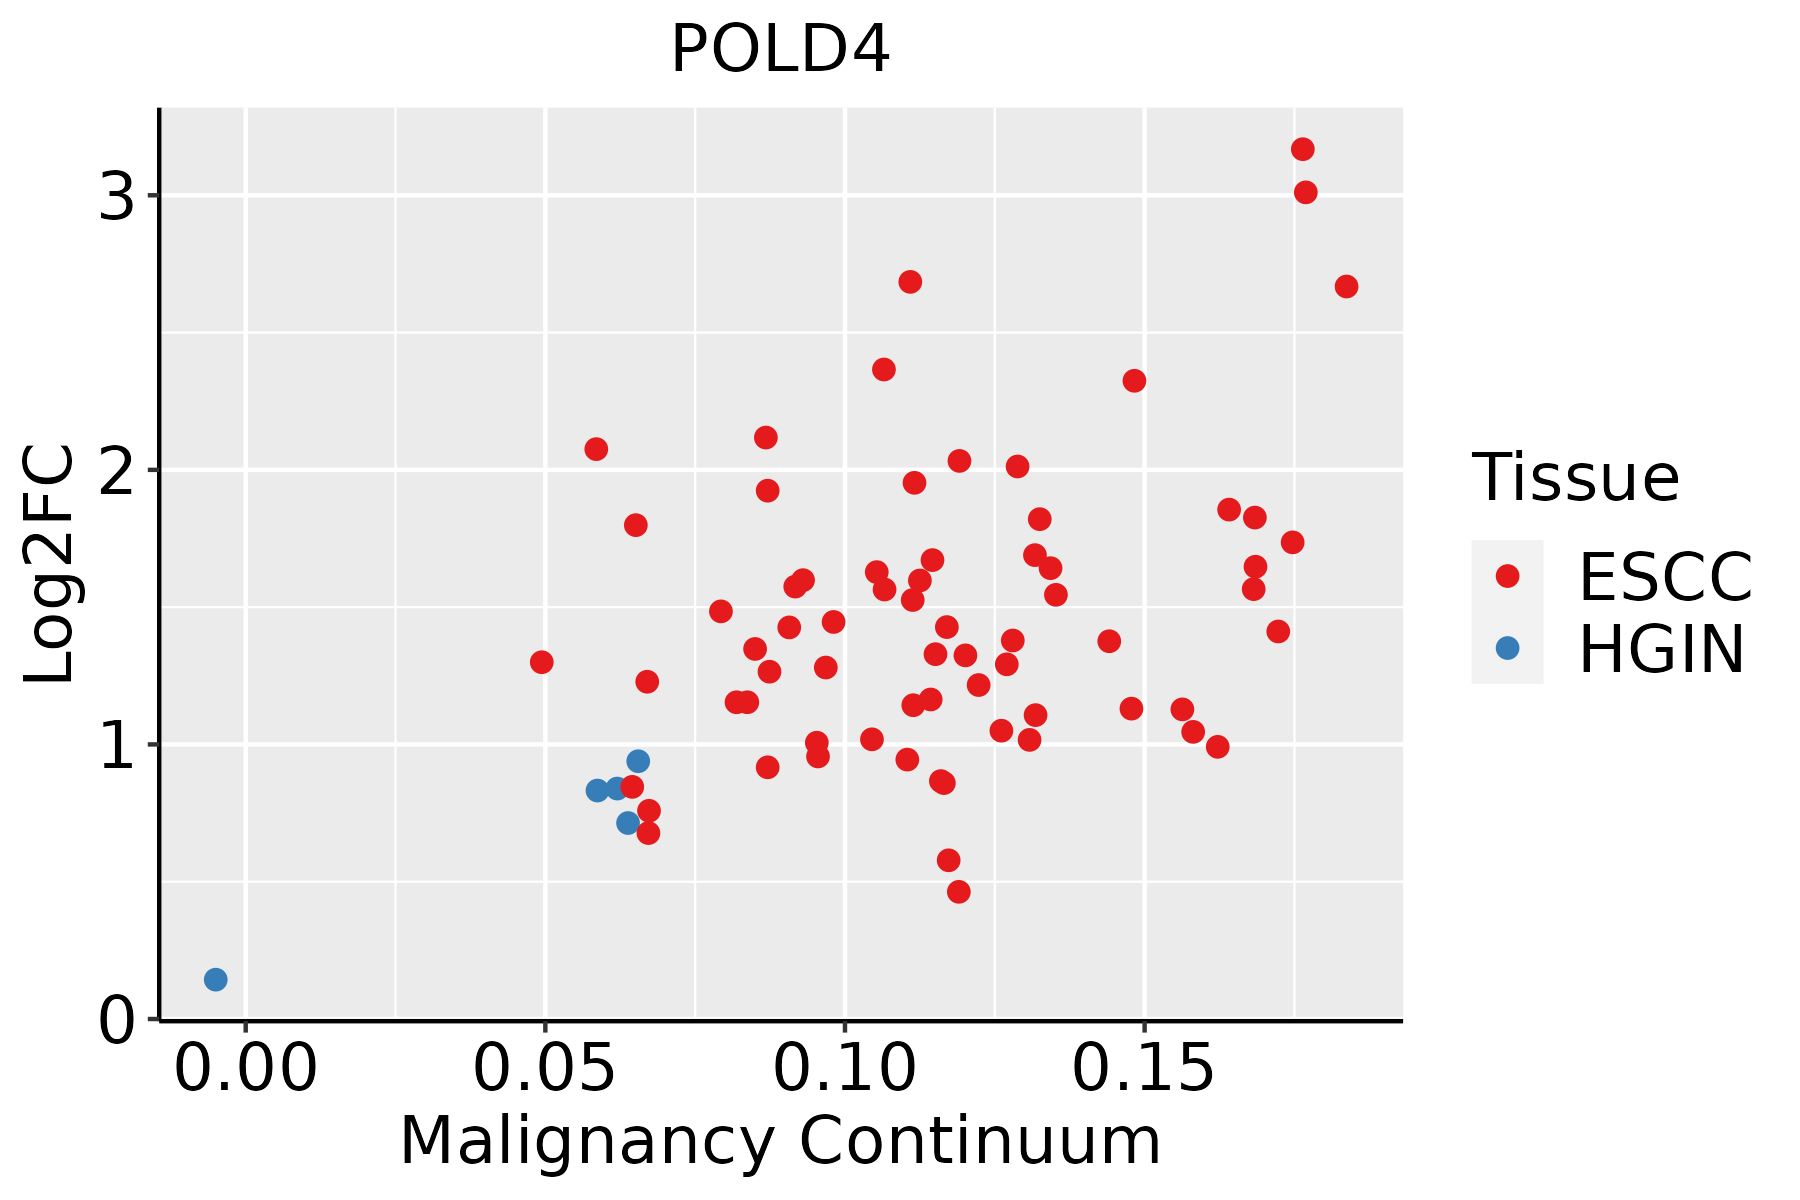 | ESCC: Esophageal squamous cell carcinoma |
| HGIN: High-grade intraepithelial neoplasias | ||
| LGIN: Low-grade intraepithelial neoplasias | ||
| GC | 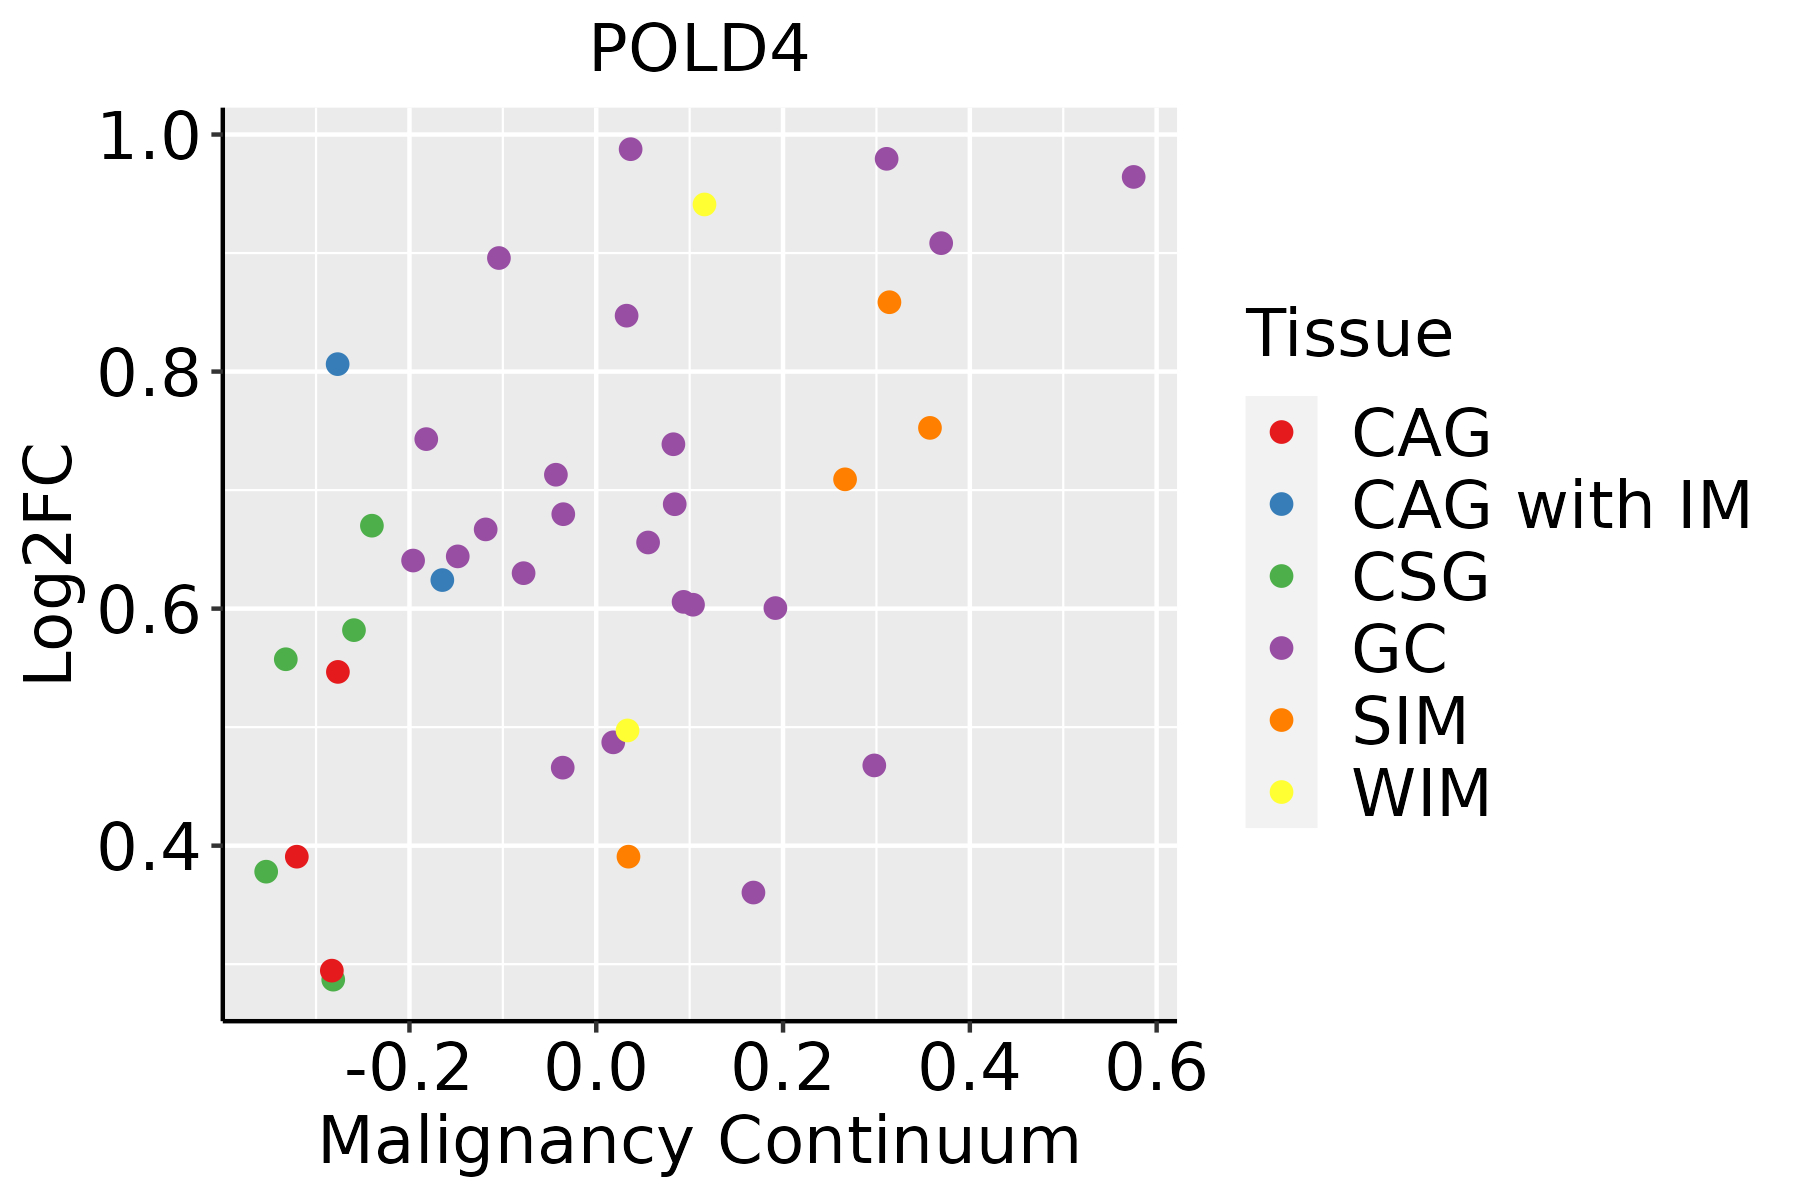 | CAG: Chronic atrophic gastritis |
| CAG with IM: Chronic atrophic gastritis with intestinal metaplasia | ||
| CSG: Chronic superficial gastritis | ||
| GC: Gastric cancer | ||
| SIM: Severe intestinal metaplasia | ||
| WIM: Wild intestinal metaplasia | ||
| Liver | 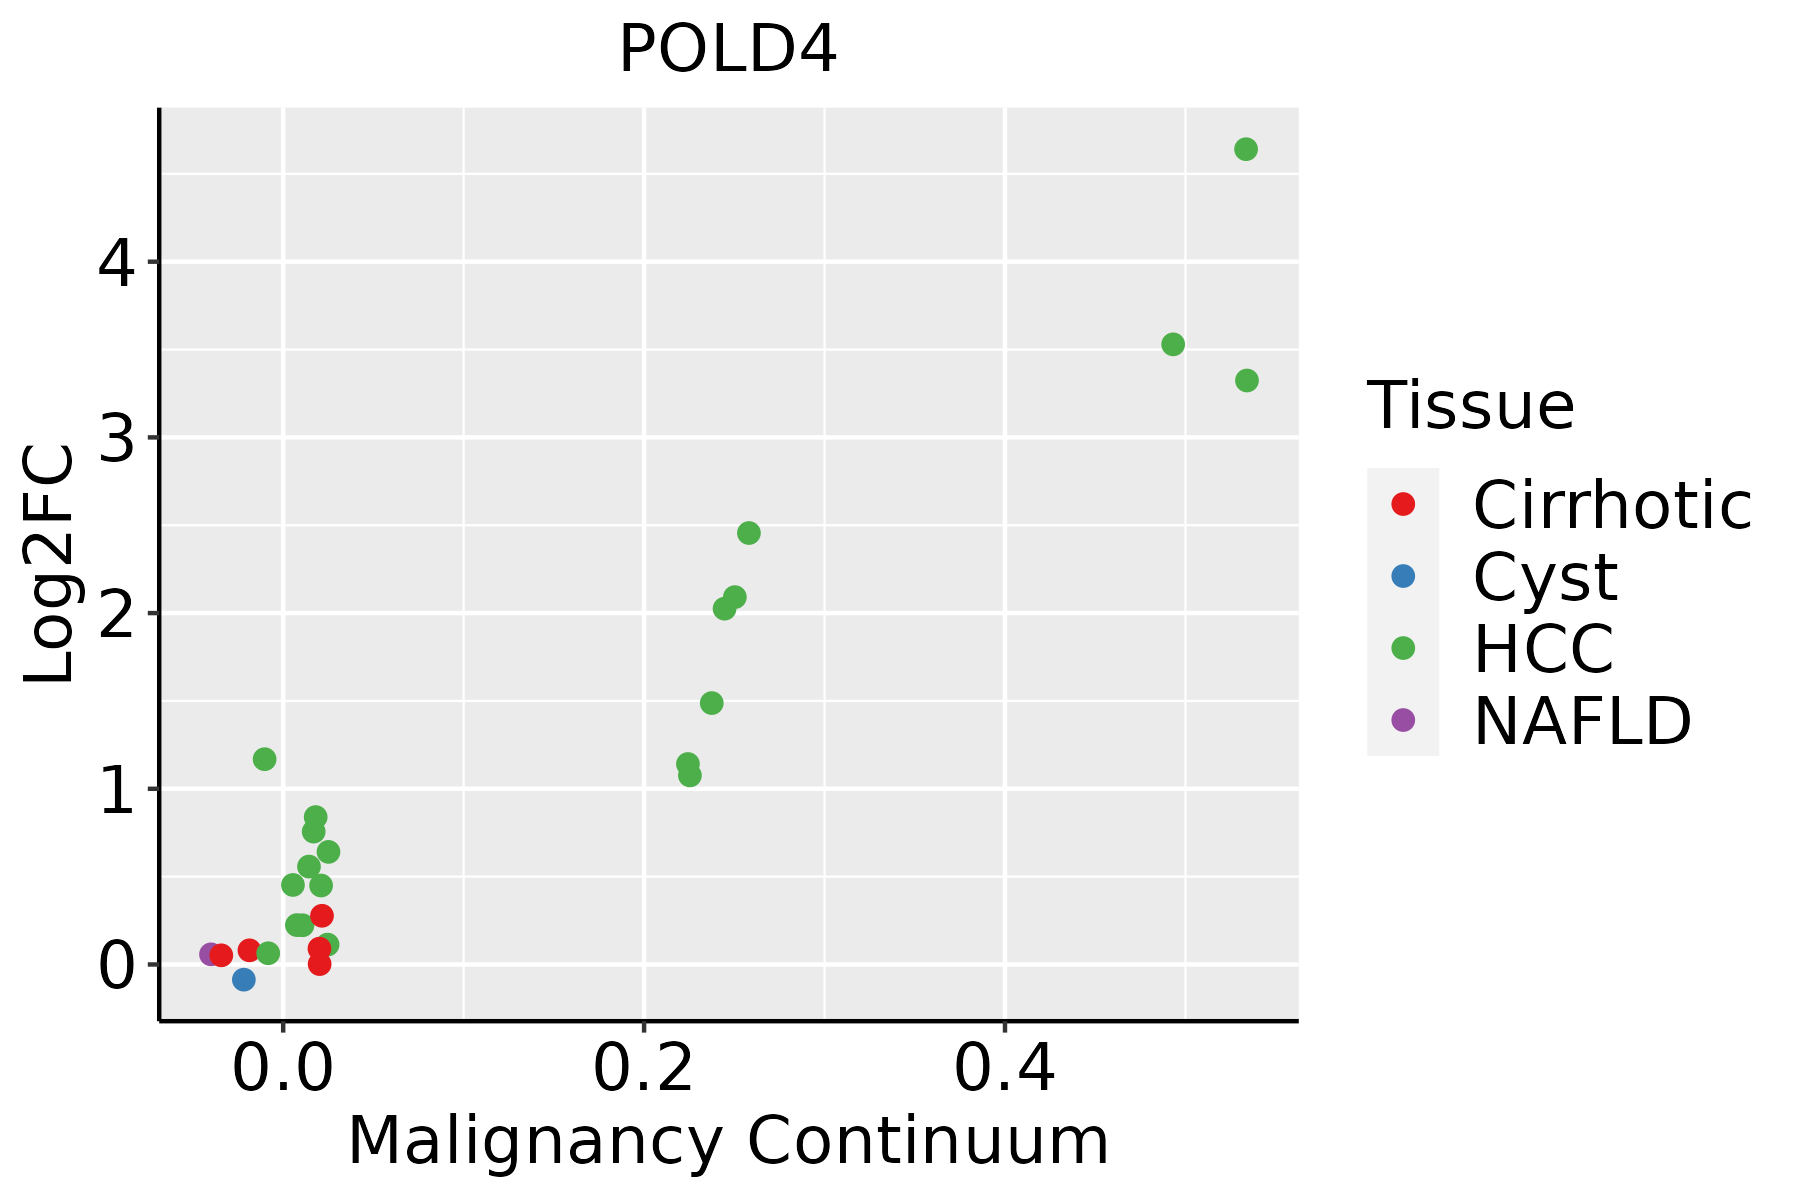 | HCC: Hepatocellular carcinoma |
| NAFLD: Non-alcoholic fatty liver disease | ||
| Oral Cavity |  | EOLP: Erosive Oral lichen planus |
| LP: leukoplakia | ||
| NEOLP: Non-erosive oral lichen planus | ||
| OSCC: Oral squamous cell carcinoma | ||
| Prostate | 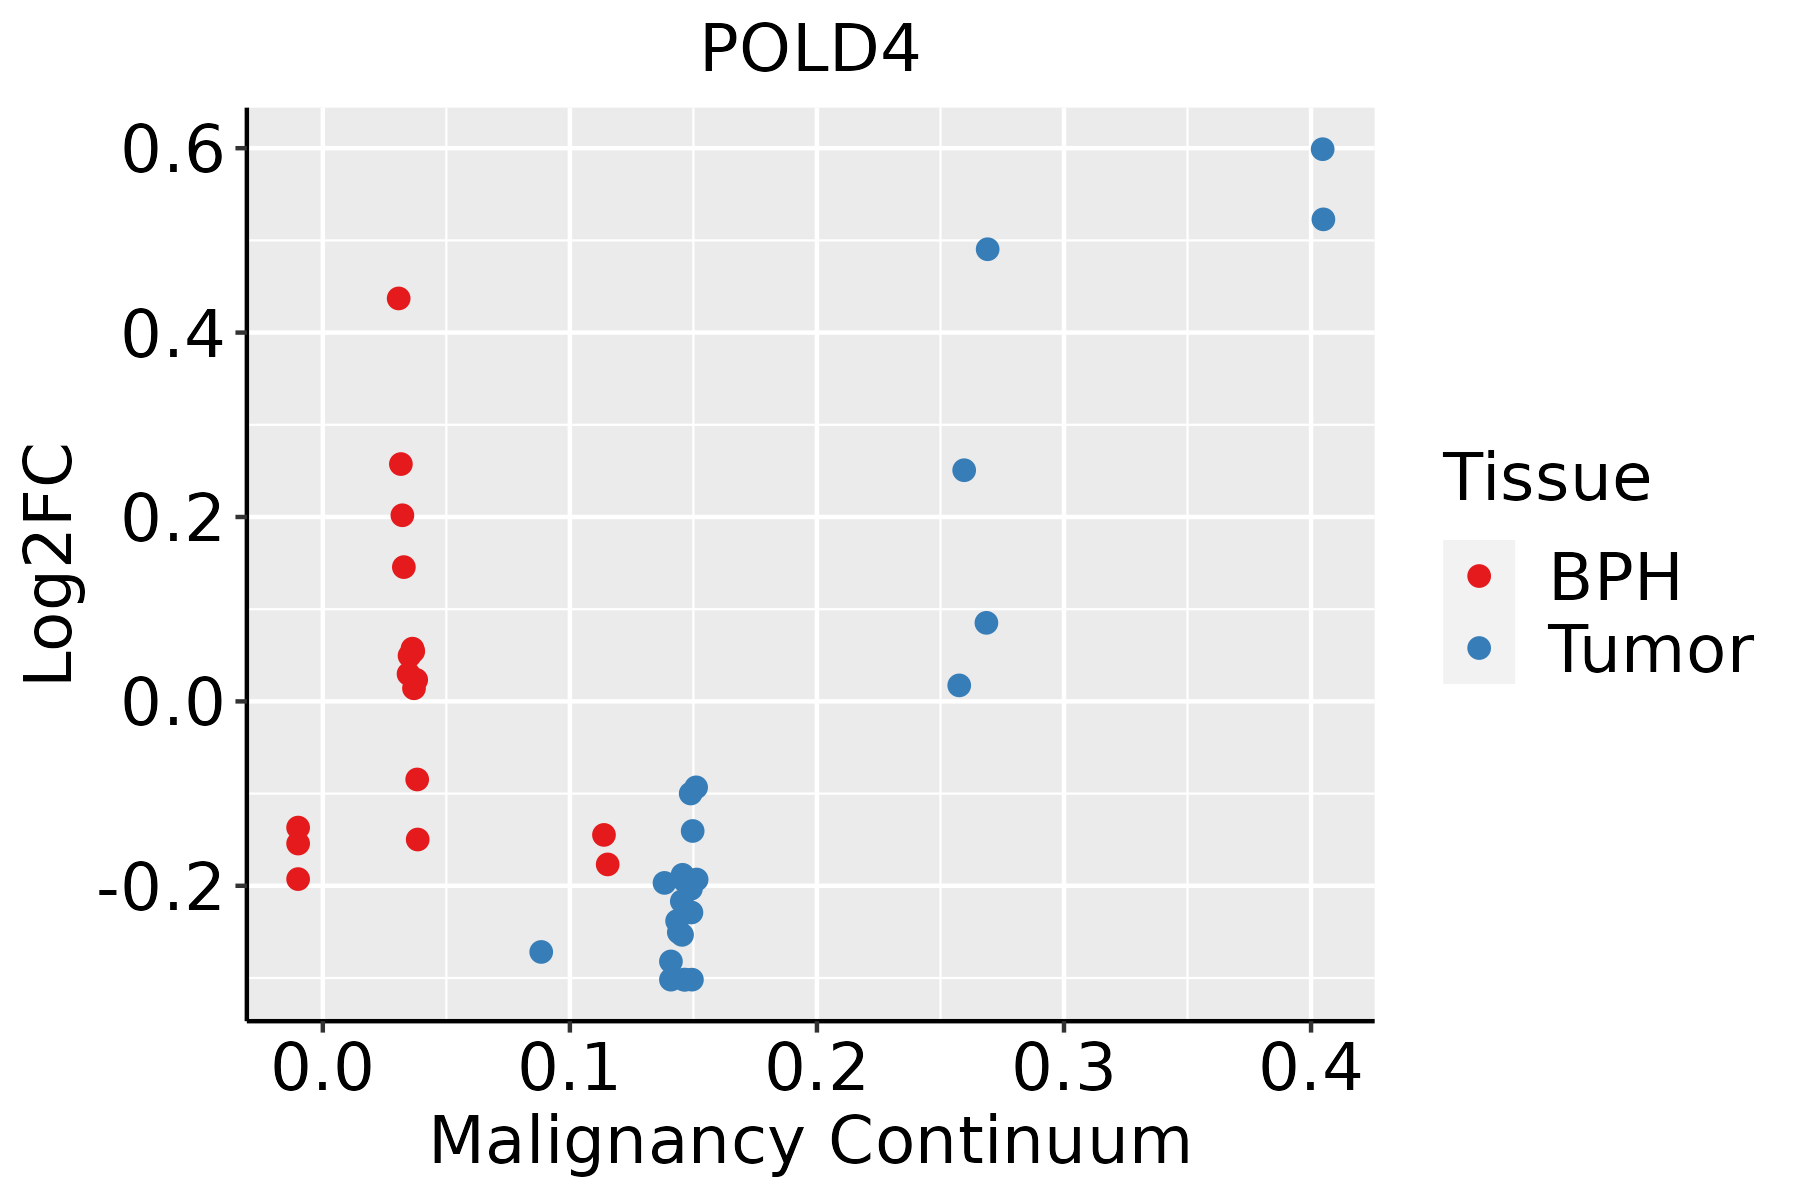 | BPH: Benign Prostatic Hyperplasia |
| Skin | 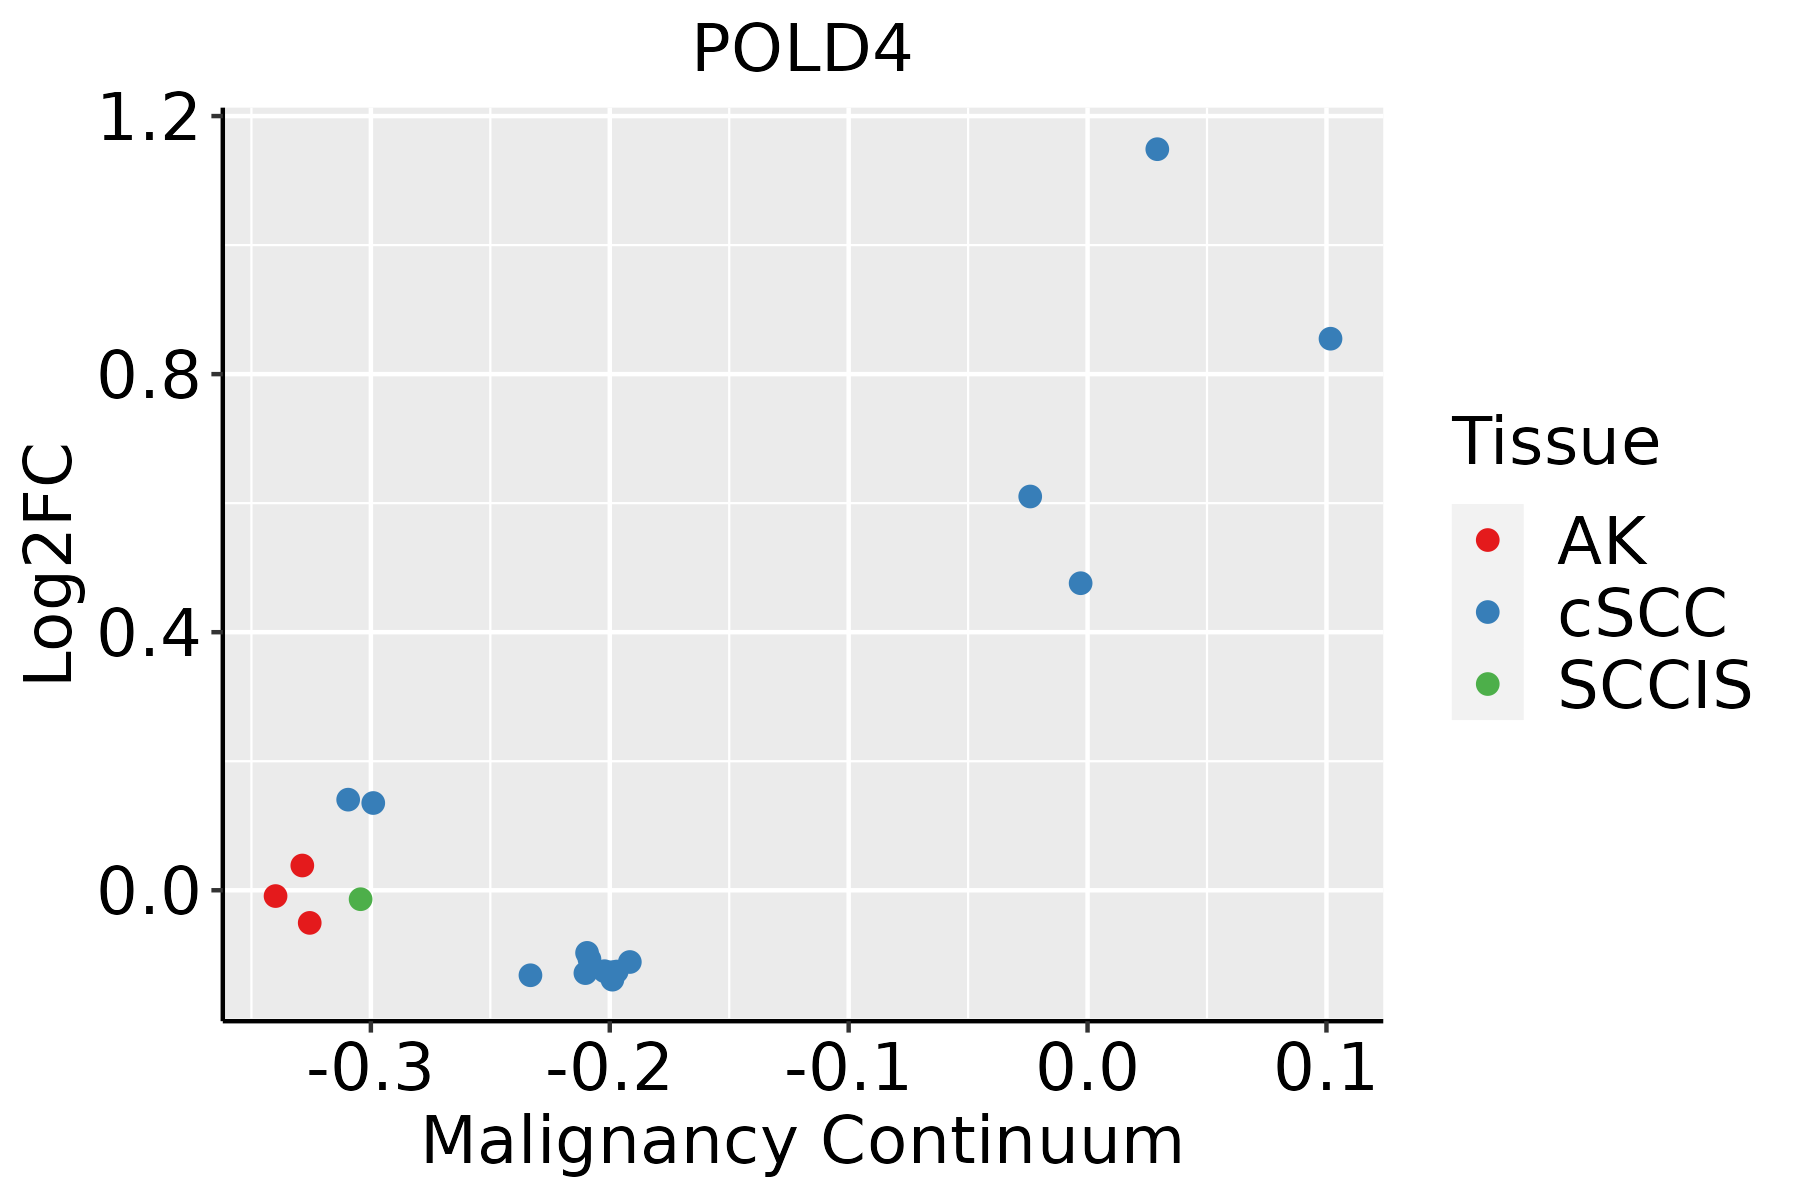 | AK: Actinic keratosis |
| cSCC: Cutaneous squamous cell carcinoma | ||
| SCCIS:squamous cell carcinoma in situ | ||
| Thyroid | 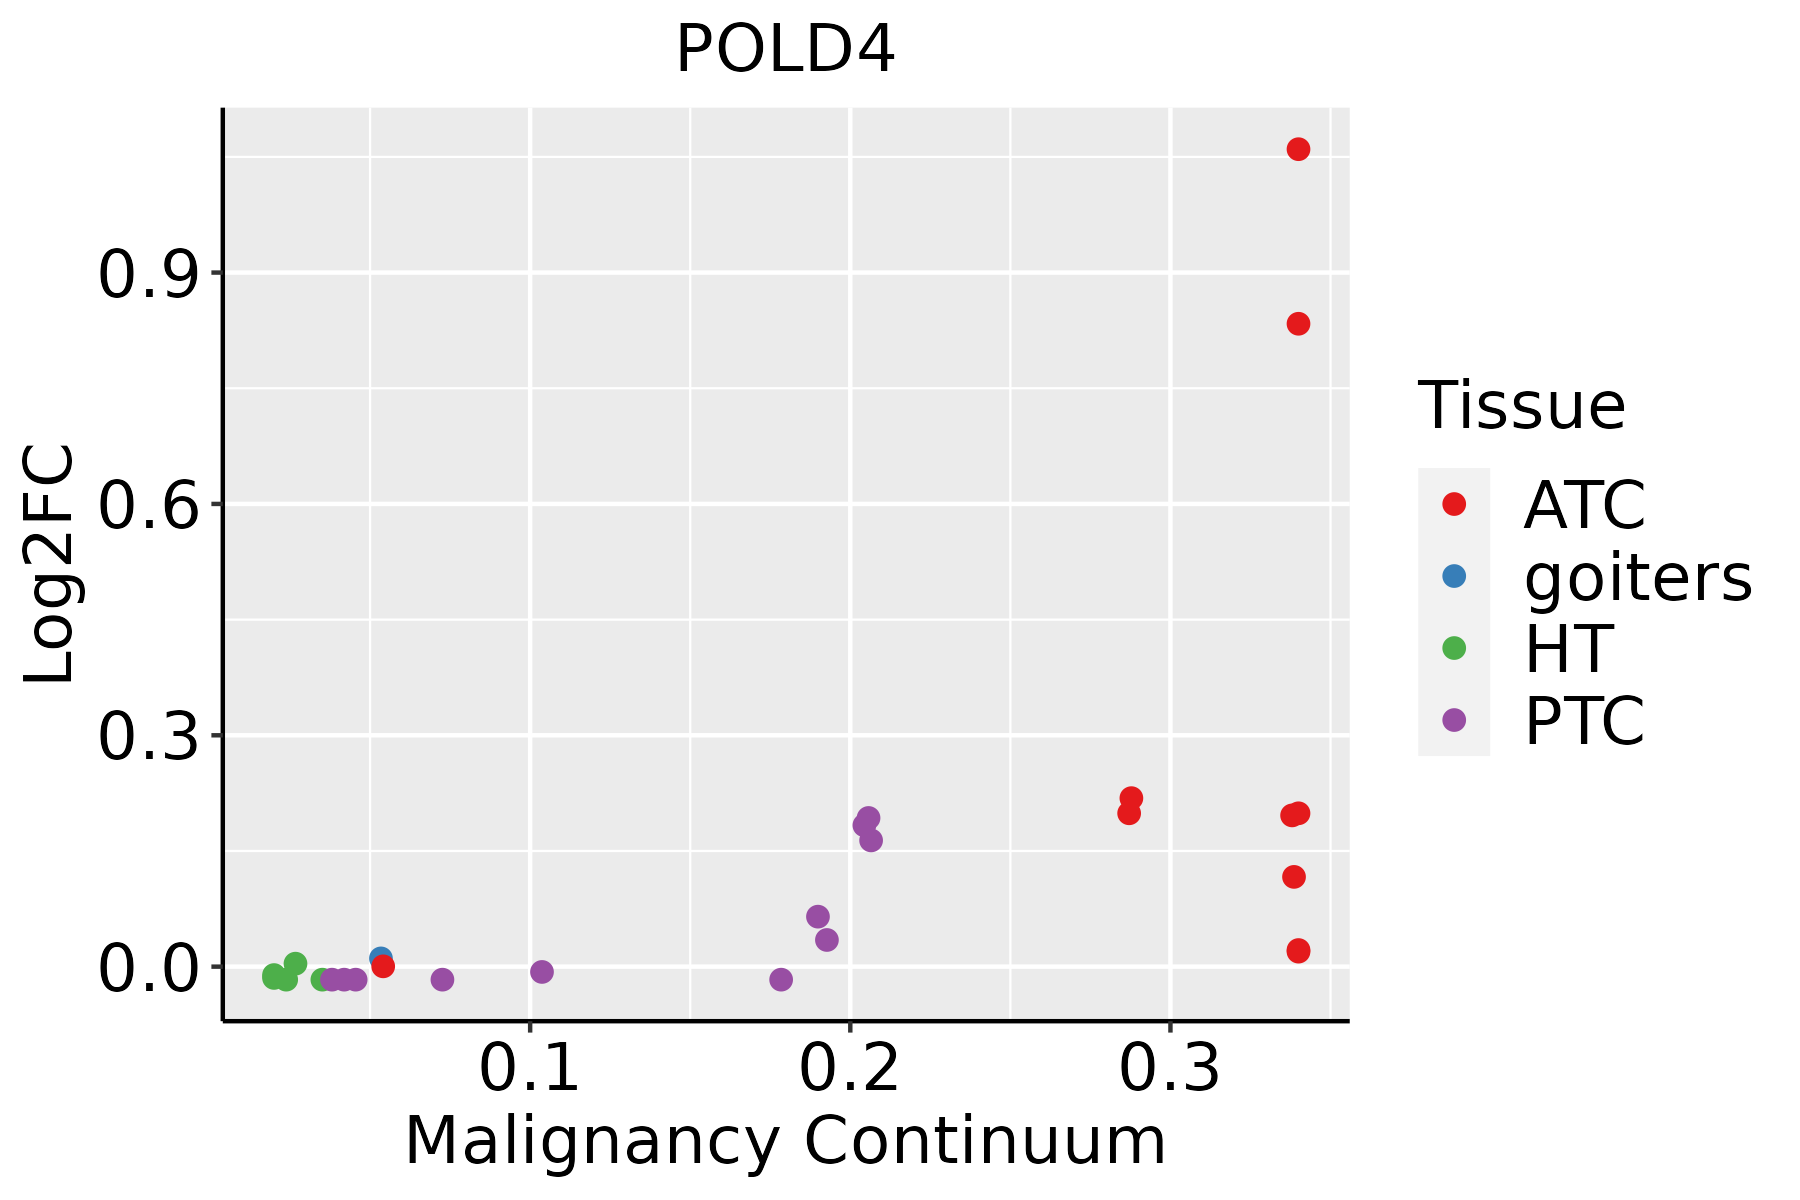 | ATC: Anaplastic thyroid cancer |
| HT: Hashimoto's thyroiditis | ||
| PTC: Papillary thyroid cancer |
| ∗log2FC in expression of this searched gene in stem-like cells from each diseased tissue sample relative to stem-like cells in normal samples in each tissue plotted against the malignancy continuum. Samples are colored based on if they are from different disease stage. |
Top |
Malignant transformation related pathway analysis |
| Find out the enriched GO biological processes and KEGG pathways involved in transition from healthy to precancer to cancer |
| Tissue | Disease Stage | Enriched GO biological Processes |
| Colorectum | AD |  |
| Colorectum | SER |  |
| Colorectum | MSS |  |
| Colorectum | MSI-H |  |
| Colorectum | FAP |  |
| ∗Top 15 enriched GO BP terms are showed in the bar plot of each disease state in each tissue. Each row represents a significant GO biological process which is colored according to the -log10(p.adjust). |
| Page: 1 2 3 4 5 6 7 8 9 |
| GO ID | Tissue | Disease Stage | Description | Gene Ratio | Bg Ratio | pvalue | p.adjust | Count |
| GO:00062602 | Cervix | CC | DNA replication | 48/2311 | 260/18723 | 2.70e-03 | 1.85e-02 | 48 |
| GO:007189710 | Esophagus | HGIN | DNA biosynthetic process | 44/2587 | 180/18723 | 8.97e-05 | 1.96e-03 | 44 |
| GO:00062604 | Esophagus | ESCC | DNA replication | 181/8552 | 260/18723 | 3.55e-15 | 2.05e-13 | 181 |
| GO:007189716 | Esophagus | ESCC | DNA biosynthetic process | 127/8552 | 180/18723 | 1.04e-11 | 3.85e-10 | 127 |
| GO:00062612 | Esophagus | ESCC | DNA-dependent DNA replication | 100/8552 | 151/18723 | 2.61e-07 | 3.94e-06 | 100 |
| GO:00062601 | Liver | HCC | DNA replication | 146/7958 | 260/18723 | 5.68e-06 | 7.02e-05 | 146 |
| GO:00718975 | Liver | HCC | DNA biosynthetic process | 99/7958 | 180/18723 | 4.66e-04 | 3.08e-03 | 99 |
| GO:0006261 | Liver | HCC | DNA-dependent DNA replication | 80/7958 | 151/18723 | 5.91e-03 | 2.44e-02 | 80 |
| GO:00062603 | Oral cavity | OSCC | DNA replication | 159/7305 | 260/18723 | 3.25e-13 | 1.59e-11 | 159 |
| GO:00718979 | Oral cavity | OSCC | DNA biosynthetic process | 106/7305 | 180/18723 | 4.86e-08 | 8.95e-07 | 106 |
| GO:00062611 | Oral cavity | OSCC | DNA-dependent DNA replication | 84/7305 | 151/18723 | 2.46e-05 | 2.30e-04 | 84 |
| GO:000626011 | Oral cavity | LP | DNA replication | 97/4623 | 260/18723 | 3.67e-06 | 7.75e-05 | 97 |
| GO:007189715 | Oral cavity | LP | DNA biosynthetic process | 71/4623 | 180/18723 | 8.04e-06 | 1.52e-04 | 71 |
| GO:007189722 | Oral cavity | EOLP | DNA biosynthetic process | 33/2218 | 180/18723 | 7.00e-03 | 3.40e-02 | 33 |
| GO:00718978 | Prostate | BPH | DNA biosynthetic process | 50/3107 | 180/18723 | 1.06e-04 | 9.73e-04 | 50 |
| GO:007189714 | Prostate | Tumor | DNA biosynthetic process | 51/3246 | 180/18723 | 1.63e-04 | 1.46e-03 | 51 |
| GO:000626012 | Skin | cSCC | DNA replication | 106/4864 | 260/18723 | 1.18e-07 | 2.77e-06 | 106 |
| GO:007189718 | Skin | cSCC | DNA biosynthetic process | 74/4864 | 180/18723 | 6.33e-06 | 8.92e-05 | 74 |
| GO:00718974 | Stomach | CAG with IM | DNA biosynthetic process | 19/1050 | 180/18723 | 6.02e-03 | 4.63e-02 | 19 |
| GO:007189711 | Stomach | CSG | DNA biosynthetic process | 19/1034 | 180/18723 | 5.12e-03 | 4.17e-02 | 19 |
| Page: 1 2 |
| Pathway ID | Tissue | Disease Stage | Description | Gene Ratio | Bg Ratio | pvalue | p.adjust | qvalue | Count |
| hsa0342022 | Esophagus | ESCC | Nucleotide excision repair | 54/4205 | 63/8465 | 2.01e-09 | 2.17e-08 | 1.11e-08 | 54 |
| hsa034104 | Esophagus | ESCC | Base excision repair | 38/4205 | 44/8465 | 3.59e-07 | 2.62e-06 | 1.34e-06 | 38 |
| hsa030304 | Esophagus | ESCC | DNA replication | 32/4205 | 36/8465 | 7.71e-07 | 5.06e-06 | 2.59e-06 | 32 |
| hsa034304 | Esophagus | ESCC | Mismatch repair | 21/4205 | 23/8465 | 2.85e-05 | 1.35e-04 | 6.90e-05 | 21 |
| hsa0342032 | Esophagus | ESCC | Nucleotide excision repair | 54/4205 | 63/8465 | 2.01e-09 | 2.17e-08 | 1.11e-08 | 54 |
| hsa0341011 | Esophagus | ESCC | Base excision repair | 38/4205 | 44/8465 | 3.59e-07 | 2.62e-06 | 1.34e-06 | 38 |
| hsa0303011 | Esophagus | ESCC | DNA replication | 32/4205 | 36/8465 | 7.71e-07 | 5.06e-06 | 2.59e-06 | 32 |
| hsa0343011 | Esophagus | ESCC | Mismatch repair | 21/4205 | 23/8465 | 2.85e-05 | 1.35e-04 | 6.90e-05 | 21 |
| hsa03420 | Liver | Cirrhotic | Nucleotide excision repair | 29/2530 | 63/8465 | 4.81e-03 | 1.74e-02 | 1.07e-02 | 29 |
| hsa034201 | Liver | Cirrhotic | Nucleotide excision repair | 29/2530 | 63/8465 | 4.81e-03 | 1.74e-02 | 1.07e-02 | 29 |
| hsa034204 | Oral cavity | OSCC | Nucleotide excision repair | 49/3704 | 63/8465 | 3.48e-08 | 2.91e-07 | 1.48e-07 | 49 |
| hsa03030 | Oral cavity | OSCC | DNA replication | 31/3704 | 36/8465 | 1.70e-07 | 1.19e-06 | 6.03e-07 | 31 |
| hsa0342011 | Oral cavity | OSCC | Nucleotide excision repair | 49/3704 | 63/8465 | 3.48e-08 | 2.91e-07 | 1.48e-07 | 49 |
| hsa030301 | Oral cavity | OSCC | DNA replication | 31/3704 | 36/8465 | 1.70e-07 | 1.19e-06 | 6.03e-07 | 31 |
| hsa0342021 | Oral cavity | LP | Nucleotide excision repair | 37/2418 | 63/8465 | 5.14e-07 | 6.33e-06 | 4.08e-06 | 37 |
| hsa030302 | Oral cavity | LP | DNA replication | 23/2418 | 36/8465 | 1.08e-05 | 7.79e-05 | 5.02e-05 | 23 |
| hsa034102 | Oral cavity | LP | Base excision repair | 23/2418 | 44/8465 | 7.66e-04 | 3.75e-03 | 2.42e-03 | 23 |
| hsa034302 | Oral cavity | LP | Mismatch repair | 12/2418 | 23/8465 | 1.43e-02 | 4.59e-02 | 2.96e-02 | 12 |
| hsa0342031 | Oral cavity | LP | Nucleotide excision repair | 37/2418 | 63/8465 | 5.14e-07 | 6.33e-06 | 4.08e-06 | 37 |
| hsa030303 | Oral cavity | LP | DNA replication | 23/2418 | 36/8465 | 1.08e-05 | 7.79e-05 | 5.02e-05 | 23 |
| Page: 1 2 |
Top |
Cell-cell communication analysis |
| Identification of potential cell-cell interactions between two cell types and their ligand-receptor pairs for different disease states |
| Ligand | Receptor | LRpair | Pathway | Tissue | Disease Stage |
| Page: 1 |
Top |
Single-cell gene regulatory network inference analysis |
| Find out the significant the regulons (TFs) and the target genes of each regulon across cell types for different disease states |
| TF | Cell Type | Tissue | Disease Stage | Target Gene | RSS | Regulon Activity |
| ∗The dot plots of a searched regulon are shown for all cell subpopulations in each disease state of each tissue based on the regulon specific score inferred using pySCENIC and by calculating the average expression. |
| Page: 1 |
Top |
Somatic mutation of malignant transformation related genes |
| Annotation of somatic variants for genes involved in malignant transformation |
| Hugo Symbol | Variant Class | Variant Classification | dbSNP RS | HGVSc | HGVSp | HGVSp Short | SWISSPROT | BIOTYPE | SIFT | PolyPhen | Tumor Sample Barcode | Tissue | Histology | Sex | Age | Stage | Therapy Types | Drugs | Outcome |
| POLD4 | SNV | Missense_Mutation | rs140664272 | c.313N>C | p.Tyr105His | p.Y105H | Q9HCU8 | protein_coding | deleterious(0.02) | probably_damaging(0.987) | TCGA-A1-A0SO-01 | Breast | breast invasive carcinoma | Female | >=65 | I/II | Chemotherapy | SD | |
| POLD4 | SNV | Missense_Mutation | rs750048961 | c.214N>T | p.Arg72Trp | p.R72W | Q9HCU8 | protein_coding | deleterious(0) | probably_damaging(0.999) | TCGA-2W-A8YY-01 | Cervix | cervical & endocervical cancer | Female | <65 | I/II | Chemotherapy | cisplatin | CR |
| POLD4 | SNV | Missense_Mutation | c.294N>T | p.Gln98His | p.Q98H | Q9HCU8 | protein_coding | deleterious(0.01) | probably_damaging(0.996) | TCGA-AP-A059-01 | Endometrium | uterine corpus endometrioid carcinoma | Female | >=65 | I/II | Unknown | Unknown | SD | |
| POLD4 | SNV | Missense_Mutation | c.225G>C | p.Gln75His | p.Q75H | Q9HCU8 | protein_coding | tolerated(0.56) | benign(0.014) | TCGA-78-7536-01 | Lung | lung adenocarcinoma | Male | >=65 | III/IV | Unknown | Unknown | PD |
| Page: 1 |
Top |
Related drugs of malignant transformation related genes |
| Identification of chemicals and drugs interact with genes involved in malignant transfromation |
| (DGIdb 4.0) |
| Entrez ID | Symbol | Category | Interaction Types | Drug Claim Name | Drug Name | PMIDs |
| Page: 1 |

Copyright 2023-Present -The University of Texas Health Science Center at Houston |