
|
|||||
|
 | |
| |
| |
| |
| |
| |
|
Gene: PLEKHG6 |
Gene summary for PLEKHG6 |
| Gene information | Species | Human | Gene symbol | PLEKHG6 | Gene ID | 55200 |
| Gene name | pleckstrin homology and RhoGEF domain containing G6 | |
| Gene Alias | MyoGEF | |
| Cytomap | 12p13.31 | |
| Gene Type | protein-coding | GO ID | GO:0007154 | UniProtAcc | Q3KR16 |
Top |
Malignant transformation analysis |
| Identification of the aberrant gene expression in precancerous and cancerous lesions by comparing the gene expression of stem-like cells in diseased tissues with normal stem cells |
| Entrez ID | Symbol | Replicates | Species | Organ | Tissue | Adj P-value | Log2FC | Malignancy |
| 55200 | PLEKHG6 | P36T-E | Human | Esophagus | ESCC | 5.56e-12 | 4.52e-01 | 0.1187 |
| 55200 | PLEKHG6 | P37T-E | Human | Esophagus | ESCC | 1.53e-02 | 5.81e-02 | 0.1371 |
| 55200 | PLEKHG6 | P39T-E | Human | Esophagus | ESCC | 2.55e-11 | 1.98e-01 | 0.0894 |
| 55200 | PLEKHG6 | P40T-E | Human | Esophagus | ESCC | 2.88e-12 | 4.12e-01 | 0.109 |
| 55200 | PLEKHG6 | P42T-E | Human | Esophagus | ESCC | 6.34e-03 | 1.14e-01 | 0.1175 |
| 55200 | PLEKHG6 | P47T-E | Human | Esophagus | ESCC | 3.22e-11 | 2.44e-01 | 0.1067 |
| 55200 | PLEKHG6 | P48T-E | Human | Esophagus | ESCC | 5.10e-13 | 2.14e-01 | 0.0959 |
| 55200 | PLEKHG6 | P49T-E | Human | Esophagus | ESCC | 1.24e-10 | 5.69e-01 | 0.1768 |
| 55200 | PLEKHG6 | P52T-E | Human | Esophagus | ESCC | 4.67e-07 | 2.04e-01 | 0.1555 |
| 55200 | PLEKHG6 | P54T-E | Human | Esophagus | ESCC | 9.50e-23 | 4.27e-01 | 0.0975 |
| 55200 | PLEKHG6 | P56T-E | Human | Esophagus | ESCC | 1.50e-03 | 3.04e-01 | 0.1613 |
| 55200 | PLEKHG6 | P57T-E | Human | Esophagus | ESCC | 6.60e-12 | 2.31e-01 | 0.0926 |
| 55200 | PLEKHG6 | P61T-E | Human | Esophagus | ESCC | 7.59e-13 | 2.57e-01 | 0.099 |
| 55200 | PLEKHG6 | P62T-E | Human | Esophagus | ESCC | 1.61e-04 | 1.22e-01 | 0.1302 |
| 55200 | PLEKHG6 | P65T-E | Human | Esophagus | ESCC | 8.01e-04 | 1.06e-01 | 0.0978 |
| 55200 | PLEKHG6 | P74T-E | Human | Esophagus | ESCC | 4.96e-08 | 1.80e-01 | 0.1479 |
| 55200 | PLEKHG6 | P76T-E | Human | Esophagus | ESCC | 3.55e-02 | 1.21e-01 | 0.1207 |
| 55200 | PLEKHG6 | P79T-E | Human | Esophagus | ESCC | 8.94e-03 | 7.74e-02 | 0.1154 |
| 55200 | PLEKHG6 | P82T-E | Human | Esophagus | ESCC | 1.19e-12 | 5.63e-01 | 0.1072 |
| 55200 | PLEKHG6 | P83T-E | Human | Esophagus | ESCC | 2.20e-03 | 1.47e-01 | 0.1738 |
| Page: 1 2 3 |
| Tissue | Expression Dynamics | Abbreviation |
| Esophagus |  | ESCC: Esophageal squamous cell carcinoma |
| HGIN: High-grade intraepithelial neoplasias | ||
| LGIN: Low-grade intraepithelial neoplasias | ||
| Oral Cavity | 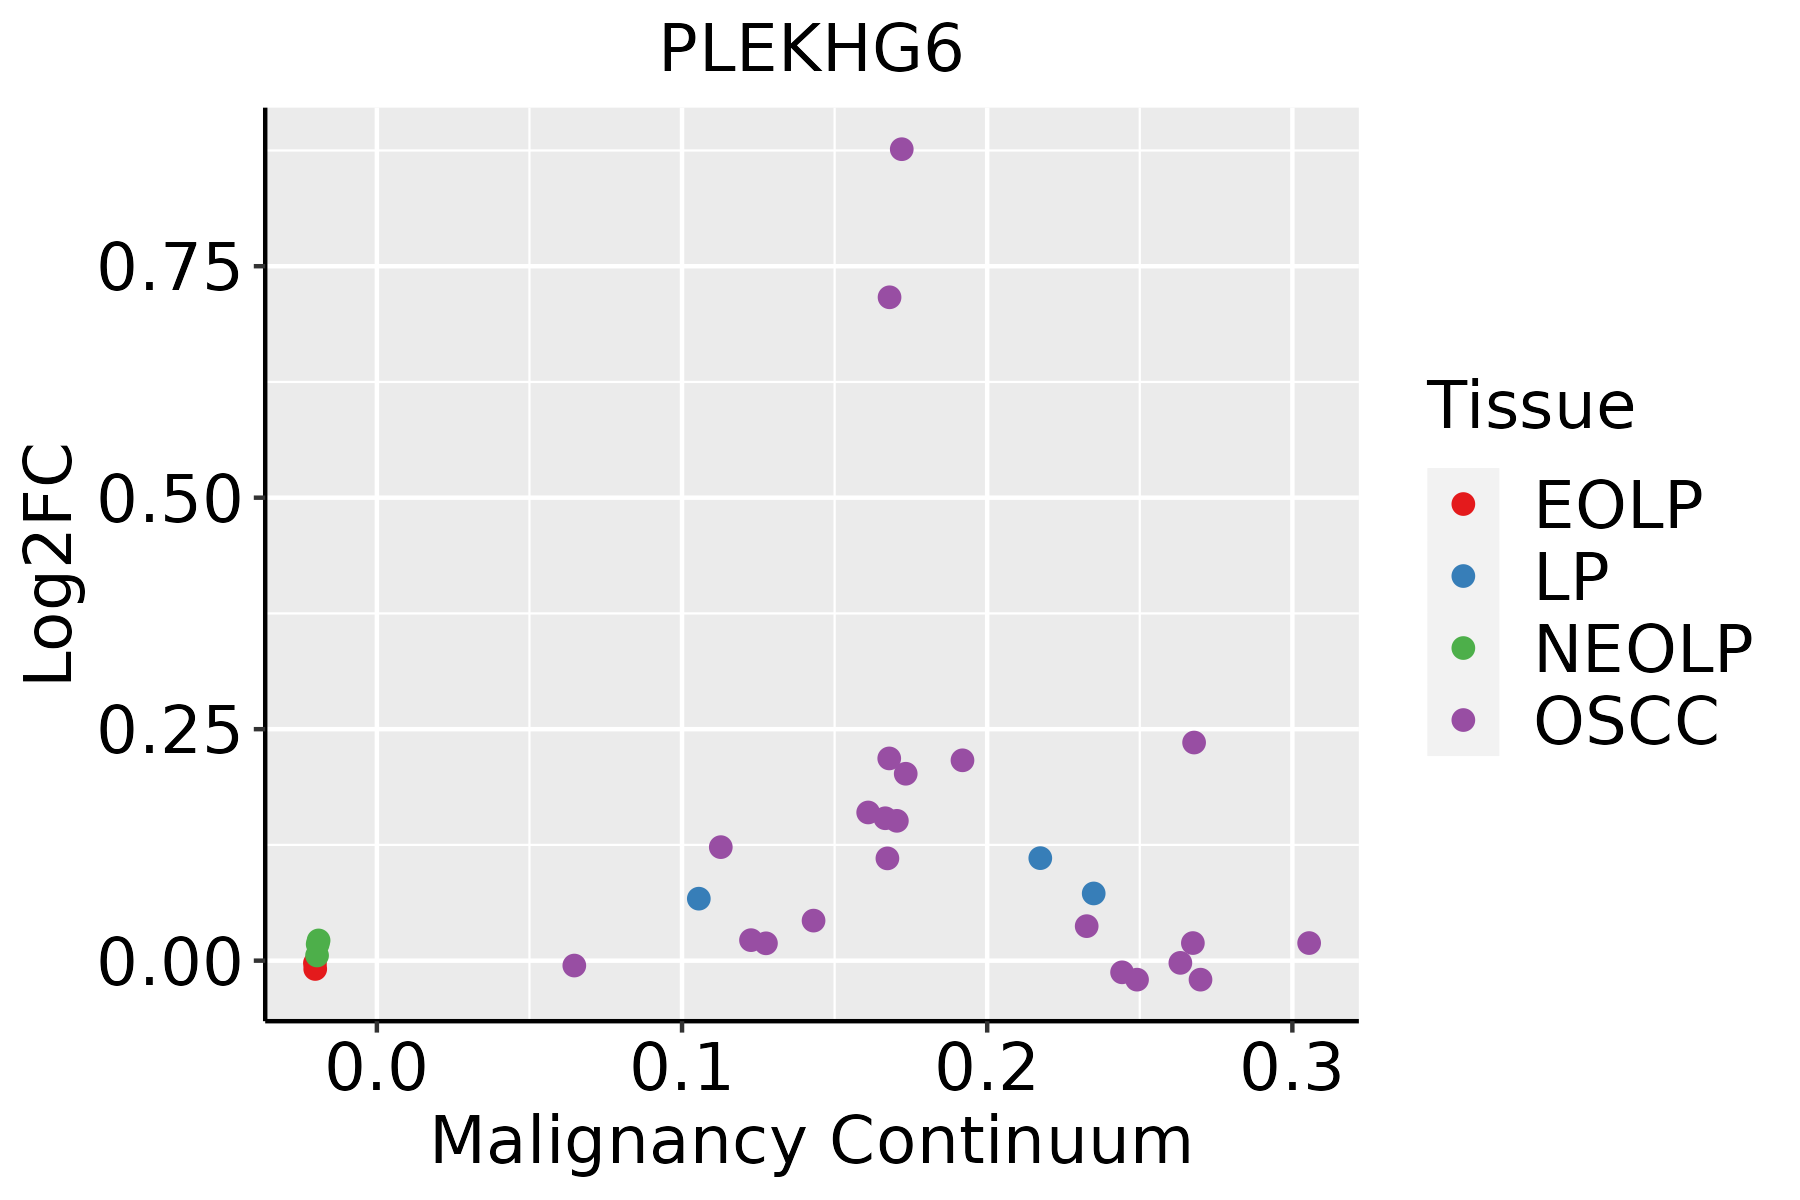 | EOLP: Erosive Oral lichen planus |
| LP: leukoplakia | ||
| NEOLP: Non-erosive oral lichen planus | ||
| OSCC: Oral squamous cell carcinoma |
| ∗log2FC in expression of this searched gene in stem-like cells from each diseased tissue sample relative to stem-like cells in normal samples in each tissue plotted against the malignancy continuum. Samples are colored based on if they are from different disease stage. |
Top |
Malignant transformation related pathway analysis |
| Find out the enriched GO biological processes and KEGG pathways involved in transition from healthy to precancer to cancer |
| Tissue | Disease Stage | Enriched GO biological Processes |
| Colorectum | AD |  |
| Colorectum | SER |  |
| Colorectum | MSS |  |
| Colorectum | MSI-H |  |
| Colorectum | FAP |  |
| ∗Top 15 enriched GO BP terms are showed in the bar plot of each disease state in each tissue. Each row represents a significant GO biological process which is colored according to the -log10(p.adjust). |
| Page: 1 2 3 4 5 6 7 8 9 |
| GO ID | Tissue | Disease Stage | Description | Gene Ratio | Bg Ratio | pvalue | p.adjust | Count |
| GO:005105610 | Esophagus | ESCC | regulation of small GTPase mediated signal transduction | 157/8552 | 302/18723 | 1.55e-02 | 4.98e-02 | 157 |
| Page: 1 |
| Pathway ID | Tissue | Disease Stage | Description | Gene Ratio | Bg Ratio | pvalue | p.adjust | qvalue | Count |
| Page: 1 |
Top |
Cell-cell communication analysis |
| Identification of potential cell-cell interactions between two cell types and their ligand-receptor pairs for different disease states |
| Ligand | Receptor | LRpair | Pathway | Tissue | Disease Stage |
| Page: 1 |
Top |
Single-cell gene regulatory network inference analysis |
| Find out the significant the regulons (TFs) and the target genes of each regulon across cell types for different disease states |
| TF | Cell Type | Tissue | Disease Stage | Target Gene | RSS | Regulon Activity |
| ∗The dot plots of a searched regulon are shown for all cell subpopulations in each disease state of each tissue based on the regulon specific score inferred using pySCENIC and by calculating the average expression. |
| Page: 1 |
Top |
Somatic mutation of malignant transformation related genes |
| Annotation of somatic variants for genes involved in malignant transformation |
| Hugo Symbol | Variant Class | Variant Classification | dbSNP RS | HGVSc | HGVSp | HGVSp Short | SWISSPROT | BIOTYPE | SIFT | PolyPhen | Tumor Sample Barcode | Tissue | Histology | Sex | Age | Stage | Therapy Types | Drugs | Outcome |
| PLEKHG6 | SNV | Missense_Mutation | c.2300N>C | p.Arg767Pro | p.R767P | Q3KR16 | protein_coding | deleterious_low_confidence(0.01) | benign(0.204) | TCGA-A2-A04T-01 | Breast | breast invasive carcinoma | Female | <65 | I/II | Chemotherapy | cyclophosphamide | SD | |
| PLEKHG6 | SNV | Missense_Mutation | c.1729N>A | p.Asp577Asn | p.D577N | Q3KR16 | protein_coding | deleterious(0.01) | probably_damaging(0.994) | TCGA-A8-A094-01 | Breast | breast invasive carcinoma | Female | >=65 | I/II | Unknown | Unknown | SD | |
| PLEKHG6 | SNV | Missense_Mutation | rs761204546 | c.1853N>A | p.Arg618His | p.R618H | Q3KR16 | protein_coding | deleterious_low_confidence(0) | possibly_damaging(0.765) | TCGA-AC-A8OP-01 | Breast | breast invasive carcinoma | Female | >=65 | I/II | Unknown | Unknown | SD |
| PLEKHG6 | SNV | Missense_Mutation | rs147609266 | c.1187N>T | p.Thr396Met | p.T396M | Q3KR16 | protein_coding | tolerated(0.52) | benign(0.006) | TCGA-LD-A7W6-01 | Breast | breast invasive carcinoma | Female | <65 | I/II | Chemotherapy | letrozole | SD |
| PLEKHG6 | insertion | Frame_Shift_Ins | novel | c.1615_1616insAATATCTGGTTCATGGG | p.Ser539LysfsTer38 | p.S539Kfs*38 | Q3KR16 | protein_coding | TCGA-A8-A092-01 | Breast | breast invasive carcinoma | Female | <65 | III/IV | Chemotherapy | paclitaxel | CR | ||
| PLEKHG6 | SNV | Missense_Mutation | c.243G>C | p.Lys81Asn | p.K81N | Q3KR16 | protein_coding | deleterious(0.04) | benign(0.31) | TCGA-C5-A7CO-01 | Cervix | cervical & endocervical cancer | Female | >=65 | I/II | Chemotherapy | cisplatin | SD | |
| PLEKHG6 | SNV | Missense_Mutation | novel | c.650G>A | p.Arg217Gln | p.R217Q | Q3KR16 | protein_coding | tolerated(0.15) | probably_damaging(0.973) | TCGA-EA-A3HU-01 | Cervix | cervical & endocervical cancer | Female | <65 | I/II | Unknown | Unknown | SD |
| PLEKHG6 | deletion | Frame_Shift_Del | novel | c.1907_1910delNNNN | p.Asp637ProfsTer17 | p.D637Pfs*17 | Q3KR16 | protein_coding | TCGA-DS-A1OA-01 | Cervix | cervical & endocervical cancer | Female | >=65 | I/II | Chemotherapy | carboplatin | PD | ||
| PLEKHG6 | SNV | Missense_Mutation | c.463A>G | p.Met155Val | p.M155V | Q3KR16 | protein_coding | deleterious(0.01) | probably_damaging(0.914) | TCGA-A6-5667-01 | Colorectum | colon adenocarcinoma | Female | <65 | III/IV | Chemotherapy | oxaliplatin | SD | |
| PLEKHG6 | SNV | Missense_Mutation | rs370357030 | c.424N>A | p.Glu142Lys | p.E142K | Q3KR16 | protein_coding | deleterious(0) | probably_damaging(0.986) | TCGA-AA-3877-01 | Colorectum | colon adenocarcinoma | Female | >=65 | I/II | Unknown | Unknown | SD |
| Page: 1 2 3 4 5 6 7 |
Top |
Related drugs of malignant transformation related genes |
| Identification of chemicals and drugs interact with genes involved in malignant transfromation |
| (DGIdb 4.0) |
| Entrez ID | Symbol | Category | Interaction Types | Drug Claim Name | Drug Name | PMIDs |
| Page: 1 |

Copyright 2023-Present -The University of Texas Health Science Center at Houston |