
|
|||||
|
 | |
| |
| |
| |
| |
| |
|
Gene: PLEKHB1 |
Gene summary for PLEKHB1 |
| Gene information | Species | Human | Gene symbol | PLEKHB1 | Gene ID | 58473 |
| Gene name | pleckstrin homology domain containing B1 | |
| Gene Alias | KPL1 | |
| Cytomap | 11q13.4 | |
| Gene Type | protein-coding | GO ID | GO:0007154 | UniProtAcc | A0A024R5J2 |
Top |
Malignant transformation analysis |
| Identification of the aberrant gene expression in precancerous and cancerous lesions by comparing the gene expression of stem-like cells in diseased tissues with normal stem cells |
| Entrez ID | Symbol | Replicates | Species | Organ | Tissue | Adj P-value | Log2FC | Malignancy |
| 58473 | PLEKHB1 | P57T-E | Human | Esophagus | ESCC | 9.48e-17 | 3.30e-01 | 0.0926 |
| 58473 | PLEKHB1 | P76T-E | Human | Esophagus | ESCC | 9.08e-32 | 9.52e-01 | 0.1207 |
| 58473 | PLEKHB1 | P82T-E | Human | Esophagus | ESCC | 3.13e-02 | 3.85e-01 | 0.1072 |
| 58473 | PLEKHB1 | P128T-E | Human | Esophagus | ESCC | 1.15e-16 | 7.45e-01 | 0.1241 |
| 58473 | PLEKHB1 | P130T-E | Human | Esophagus | ESCC | 1.73e-05 | -2.19e-02 | 0.1676 |
| 58473 | PLEKHB1 | S43 | Human | Liver | Cirrhotic | 6.86e-05 | -2.02e-01 | -0.0187 |
| 58473 | PLEKHB1 | HCC1_Meng | Human | Liver | HCC | 2.26e-23 | -1.27e-01 | 0.0246 |
| 58473 | PLEKHB1 | HCC2_Meng | Human | Liver | HCC | 7.43e-14 | -2.77e-02 | 0.0107 |
| 58473 | PLEKHB1 | cirrhotic1 | Human | Liver | Cirrhotic | 1.48e-13 | 2.63e-01 | 0.0202 |
| 58473 | PLEKHB1 | cirrhotic2 | Human | Liver | Cirrhotic | 5.46e-04 | 1.33e-01 | 0.0201 |
| 58473 | PLEKHB1 | HCC1 | Human | Liver | HCC | 5.01e-05 | -9.68e-02 | 0.5336 |
| 58473 | PLEKHB1 | Pt13.a | Human | Liver | HCC | 1.08e-07 | -2.09e-01 | 0.021 |
| 58473 | PLEKHB1 | Pt13.b | Human | Liver | HCC | 3.70e-04 | -2.14e-01 | 0.0251 |
| 58473 | PLEKHB1 | Pt14.d | Human | Liver | HCC | 3.02e-03 | -2.10e-01 | 0.0143 |
| 58473 | PLEKHB1 | S014 | Human | Liver | HCC | 5.29e-15 | 8.23e-01 | 0.2254 |
| 58473 | PLEKHB1 | S015 | Human | Liver | HCC | 1.17e-08 | 9.24e-01 | 0.2375 |
| 58473 | PLEKHB1 | S016 | Human | Liver | HCC | 1.28e-11 | 7.80e-01 | 0.2243 |
| Page: 1 2 |
| Tissue | Expression Dynamics | Abbreviation |
| Colorectum (GSE201348) |  | FAP: Familial adenomatous polyposis |
| CRC: Colorectal cancer | ||
| Colorectum (HTA11) | 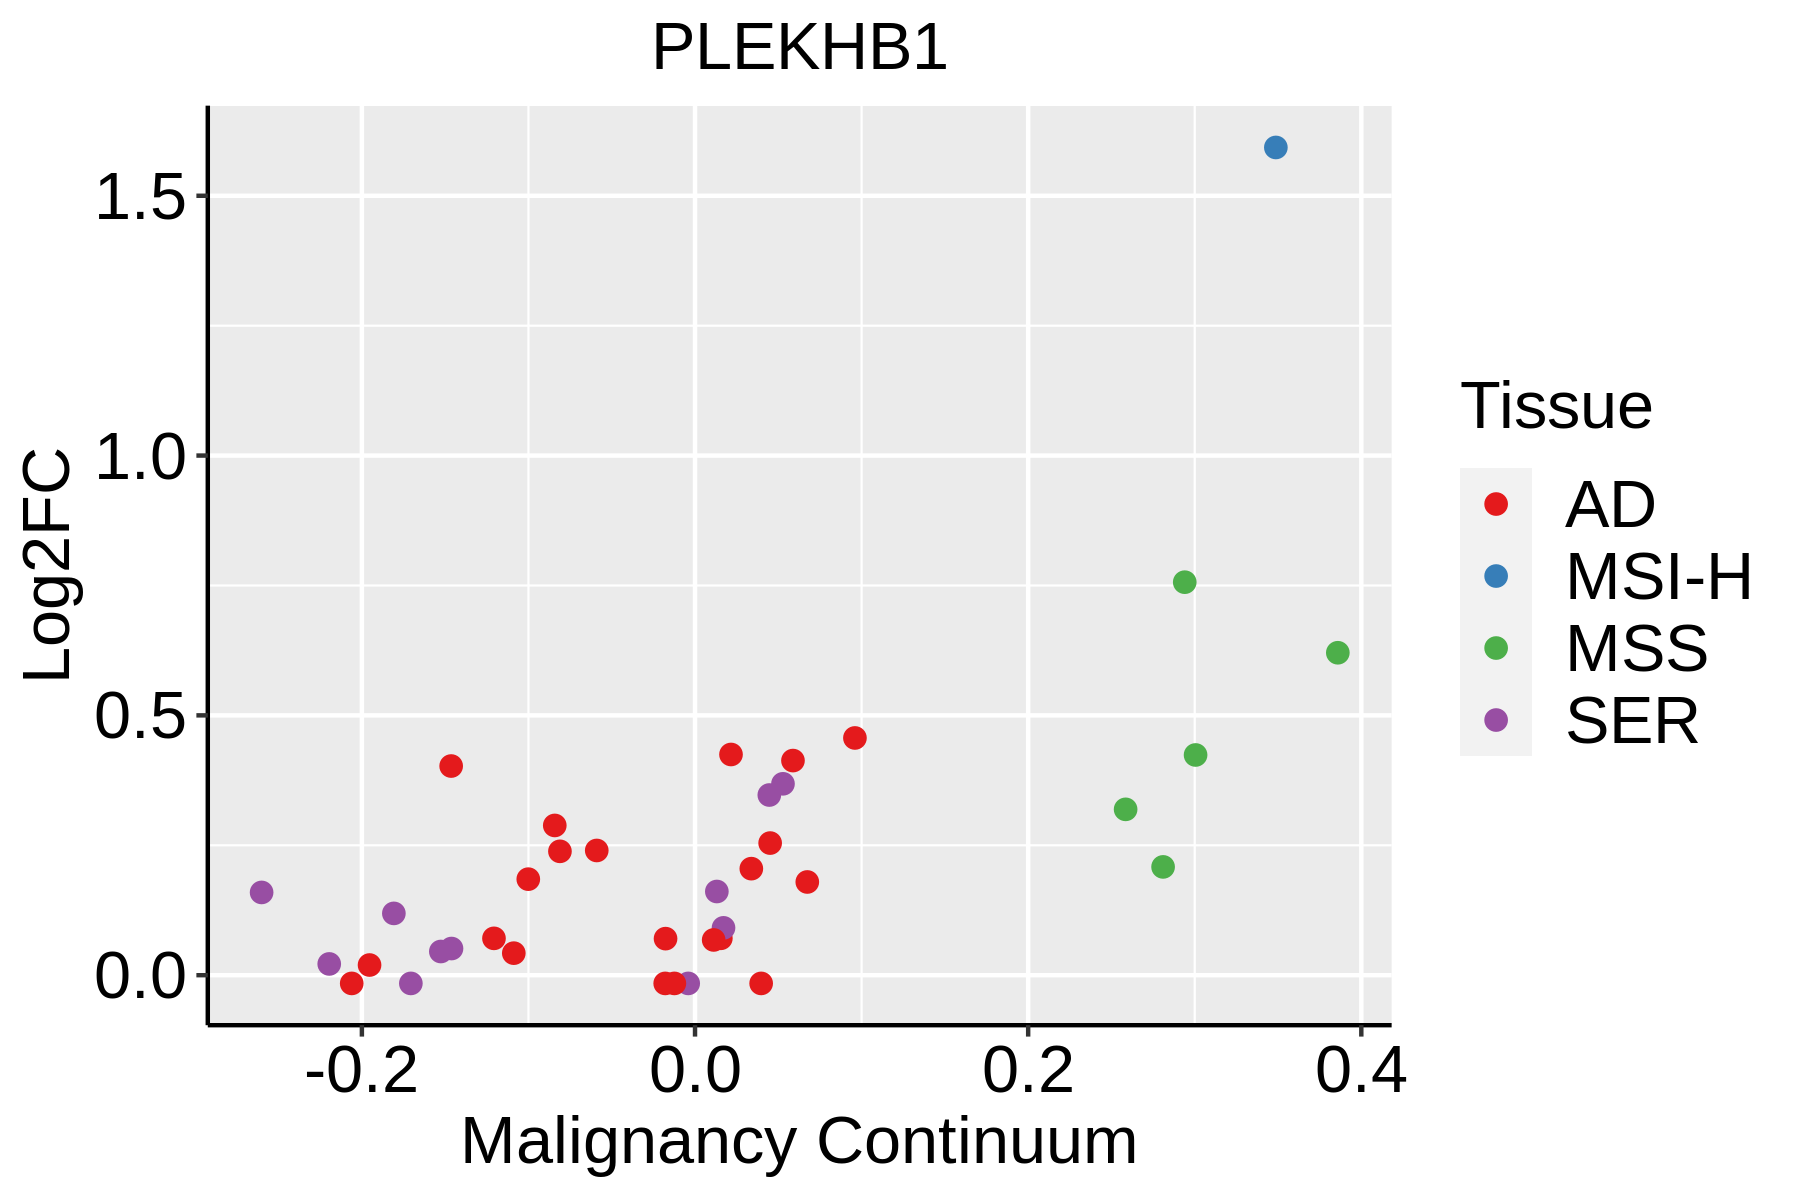 | AD: Adenomas |
| SER: Sessile serrated lesions | ||
| MSI-H: Microsatellite-high colorectal cancer | ||
| MSS: Microsatellite stable colorectal cancer | ||
| Esophagus | 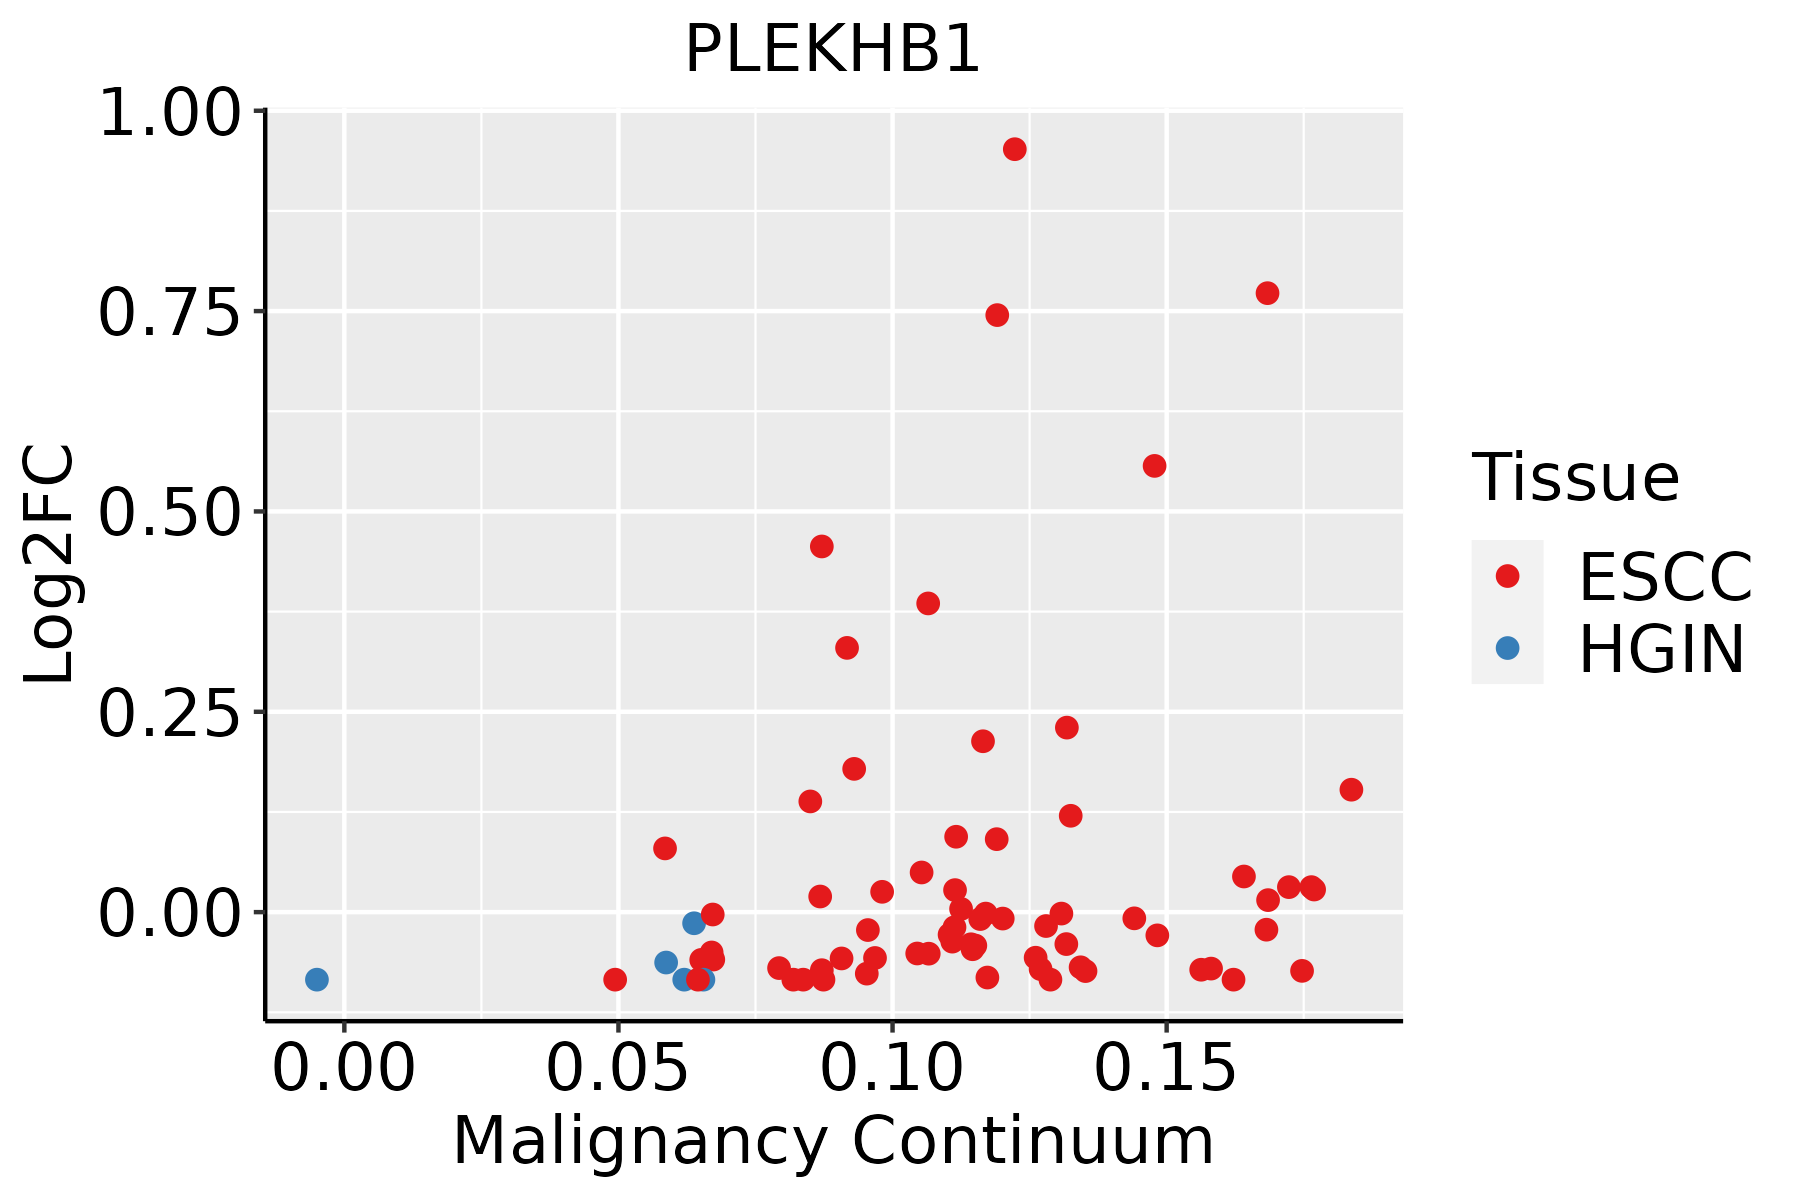 | ESCC: Esophageal squamous cell carcinoma |
| HGIN: High-grade intraepithelial neoplasias | ||
| LGIN: Low-grade intraepithelial neoplasias | ||
| Liver | 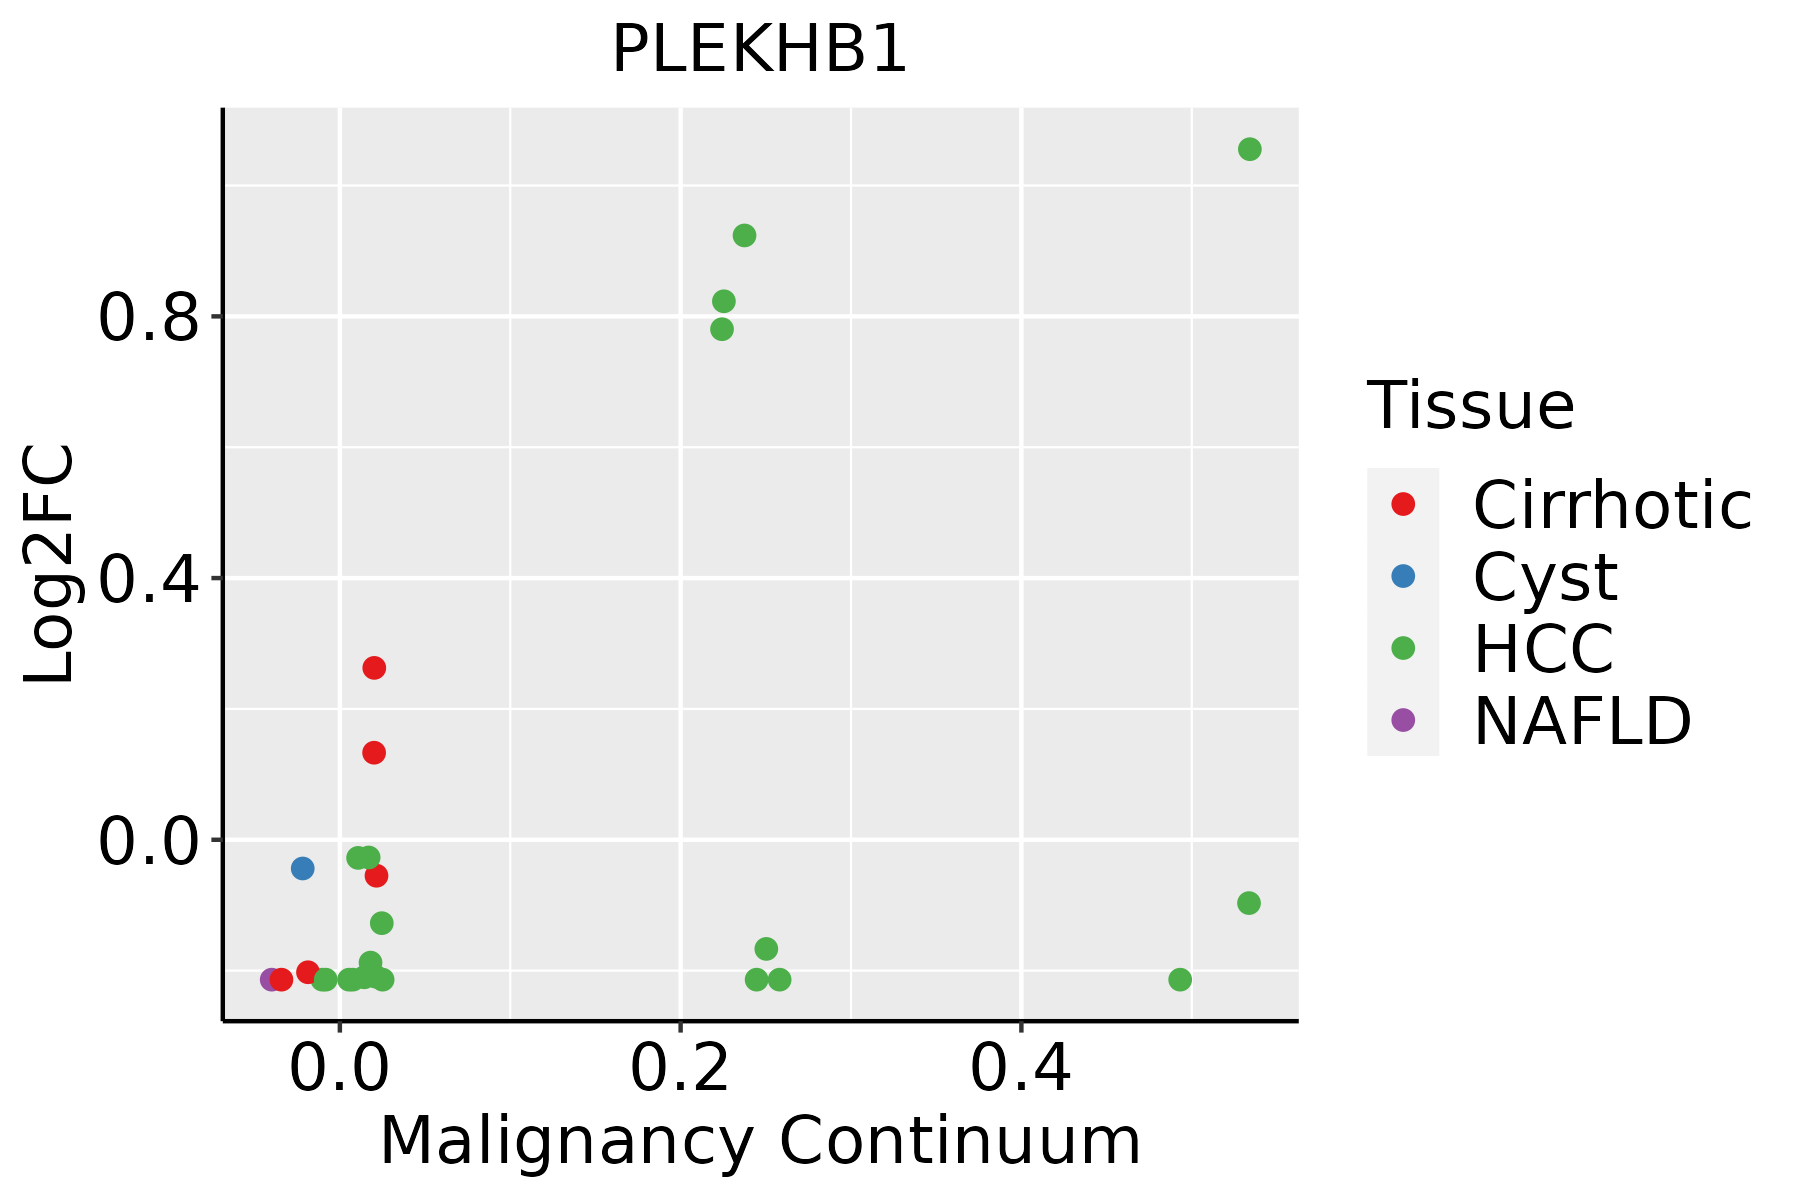 | HCC: Hepatocellular carcinoma |
| NAFLD: Non-alcoholic fatty liver disease |
| ∗log2FC in expression of this searched gene in stem-like cells from each diseased tissue sample relative to stem-like cells in normal samples in each tissue plotted against the malignancy continuum. Samples are colored based on if they are from different disease stage. |
Top |
Malignant transformation related pathway analysis |
| Find out the enriched GO biological processes and KEGG pathways involved in transition from healthy to precancer to cancer |
| Tissue | Disease Stage | Enriched GO biological Processes |
| Colorectum | AD |  |
| Colorectum | SER |  |
| Colorectum | MSS |  |
| Colorectum | MSI-H |  |
| Colorectum | FAP |  |
| ∗Top 15 enriched GO BP terms are showed in the bar plot of each disease state in each tissue. Each row represents a significant GO biological process which is colored according to the -log10(p.adjust). |
| Page: 1 2 3 4 5 6 7 8 9 |
| GO ID | Tissue | Disease Stage | Description | Gene Ratio | Bg Ratio | pvalue | p.adjust | Count |
| GO:000931419 | Esophagus | ESCC | response to radiation | 277/8552 | 456/18723 | 4.42e-11 | 1.43e-09 | 277 |
| GO:000941611 | Esophagus | ESCC | response to light stimulus | 183/8552 | 320/18723 | 2.03e-05 | 1.76e-04 | 183 |
| GO:00093146 | Liver | HCC | response to radiation | 223/7958 | 456/18723 | 3.08e-03 | 1.43e-02 | 223 |
| Page: 1 |
| Pathway ID | Tissue | Disease Stage | Description | Gene Ratio | Bg Ratio | pvalue | p.adjust | qvalue | Count |
| Page: 1 |
Top |
Cell-cell communication analysis |
| Identification of potential cell-cell interactions between two cell types and their ligand-receptor pairs for different disease states |
| Ligand | Receptor | LRpair | Pathway | Tissue | Disease Stage |
| Page: 1 |
Top |
Single-cell gene regulatory network inference analysis |
| Find out the significant the regulons (TFs) and the target genes of each regulon across cell types for different disease states |
| TF | Cell Type | Tissue | Disease Stage | Target Gene | RSS | Regulon Activity |
| ∗The dot plots of a searched regulon are shown for all cell subpopulations in each disease state of each tissue based on the regulon specific score inferred using pySCENIC and by calculating the average expression. |
| Page: 1 |
Top |
Somatic mutation of malignant transformation related genes |
| Annotation of somatic variants for genes involved in malignant transformation |
| Hugo Symbol | Variant Class | Variant Classification | dbSNP RS | HGVSc | HGVSp | HGVSp Short | SWISSPROT | BIOTYPE | SIFT | PolyPhen | Tumor Sample Barcode | Tissue | Histology | Sex | Age | Stage | Therapy Types | Drugs | Outcome |
| PLEKHB1 | SNV | Missense_Mutation | c.17C>G | p.Pro6Arg | p.P6R | Q9UF11 | protein_coding | deleterious_low_confidence(0.04) | probably_damaging(0.997) | TCGA-A8-A07R-01 | Breast | breast invasive carcinoma | Female | >=65 | III/IV | Ancillary | zoledronic | SD | |
| PLEKHB1 | SNV | Missense_Mutation | c.499N>T | p.Arg167Cys | p.R167C | Q9UF11 | protein_coding | tolerated(0.16) | benign(0.071) | TCGA-A6-5665-01 | Colorectum | colon adenocarcinoma | Female | >=65 | I/II | Unknown | Unknown | PD | |
| PLEKHB1 | SNV | Missense_Mutation | rs754703598 | c.458N>A | p.Arg153His | p.R153H | Q9UF11 | protein_coding | tolerated(0.07) | benign(0) | TCGA-AA-3821-01 | Colorectum | colon adenocarcinoma | Female | >=65 | I/II | Unknown | Unknown | SD |
| PLEKHB1 | SNV | Missense_Mutation | novel | c.605N>C | p.Val202Ala | p.V202A | Q9UF11 | protein_coding | tolerated(0.63) | possibly_damaging(0.848) | TCGA-AA-3845-01 | Colorectum | colon adenocarcinoma | Female | >=65 | I/II | Unknown | Unknown | PD |
| PLEKHB1 | SNV | Missense_Mutation | rs781576387 | c.409G>A | p.Val137Ile | p.V137I | Q9UF11 | protein_coding | tolerated(0.26) | benign(0) | TCGA-AA-3977-01 | Colorectum | colon adenocarcinoma | Male | >=65 | I/II | Unknown | Unknown | SD |
| PLEKHB1 | insertion | Frame_Shift_Ins | rs747647640 | c.537_538insC | p.Asn182GlnfsTer102 | p.N182Qfs*102 | Q9UF11 | protein_coding | TCGA-CK-5916-01 | Colorectum | colon adenocarcinoma | Female | >=65 | I/II | Unknown | Unknown | PD | ||
| PLEKHB1 | SNV | Missense_Mutation | rs781576387 | c.409N>A | p.Val137Ile | p.V137I | Q9UF11 | protein_coding | tolerated(0.26) | benign(0) | TCGA-A5-A0G2-01 | Endometrium | uterine corpus endometrioid carcinoma | Female | <65 | III/IV | Unknown | Unknown | SD |
| PLEKHB1 | SNV | Missense_Mutation | rs545480416 | c.110N>A | p.Arg37His | p.R37H | Q9UF11 | protein_coding | deleterious(0.02) | probably_damaging(0.99) | TCGA-AJ-A3EK-01 | Endometrium | uterine corpus endometrioid carcinoma | Female | <65 | I/II | Chemotherapy | carboplatin | CR |
| PLEKHB1 | SNV | Missense_Mutation | rs191182155 | c.428G>A | p.Arg143Gln | p.R143Q | Q9UF11 | protein_coding | tolerated(0.33) | benign(0.025) | TCGA-AP-A0LM-01 | Endometrium | uterine corpus endometrioid carcinoma | Female | <65 | III/IV | Chemotherapy | cisplatin | SD |
| PLEKHB1 | SNV | Missense_Mutation | rs766212784 | c.449N>A | p.Cys150Tyr | p.C150Y | Q9UF11 | protein_coding | tolerated(1) | benign(0.141) | TCGA-B5-A1MX-01 | Endometrium | uterine corpus endometrioid carcinoma | Female | <65 | I/II | Hormone Therapy | megace | SD |
| Page: 1 2 |
Top |
Related drugs of malignant transformation related genes |
| Identification of chemicals and drugs interact with genes involved in malignant transfromation |
| (DGIdb 4.0) |
| Entrez ID | Symbol | Category | Interaction Types | Drug Claim Name | Drug Name | PMIDs |
| Page: 1 |

Copyright 2023-Present -The University of Texas Health Science Center at Houston |