
|
|||||
|
 | |
| |
| |
| |
| |
| |
|
Gene: PHLDA3 |
Gene summary for PHLDA3 |
| Gene information | Species | Human | Gene symbol | PHLDA3 | Gene ID | 23612 |
| Gene name | pleckstrin homology like domain family A member 3 | |
| Gene Alias | TIH1 | |
| Cytomap | 1q32.1 | |
| Gene Type | protein-coding | GO ID | GO:0006915 | UniProtAcc | Q9Y5J5 |
Top |
Malignant transformation analysis |
| Identification of the aberrant gene expression in precancerous and cancerous lesions by comparing the gene expression of stem-like cells in diseased tissues with normal stem cells |
| Entrez ID | Symbol | Replicates | Species | Organ | Tissue | Adj P-value | Log2FC | Malignancy |
| 23612 | PHLDA3 | P21T-E | Human | Esophagus | ESCC | 9.96e-27 | 5.72e-01 | 0.1617 |
| 23612 | PHLDA3 | P22T-E | Human | Esophagus | ESCC | 1.07e-28 | 6.58e-01 | 0.1236 |
| 23612 | PHLDA3 | P23T-E | Human | Esophagus | ESCC | 9.96e-47 | 1.28e+00 | 0.108 |
| 23612 | PHLDA3 | P24T-E | Human | Esophagus | ESCC | 1.98e-25 | 7.73e-01 | 0.1287 |
| 23612 | PHLDA3 | P26T-E | Human | Esophagus | ESCC | 5.87e-38 | 8.49e-01 | 0.1276 |
| 23612 | PHLDA3 | P27T-E | Human | Esophagus | ESCC | 2.10e-13 | 5.24e-01 | 0.1055 |
| 23612 | PHLDA3 | P28T-E | Human | Esophagus | ESCC | 1.88e-27 | 6.68e-01 | 0.1149 |
| 23612 | PHLDA3 | P30T-E | Human | Esophagus | ESCC | 1.24e-23 | 7.36e-01 | 0.137 |
| 23612 | PHLDA3 | P31T-E | Human | Esophagus | ESCC | 5.22e-43 | 8.80e-01 | 0.1251 |
| 23612 | PHLDA3 | P32T-E | Human | Esophagus | ESCC | 1.43e-21 | 6.29e-01 | 0.1666 |
| 23612 | PHLDA3 | P36T-E | Human | Esophagus | ESCC | 1.94e-26 | 8.81e-01 | 0.1187 |
| 23612 | PHLDA3 | P37T-E | Human | Esophagus | ESCC | 9.32e-26 | 4.96e-01 | 0.1371 |
| 23612 | PHLDA3 | P38T-E | Human | Esophagus | ESCC | 3.82e-14 | 6.90e-01 | 0.127 |
| 23612 | PHLDA3 | P39T-E | Human | Esophagus | ESCC | 6.05e-20 | 3.64e-01 | 0.0894 |
| 23612 | PHLDA3 | P40T-E | Human | Esophagus | ESCC | 6.78e-22 | 7.52e-01 | 0.109 |
| 23612 | PHLDA3 | P42T-E | Human | Esophagus | ESCC | 1.66e-21 | 6.35e-01 | 0.1175 |
| 23612 | PHLDA3 | P44T-E | Human | Esophagus | ESCC | 4.23e-25 | 6.96e-01 | 0.1096 |
| 23612 | PHLDA3 | P47T-E | Human | Esophagus | ESCC | 2.14e-44 | 1.07e+00 | 0.1067 |
| 23612 | PHLDA3 | P48T-E | Human | Esophagus | ESCC | 4.28e-14 | 3.47e-01 | 0.0959 |
| 23612 | PHLDA3 | P49T-E | Human | Esophagus | ESCC | 5.06e-16 | 1.61e+00 | 0.1768 |
| Page: 1 2 3 4 5 6 7 |
| Tissue | Expression Dynamics | Abbreviation |
| Esophagus | 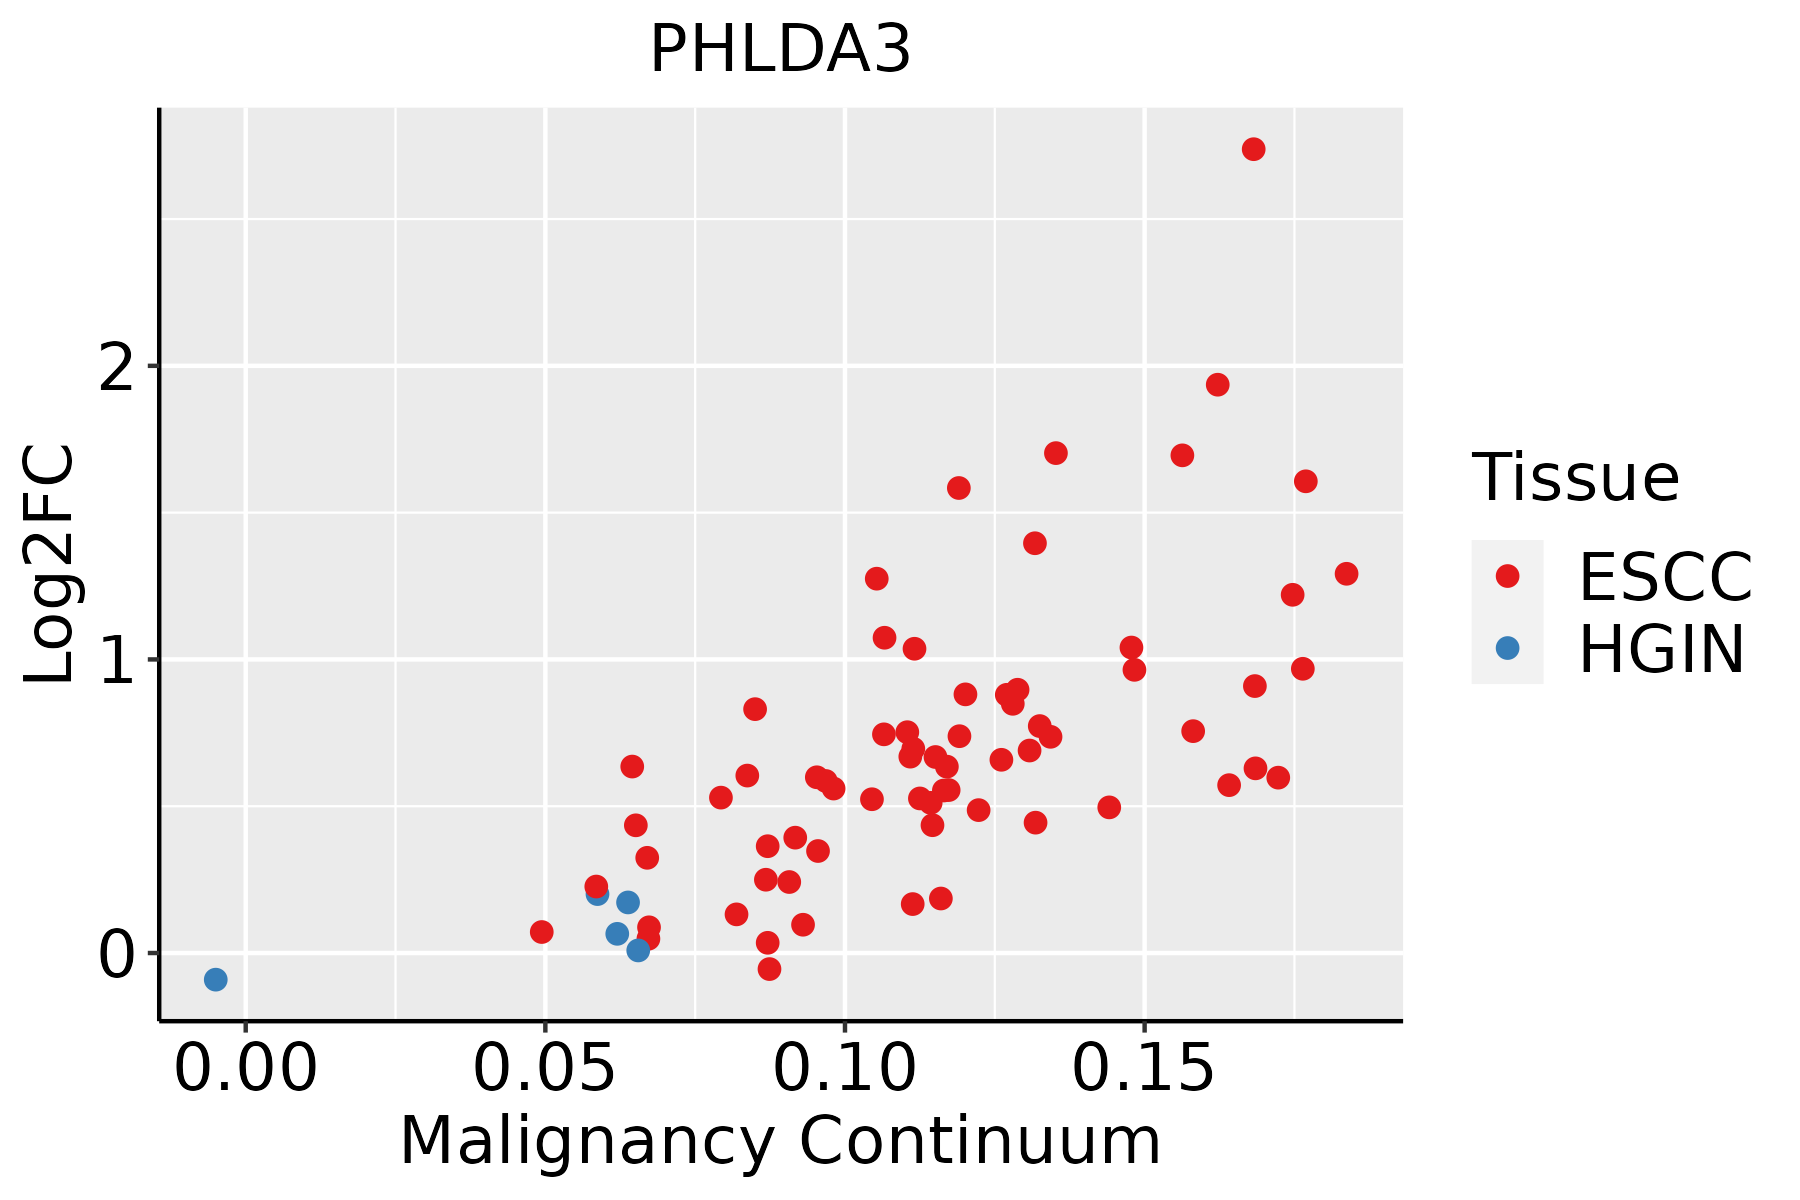 | ESCC: Esophageal squamous cell carcinoma |
| HGIN: High-grade intraepithelial neoplasias | ||
| LGIN: Low-grade intraepithelial neoplasias | ||
| Liver |  | HCC: Hepatocellular carcinoma |
| NAFLD: Non-alcoholic fatty liver disease | ||
| Oral Cavity |  | EOLP: Erosive Oral lichen planus |
| LP: leukoplakia | ||
| NEOLP: Non-erosive oral lichen planus | ||
| OSCC: Oral squamous cell carcinoma | ||
| Prostate |  | BPH: Benign Prostatic Hyperplasia |
| Skin | 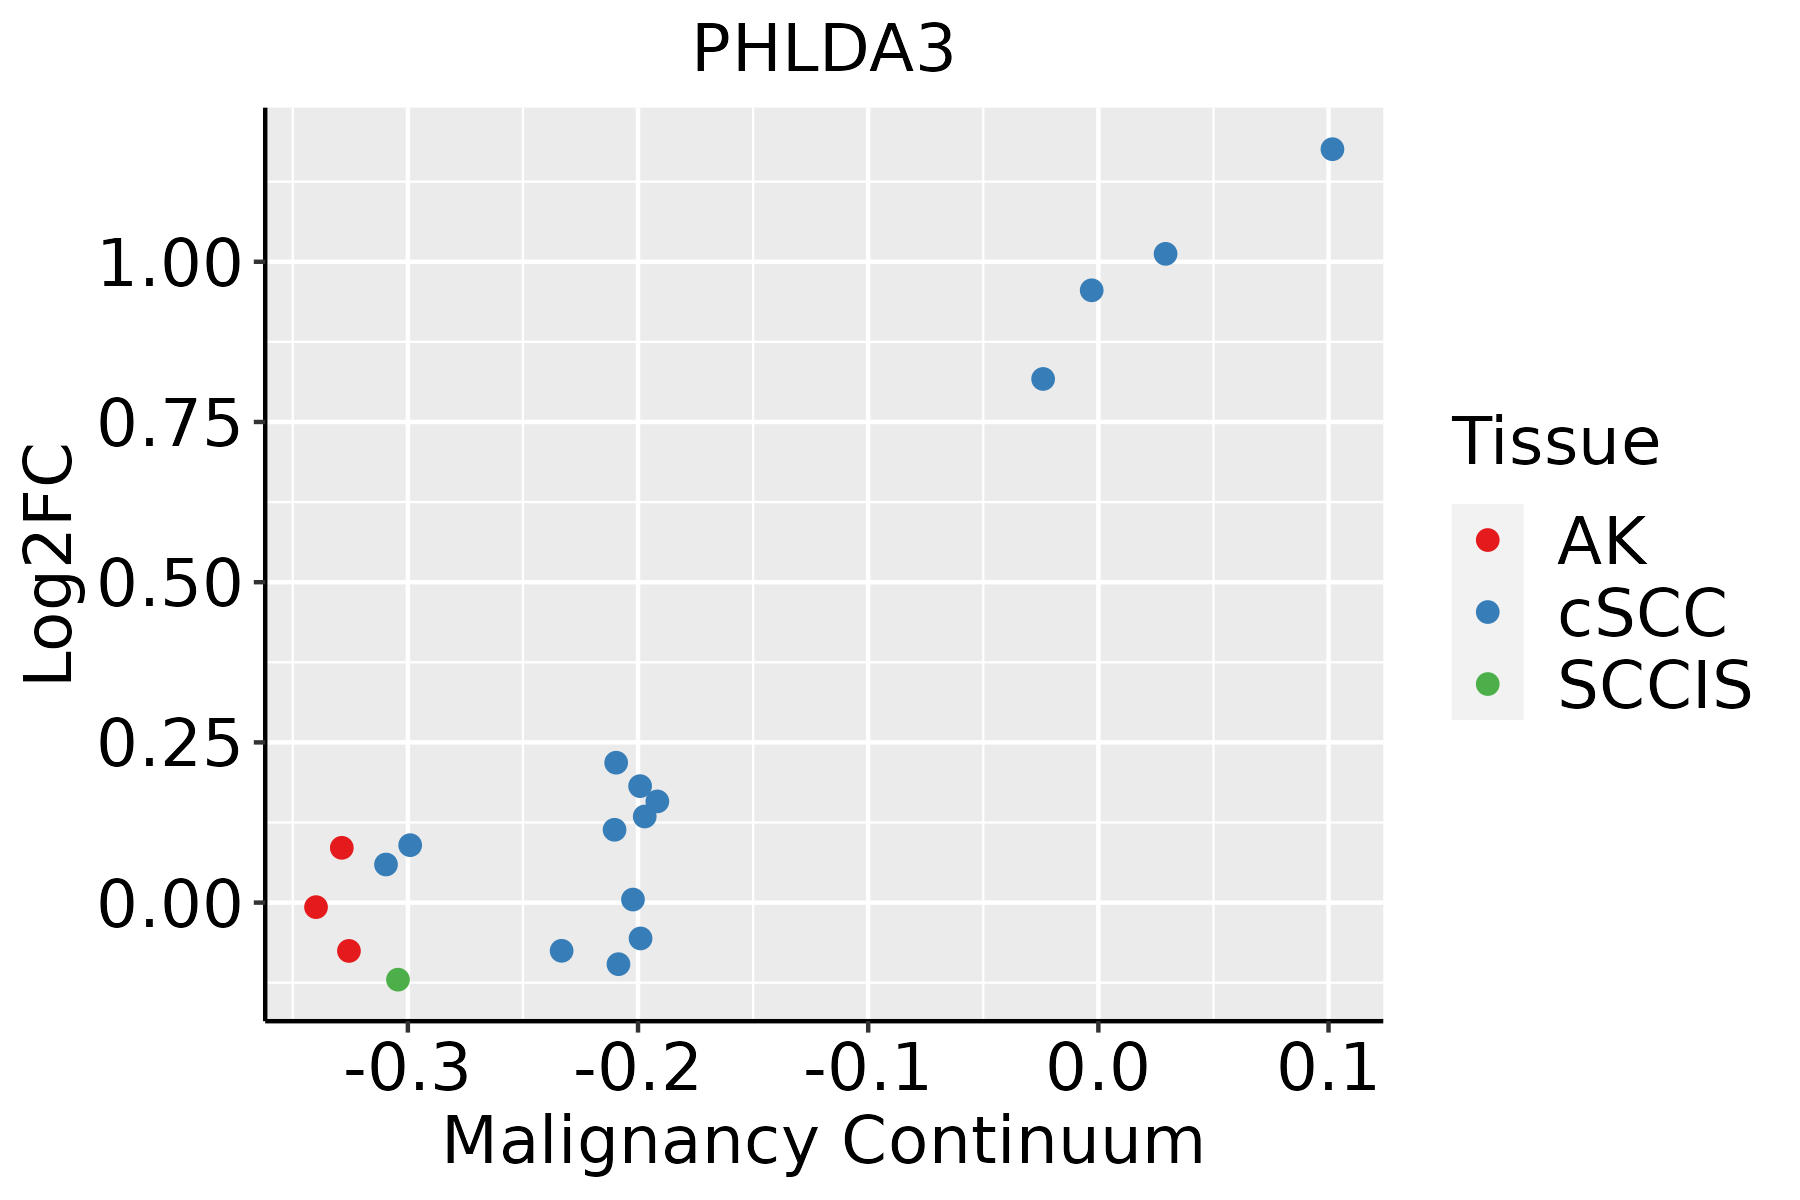 | AK: Actinic keratosis |
| cSCC: Cutaneous squamous cell carcinoma | ||
| SCCIS:squamous cell carcinoma in situ | ||
| Thyroid | 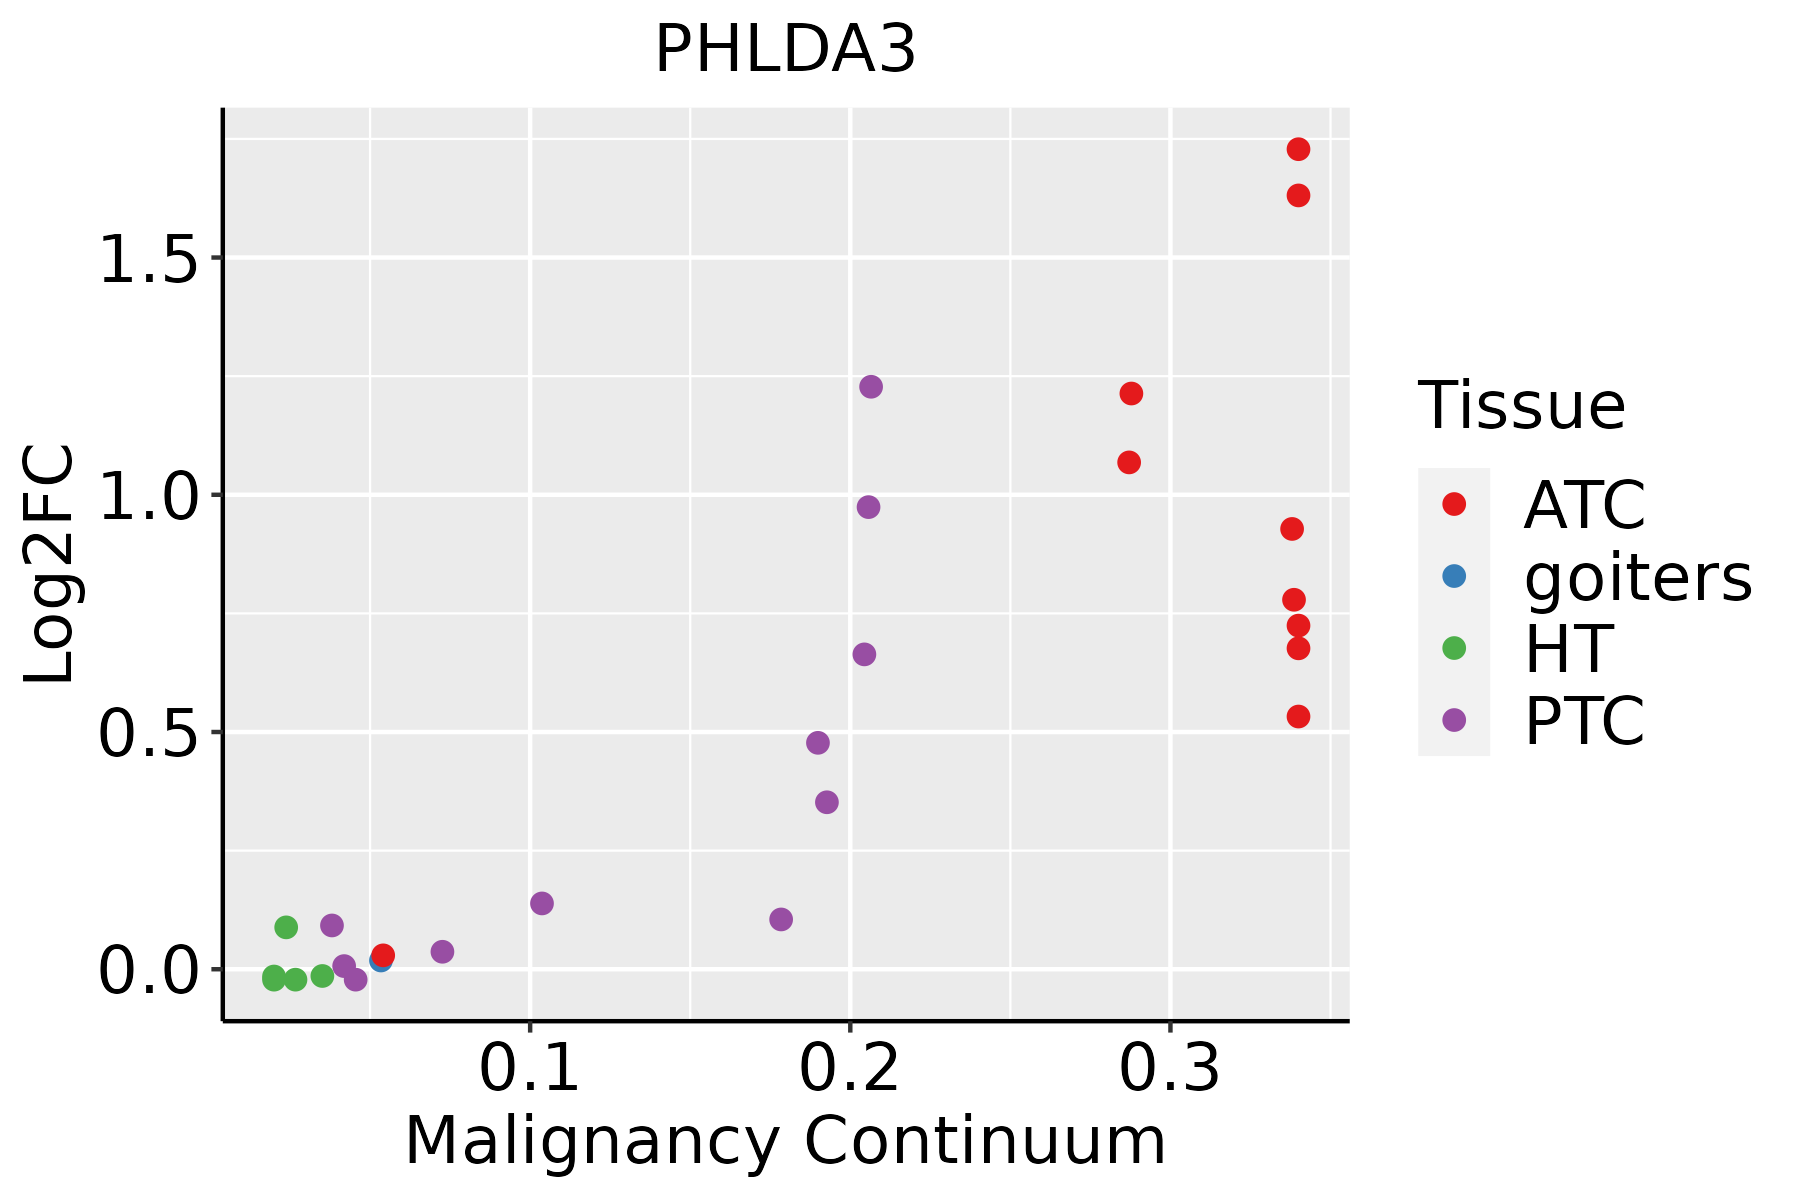 | ATC: Anaplastic thyroid cancer |
| HT: Hashimoto's thyroiditis | ||
| PTC: Papillary thyroid cancer |
| ∗log2FC in expression of this searched gene in stem-like cells from each diseased tissue sample relative to stem-like cells in normal samples in each tissue plotted against the malignancy continuum. Samples are colored based on if they are from different disease stage. |
Top |
Malignant transformation related pathway analysis |
| Find out the enriched GO biological processes and KEGG pathways involved in transition from healthy to precancer to cancer |
| Tissue | Disease Stage | Enriched GO biological Processes |
| Colorectum | AD |  |
| Colorectum | SER |  |
| Colorectum | MSS |  |
| Colorectum | MSI-H |  |
| Colorectum | FAP |  |
| ∗Top 15 enriched GO BP terms are showed in the bar plot of each disease state in each tissue. Each row represents a significant GO biological process which is colored according to the -log10(p.adjust). |
| Page: 1 2 3 4 5 6 7 8 9 |
| GO ID | Tissue | Disease Stage | Description | Gene Ratio | Bg Ratio | pvalue | p.adjust | Count |
| GO:009719327 | Esophagus | HGIN | intrinsic apoptotic signaling pathway | 90/2587 | 288/18723 | 1.50e-14 | 2.80e-12 | 90 |
| GO:007233127 | Esophagus | HGIN | signal transduction by p53 class mediator | 49/2587 | 163/18723 | 5.71e-08 | 3.06e-06 | 49 |
| GO:007233220 | Esophagus | HGIN | intrinsic apoptotic signaling pathway by p53 class mediator | 26/2587 | 76/18723 | 5.43e-06 | 1.73e-04 | 26 |
| GO:000863020 | Esophagus | HGIN | intrinsic apoptotic signaling pathway in response to DNA damage | 28/2587 | 99/18723 | 1.24e-04 | 2.54e-03 | 28 |
| GO:004277120 | Esophagus | HGIN | intrinsic apoptotic signaling pathway in response to DNA damage by p53 class mediator | 15/2587 | 43/18723 | 4.06e-04 | 6.15e-03 | 15 |
| GO:0097193111 | Esophagus | ESCC | intrinsic apoptotic signaling pathway | 222/8552 | 288/18723 | 5.87e-28 | 2.02e-25 | 222 |
| GO:0072331111 | Esophagus | ESCC | signal transduction by p53 class mediator | 121/8552 | 163/18723 | 9.61e-14 | 4.69e-12 | 121 |
| GO:0008630110 | Esophagus | ESCC | intrinsic apoptotic signaling pathway in response to DNA damage | 78/8552 | 99/18723 | 1.43e-11 | 5.08e-10 | 78 |
| GO:0042771110 | Esophagus | ESCC | intrinsic apoptotic signaling pathway in response to DNA damage by p53 class mediator | 38/8552 | 43/18723 | 5.75e-09 | 1.18e-07 | 38 |
| GO:0072332111 | Esophagus | ESCC | intrinsic apoptotic signaling pathway by p53 class mediator | 59/8552 | 76/18723 | 1.22e-08 | 2.42e-07 | 59 |
| GO:009719312 | Liver | Cirrhotic | intrinsic apoptotic signaling pathway | 130/4634 | 288/18723 | 2.69e-14 | 2.45e-12 | 130 |
| GO:007233112 | Liver | Cirrhotic | signal transduction by p53 class mediator | 69/4634 | 163/18723 | 5.97e-07 | 1.30e-05 | 69 |
| GO:00723326 | Liver | Cirrhotic | intrinsic apoptotic signaling pathway by p53 class mediator | 38/4634 | 76/18723 | 1.75e-06 | 3.32e-05 | 38 |
| GO:00086306 | Liver | Cirrhotic | intrinsic apoptotic signaling pathway in response to DNA damage | 42/4634 | 99/18723 | 8.44e-05 | 9.17e-04 | 42 |
| GO:00427716 | Liver | Cirrhotic | intrinsic apoptotic signaling pathway in response to DNA damage by p53 class mediator | 22/4634 | 43/18723 | 1.69e-04 | 1.59e-03 | 22 |
| GO:009719322 | Liver | HCC | intrinsic apoptotic signaling pathway | 184/7958 | 288/18723 | 1.50e-13 | 8.32e-12 | 184 |
| GO:007233122 | Liver | HCC | signal transduction by p53 class mediator | 108/7958 | 163/18723 | 7.14e-10 | 2.23e-08 | 108 |
| GO:007233212 | Liver | HCC | intrinsic apoptotic signaling pathway by p53 class mediator | 51/7958 | 76/18723 | 1.27e-05 | 1.42e-04 | 51 |
| GO:000863011 | Liver | HCC | intrinsic apoptotic signaling pathway in response to DNA damage | 58/7958 | 99/18723 | 8.97e-04 | 5.29e-03 | 58 |
| GO:004277111 | Liver | HCC | intrinsic apoptotic signaling pathway in response to DNA damage by p53 class mediator | 28/7958 | 43/18723 | 2.30e-03 | 1.14e-02 | 28 |
| Page: 1 2 3 4 |
| Pathway ID | Tissue | Disease Stage | Description | Gene Ratio | Bg Ratio | pvalue | p.adjust | qvalue | Count |
| Page: 1 |
Top |
Cell-cell communication analysis |
| Identification of potential cell-cell interactions between two cell types and their ligand-receptor pairs for different disease states |
| Ligand | Receptor | LRpair | Pathway | Tissue | Disease Stage |
| Page: 1 |
Top |
Single-cell gene regulatory network inference analysis |
| Find out the significant the regulons (TFs) and the target genes of each regulon across cell types for different disease states |
| TF | Cell Type | Tissue | Disease Stage | Target Gene | RSS | Regulon Activity |
| ∗The dot plots of a searched regulon are shown for all cell subpopulations in each disease state of each tissue based on the regulon specific score inferred using pySCENIC and by calculating the average expression. |
| Page: 1 |
Top |
Somatic mutation of malignant transformation related genes |
| Annotation of somatic variants for genes involved in malignant transformation |
| Hugo Symbol | Variant Class | Variant Classification | dbSNP RS | HGVSc | HGVSp | HGVSp Short | SWISSPROT | BIOTYPE | SIFT | PolyPhen | Tumor Sample Barcode | Tissue | Histology | Sex | Age | Stage | Therapy Types | Drugs | Outcome |
| PHLDA3 | SNV | Missense_Mutation | novel | c.266N>A | p.Leu89Gln | p.L89Q | Q9Y5J5 | protein_coding | tolerated(0.61) | benign(0.001) | TCGA-A7-A6VW-01 | Breast | breast invasive carcinoma | Female | <65 | I/II | Chemotherapy | doxorubicin | CR |
| PHLDA3 | SNV | Missense_Mutation | novel | c.153G>T | p.Lys51Asn | p.K51N | Q9Y5J5 | protein_coding | deleterious(0) | probably_damaging(0.962) | TCGA-B5-A1MX-01 | Endometrium | uterine corpus endometrioid carcinoma | Female | <65 | I/II | Hormone Therapy | megace | SD |
| PHLDA3 | SNV | Missense_Mutation | novel | c.260N>A | p.Cys87Tyr | p.C87Y | Q9Y5J5 | protein_coding | deleterious(0.01) | possibly_damaging(0.865) | TCGA-PG-A6IB-01 | Endometrium | uterine corpus endometrioid carcinoma | Female | >=65 | I/II | Unknown | Unknown | SD |
| PHLDA3 | SNV | Missense_Mutation | novel | c.245N>G | p.Glu82Gly | p.E82G | Q9Y5J5 | protein_coding | deleterious(0) | probably_damaging(0.998) | TCGA-05-4424-01 | Lung | lung adenocarcinoma | Male | >=65 | I/II | Targeted Molecular therapy | erlotinib | SD |
| PHLDA3 | SNV | Missense_Mutation | c.116N>T | p.Gln39Leu | p.Q39L | Q9Y5J5 | protein_coding | tolerated(0.84) | benign(0.005) | TCGA-62-A46O-01 | Lung | lung adenocarcinoma | Female | >=65 | I/II | Unknown | Unknown | PD | |
| PHLDA3 | SNV | Missense_Mutation | c.246N>C | p.Glu82Asp | p.E82D | Q9Y5J5 | protein_coding | deleterious(0.03) | probably_damaging(0.994) | TCGA-97-A4M0-01 | Lung | lung adenocarcinoma | Female | <65 | I/II | Unknown | Unknown | SD | |
| PHLDA3 | SNV | Missense_Mutation | novel | c.277N>T | p.Gly93Cys | p.G93C | Q9Y5J5 | protein_coding | tolerated(0.56) | probably_damaging(0.987) | TCGA-22-1005-01 | Lung | lung squamous cell carcinoma | Male | <65 | I/II | Unknown | Unknown | SD |
| PHLDA3 | SNV | Missense_Mutation | novel | c.81N>C | p.Lys27Asn | p.K27N | Q9Y5J5 | protein_coding | deleterious(0) | probably_damaging(0.998) | TCGA-CV-A6K2-01 | Oral cavity | head & neck squamous cell carcinoma | Male | >=65 | I/II | Unknown | Unknown | PD |
| Page: 1 |
Top |
Related drugs of malignant transformation related genes |
| Identification of chemicals and drugs interact with genes involved in malignant transfromation |
| (DGIdb 4.0) |
| Entrez ID | Symbol | Category | Interaction Types | Drug Claim Name | Drug Name | PMIDs |
| Page: 1 |

Copyright 2023-Present -The University of Texas Health Science Center at Houston |