
|
|||||
|
 | |
| |
| |
| |
| |
| |
|
Gene: PGGHG |
Gene summary for PGGHG |
| Gene information | Species | Human | Gene symbol | PGGHG | Gene ID | 80162 |
| Gene name | protein-glucosylgalactosylhydroxylysine glucosidase | |
| Gene Alias | ATHL1 | |
| Cytomap | 11p15.5 | |
| Gene Type | protein-coding | GO ID | GO:0005975 | UniProtAcc | A0A024R1Z9 |
Top |
Malignant transformation analysis |
| Identification of the aberrant gene expression in precancerous and cancerous lesions by comparing the gene expression of stem-like cells in diseased tissues with normal stem cells |
| Entrez ID | Symbol | Replicates | Species | Organ | Tissue | Adj P-value | Log2FC | Malignancy |
| 80162 | PGGHG | A014-C-008 | Human | Colorectum | FAP | 2.70e-06 | 6.32e-01 | -0.191 |
| 80162 | PGGHG | F034 | Human | Colorectum | FAP | 1.69e-26 | 9.74e-01 | -0.0665 |
| 80162 | PGGHG | CRC-1-8810 | Human | Colorectum | CRC | 7.76e-21 | 7.00e-01 | 0.6257 |
| 80162 | PGGHG | CRC-3-11773 | Human | Colorectum | CRC | 6.24e-97 | 1.69e+00 | 0.2564 |
| 80162 | PGGHG | AEH-subject1 | Human | Endometrium | AEH | 2.98e-34 | 6.13e-01 | -0.3059 |
| 80162 | PGGHG | AEH-subject2 | Human | Endometrium | AEH | 1.74e-20 | 5.36e-01 | -0.2525 |
| 80162 | PGGHG | AEH-subject3 | Human | Endometrium | AEH | 5.07e-16 | 4.06e-01 | -0.2576 |
| 80162 | PGGHG | AEH-subject4 | Human | Endometrium | AEH | 1.11e-12 | 3.68e-01 | -0.2657 |
| 80162 | PGGHG | EEC-subject1 | Human | Endometrium | EEC | 4.07e-08 | 2.49e-01 | -0.2682 |
| 80162 | PGGHG | EEC-subject2 | Human | Endometrium | EEC | 4.77e-29 | 6.36e-01 | -0.2607 |
| 80162 | PGGHG | EEC-subject4 | Human | Endometrium | EEC | 1.75e-04 | 1.73e-01 | -0.2571 |
| 80162 | PGGHG | EEC-subject5 | Human | Endometrium | EEC | 1.82e-05 | 1.51e-01 | -0.249 |
| 80162 | PGGHG | GSM5276935 | Human | Endometrium | EEC | 1.78e-10 | 2.32e-01 | -0.123 |
| 80162 | PGGHG | GSM6177621_NYU_UCEC2_lib1_lib1 | Human | Endometrium | EEC | 7.40e-03 | 1.48e-01 | -0.1934 |
| 80162 | PGGHG | GSM6177623_NYU_UCEC3_Vis | Human | Endometrium | EEC | 4.09e-74 | 1.22e+00 | -0.1269 |
| 80162 | PGGHG | HCC1_Meng | Human | Liver | HCC | 9.14e-03 | -9.38e-02 | 0.0246 |
| 80162 | PGGHG | HCC2_Meng | Human | Liver | HCC | 4.06e-02 | -9.38e-02 | 0.0107 |
| 80162 | PGGHG | cirrhotic1 | Human | Liver | Cirrhotic | 1.93e-02 | -9.38e-02 | 0.0202 |
| 80162 | PGGHG | cirrhotic2 | Human | Liver | Cirrhotic | 1.93e-02 | -9.38e-02 | 0.0201 |
| 80162 | PGGHG | HCC2 | Human | Liver | HCC | 2.82e-03 | 3.41e+00 | 0.5341 |
| Page: 1 2 3 |
| Tissue | Expression Dynamics | Abbreviation |
| Colorectum (GSE201348) |  | FAP: Familial adenomatous polyposis |
| CRC: Colorectal cancer | ||
| Colorectum (HTA11) |  | AD: Adenomas |
| SER: Sessile serrated lesions | ||
| MSI-H: Microsatellite-high colorectal cancer | ||
| MSS: Microsatellite stable colorectal cancer | ||
| Endometrium | 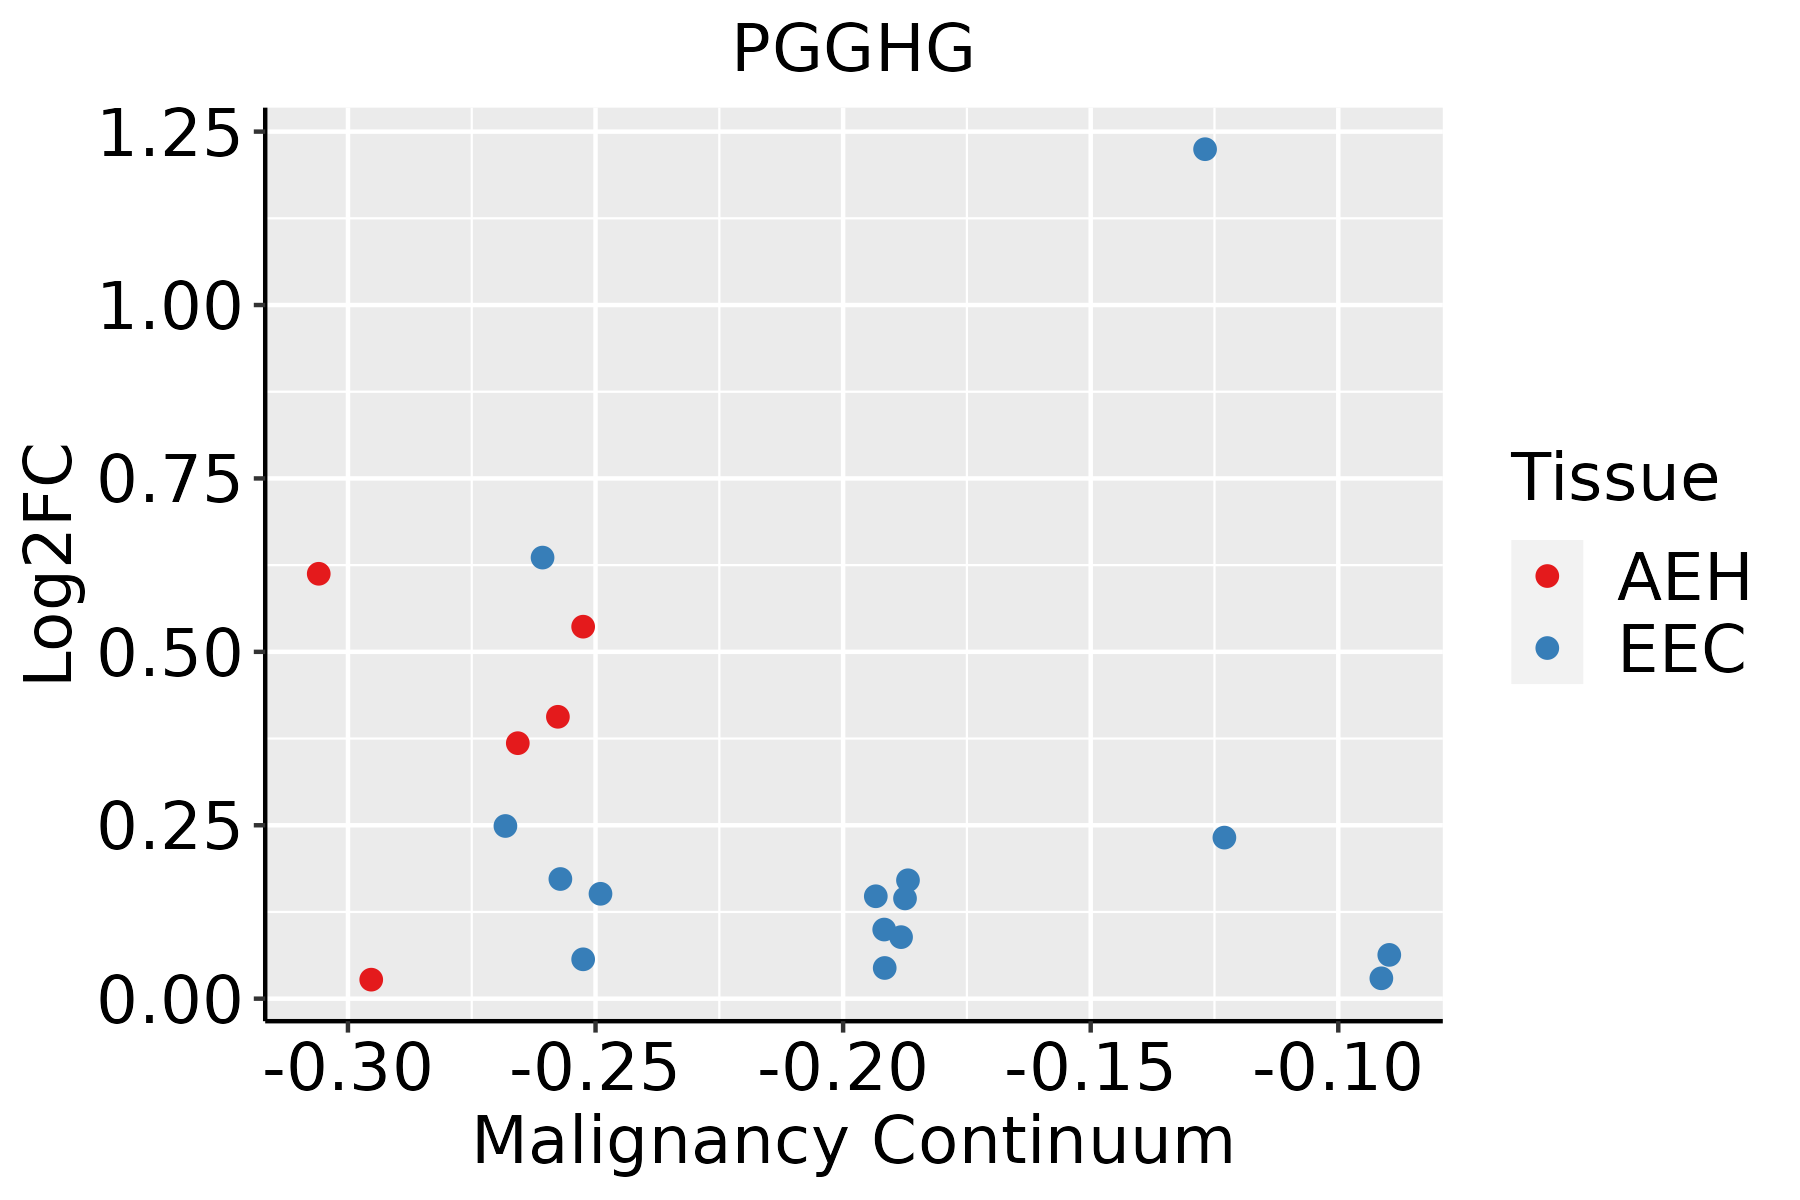 | AEH: Atypical endometrial hyperplasia |
| EEC: Endometrioid Cancer | ||
| Liver | 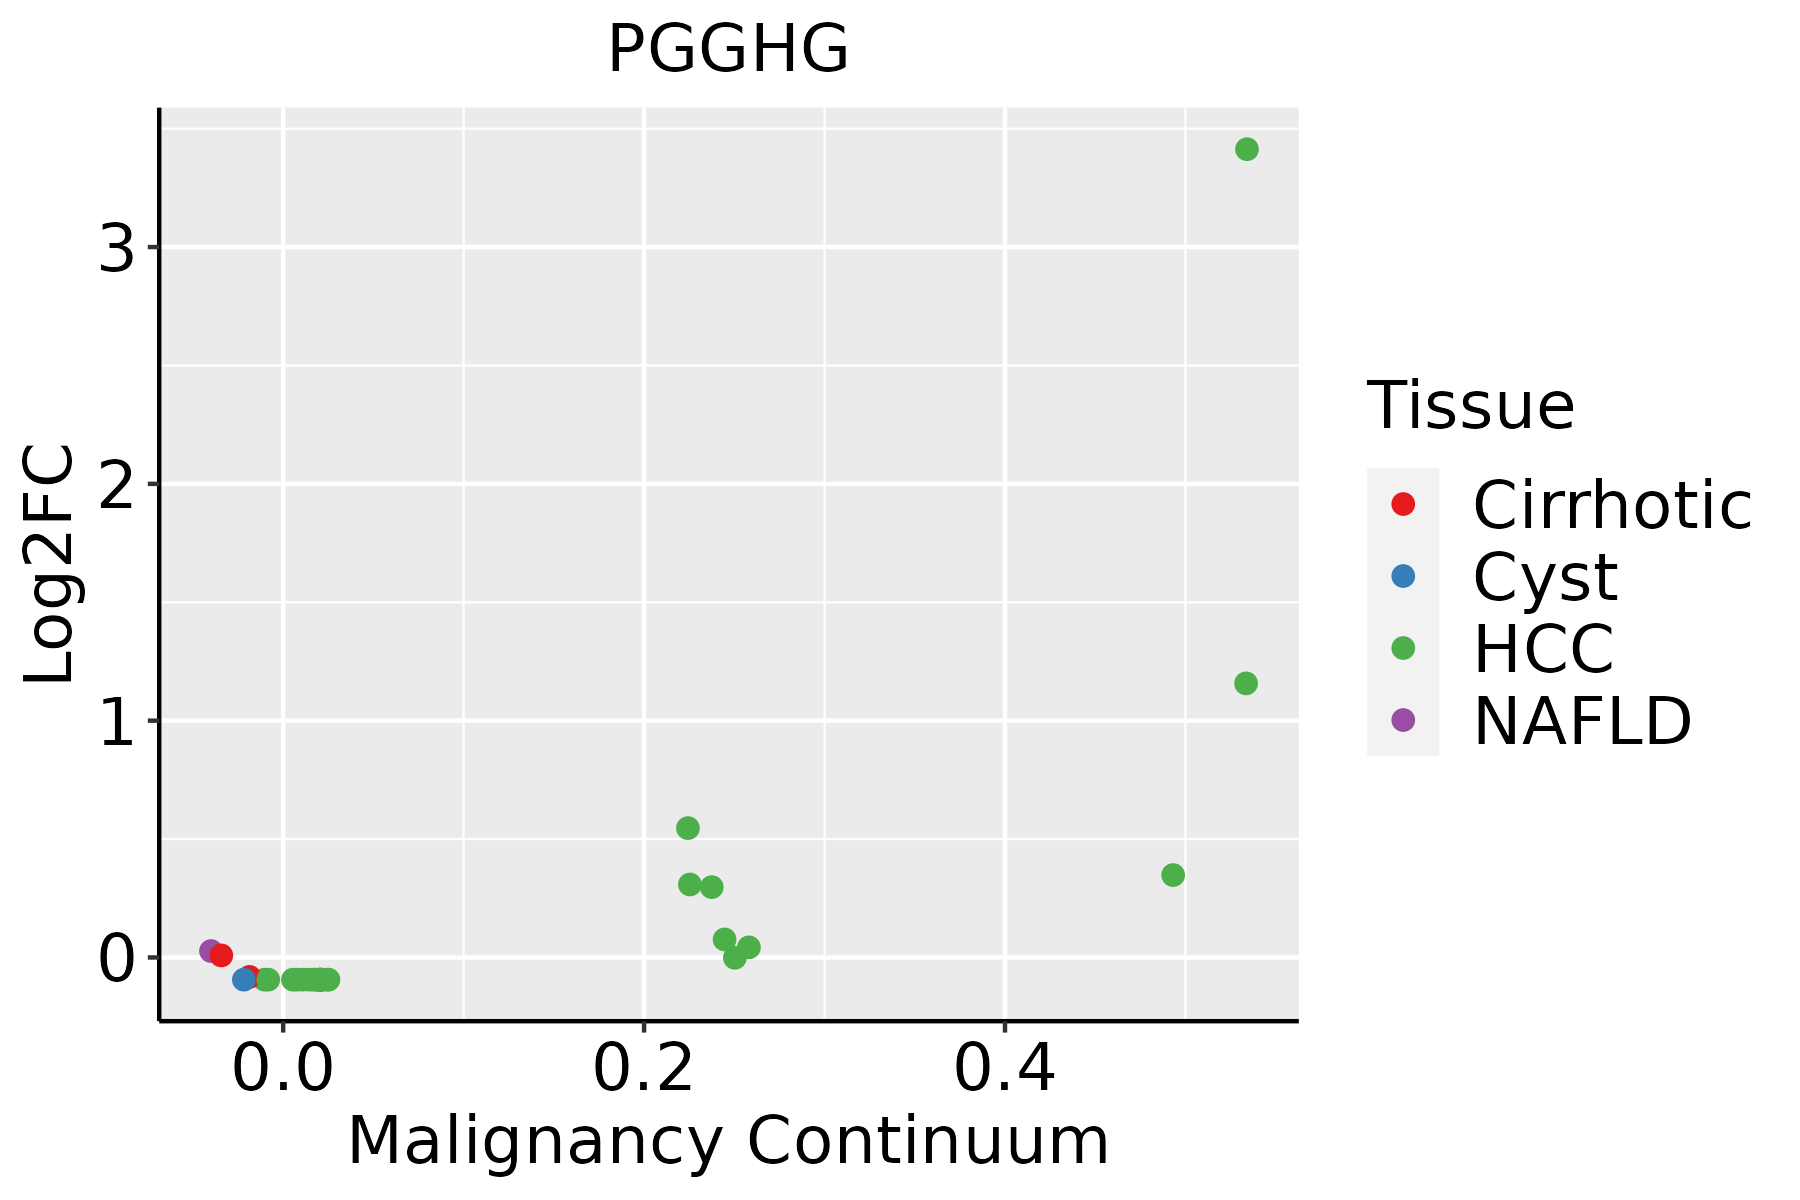 | HCC: Hepatocellular carcinoma |
| NAFLD: Non-alcoholic fatty liver disease |
| ∗log2FC in expression of this searched gene in stem-like cells from each diseased tissue sample relative to stem-like cells in normal samples in each tissue plotted against the malignancy continuum. Samples are colored based on if they are from different disease stage. |
Top |
Malignant transformation related pathway analysis |
| Find out the enriched GO biological processes and KEGG pathways involved in transition from healthy to precancer to cancer |
| Tissue | Disease Stage | Enriched GO biological Processes |
| Colorectum | AD |  |
| Colorectum | SER |  |
| Colorectum | MSS |  |
| Colorectum | MSI-H |  |
| Colorectum | FAP |  |
| ∗Top 15 enriched GO BP terms are showed in the bar plot of each disease state in each tissue. Each row represents a significant GO biological process which is colored according to the -log10(p.adjust). |
| Page: 1 2 3 4 5 6 7 8 9 |
| GO ID | Tissue | Disease Stage | Description | Gene Ratio | Bg Ratio | pvalue | p.adjust | Count |
| Page: 1 |
| Pathway ID | Tissue | Disease Stage | Description | Gene Ratio | Bg Ratio | pvalue | p.adjust | qvalue | Count |
| Page: 1 |
Top |
Cell-cell communication analysis |
| Identification of potential cell-cell interactions between two cell types and their ligand-receptor pairs for different disease states |
| Ligand | Receptor | LRpair | Pathway | Tissue | Disease Stage |
| Page: 1 |
Top |
Single-cell gene regulatory network inference analysis |
| Find out the significant the regulons (TFs) and the target genes of each regulon across cell types for different disease states |
| TF | Cell Type | Tissue | Disease Stage | Target Gene | RSS | Regulon Activity |
| ∗The dot plots of a searched regulon are shown for all cell subpopulations in each disease state of each tissue based on the regulon specific score inferred using pySCENIC and by calculating the average expression. |
| Page: 1 |
Top |
Somatic mutation of malignant transformation related genes |
| Annotation of somatic variants for genes involved in malignant transformation |
| Hugo Symbol | Variant Class | Variant Classification | dbSNP RS | HGVSc | HGVSp | HGVSp Short | SWISSPROT | BIOTYPE | SIFT | PolyPhen | Tumor Sample Barcode | Tissue | Histology | Sex | Age | Stage | Therapy Types | Drugs | Outcome |
| PGGHG | SNV | Missense_Mutation | c.101G>A | p.Arg34Gln | p.R34Q | Q32M88 | protein_coding | tolerated(0.07) | possibly_damaging(0.805) | TCGA-A2-A0CW-01 | Breast | breast invasive carcinoma | Female | >=65 | I/II | Hormone Therapy | anastrozole | SD | |
| PGGHG | SNV | Missense_Mutation | c.108N>A | p.Phe36Leu | p.F36L | Q32M88 | protein_coding | deleterious(0.01) | benign(0.001) | TCGA-BH-A0BT-01 | Breast | breast invasive carcinoma | Female | <65 | I/II | Chemotherapy | adriamycin | CR | |
| PGGHG | SNV | Missense_Mutation | c.643C>G | p.Leu215Val | p.L215V | Q32M88 | protein_coding | tolerated(0.14) | benign(0.05) | TCGA-D8-A1JP-01 | Breast | breast invasive carcinoma | Female | >=65 | I/II | Hormone Therapy | tamoxiphen | SD | |
| PGGHG | SNV | Missense_Mutation | rs777823440 | c.1781N>T | p.Ala594Val | p.A594V | Q32M88 | protein_coding | deleterious(0.05) | possibly_damaging(0.642) | TCGA-LL-A73Z-01 | Breast | breast invasive carcinoma | Female | <65 | III/IV | Chemotherapy | adriamycin | PD |
| PGGHG | deletion | Frame_Shift_Del | rs774965357 | c.508delN | p.Pro172HisfsTer16 | p.P172Hfs*16 | Q32M88 | protein_coding | TCGA-D8-A1XK-01 | Breast | breast invasive carcinoma | Female | <65 | I/II | Chemotherapy | doxorubicine+cyclophosphamide | SD | ||
| PGGHG | deletion | Frame_Shift_Del | c.2100delN | p.Glu700AspfsTer66 | p.E700Dfs*66 | Q32M88 | protein_coding | TCGA-EW-A1OZ-01 | Breast | breast invasive carcinoma | Female | <65 | I/II | Targeted Molecular therapy | trastuzumab | SD | |||
| PGGHG | SNV | Missense_Mutation | novel | c.464G>A | p.Gly155Glu | p.G155E | Q32M88 | protein_coding | tolerated(0.08) | possibly_damaging(0.814) | TCGA-EA-A3HU-01 | Cervix | cervical & endocervical cancer | Female | <65 | I/II | Unknown | Unknown | SD |
| PGGHG | SNV | Missense_Mutation | c.263N>T | p.Ser88Phe | p.S88F | Q32M88 | protein_coding | deleterious(0.03) | benign(0.208) | TCGA-EA-A50E-01 | Cervix | cervical & endocervical cancer | Female | <65 | I/II | Unknown | Unknown | PD | |
| PGGHG | SNV | Missense_Mutation | novel | c.284N>A | p.Gly95Asp | p.G95D | Q32M88 | protein_coding | tolerated(0.06) | benign(0.007) | TCGA-VS-A958-01 | Cervix | cervical & endocervical cancer | Female | <65 | I/II | Chemotherapy | cisplatin | CR |
| PGGHG | SNV | Missense_Mutation | rs114112322 | c.1817N>C | p.Arg606Pro | p.R606P | Q32M88 | protein_coding | tolerated(0.21) | benign(0.111) | TCGA-VS-A9UY-01 | Cervix | cervical & endocervical cancer | Female | <65 | I/II | Chemotherapy | cisplatin | PD |
| Page: 1 2 3 4 5 6 |
Top |
Related drugs of malignant transformation related genes |
| Identification of chemicals and drugs interact with genes involved in malignant transfromation |
| (DGIdb 4.0) |
| Entrez ID | Symbol | Category | Interaction Types | Drug Claim Name | Drug Name | PMIDs |
| Page: 1 |

Copyright 2023-Present -The University of Texas Health Science Center at Houston |