
|
|||||
|
 | |
| |
| |
| |
| |
| |
|
Gene: PEX26 |
Gene summary for PEX26 |
| Gene information | Species | Human | Gene symbol | PEX26 | Gene ID | 55670 |
| Gene name | peroxisomal biogenesis factor 26 | |
| Gene Alias | PBD7A | |
| Cytomap | 22q11.21 | |
| Gene Type | protein-coding | GO ID | GO:0006605 | UniProtAcc | A0A024R100 |
Top |
Malignant transformation analysis |
| Identification of the aberrant gene expression in precancerous and cancerous lesions by comparing the gene expression of stem-like cells in diseased tissues with normal stem cells |
| Entrez ID | Symbol | Replicates | Species | Organ | Tissue | Adj P-value | Log2FC | Malignancy |
| 55670 | PEX26 | F034 | Human | Colorectum | FAP | 5.41e-08 | -2.45e-01 | -0.0665 |
| 55670 | PEX26 | F072B | Human | Colorectum | FAP | 6.26e-05 | -2.71e-01 | 0.257 |
| 55670 | PEX26 | LZE7T | Human | Esophagus | ESCC | 9.63e-12 | 4.58e-01 | 0.0667 |
| 55670 | PEX26 | LZE20T | Human | Esophagus | ESCC | 9.36e-03 | 9.73e-02 | 0.0662 |
| 55670 | PEX26 | LZE22T | Human | Esophagus | ESCC | 2.00e-02 | 1.89e-01 | 0.068 |
| 55670 | PEX26 | LZE24T | Human | Esophagus | ESCC | 3.63e-08 | 2.26e-01 | 0.0596 |
| 55670 | PEX26 | P1T-E | Human | Esophagus | ESCC | 6.57e-11 | 3.65e-01 | 0.0875 |
| 55670 | PEX26 | P2T-E | Human | Esophagus | ESCC | 1.93e-20 | 3.21e-01 | 0.1177 |
| 55670 | PEX26 | P4T-E | Human | Esophagus | ESCC | 3.22e-13 | 2.82e-01 | 0.1323 |
| 55670 | PEX26 | P5T-E | Human | Esophagus | ESCC | 3.20e-23 | 3.75e-01 | 0.1327 |
| 55670 | PEX26 | P8T-E | Human | Esophagus | ESCC | 3.70e-11 | 2.17e-01 | 0.0889 |
| 55670 | PEX26 | P9T-E | Human | Esophagus | ESCC | 2.08e-07 | 2.07e-01 | 0.1131 |
| 55670 | PEX26 | P10T-E | Human | Esophagus | ESCC | 8.77e-21 | 4.37e-01 | 0.116 |
| 55670 | PEX26 | P11T-E | Human | Esophagus | ESCC | 3.56e-09 | 2.89e-01 | 0.1426 |
| 55670 | PEX26 | P12T-E | Human | Esophagus | ESCC | 1.43e-06 | 2.38e-01 | 0.1122 |
| 55670 | PEX26 | P15T-E | Human | Esophagus | ESCC | 2.41e-05 | 1.41e-01 | 0.1149 |
| 55670 | PEX26 | P16T-E | Human | Esophagus | ESCC | 1.96e-22 | 4.02e-01 | 0.1153 |
| 55670 | PEX26 | P17T-E | Human | Esophagus | ESCC | 2.98e-03 | 2.20e-01 | 0.1278 |
| 55670 | PEX26 | P19T-E | Human | Esophagus | ESCC | 2.50e-05 | 2.81e-01 | 0.1662 |
| 55670 | PEX26 | P20T-E | Human | Esophagus | ESCC | 4.72e-09 | 1.44e-01 | 0.1124 |
| Page: 1 2 3 4 5 6 |
| Tissue | Expression Dynamics | Abbreviation |
| Colorectum (GSE201348) |  | FAP: Familial adenomatous polyposis |
| CRC: Colorectal cancer | ||
| Colorectum (HTA11) |  | AD: Adenomas |
| SER: Sessile serrated lesions | ||
| MSI-H: Microsatellite-high colorectal cancer | ||
| MSS: Microsatellite stable colorectal cancer | ||
| Esophagus | 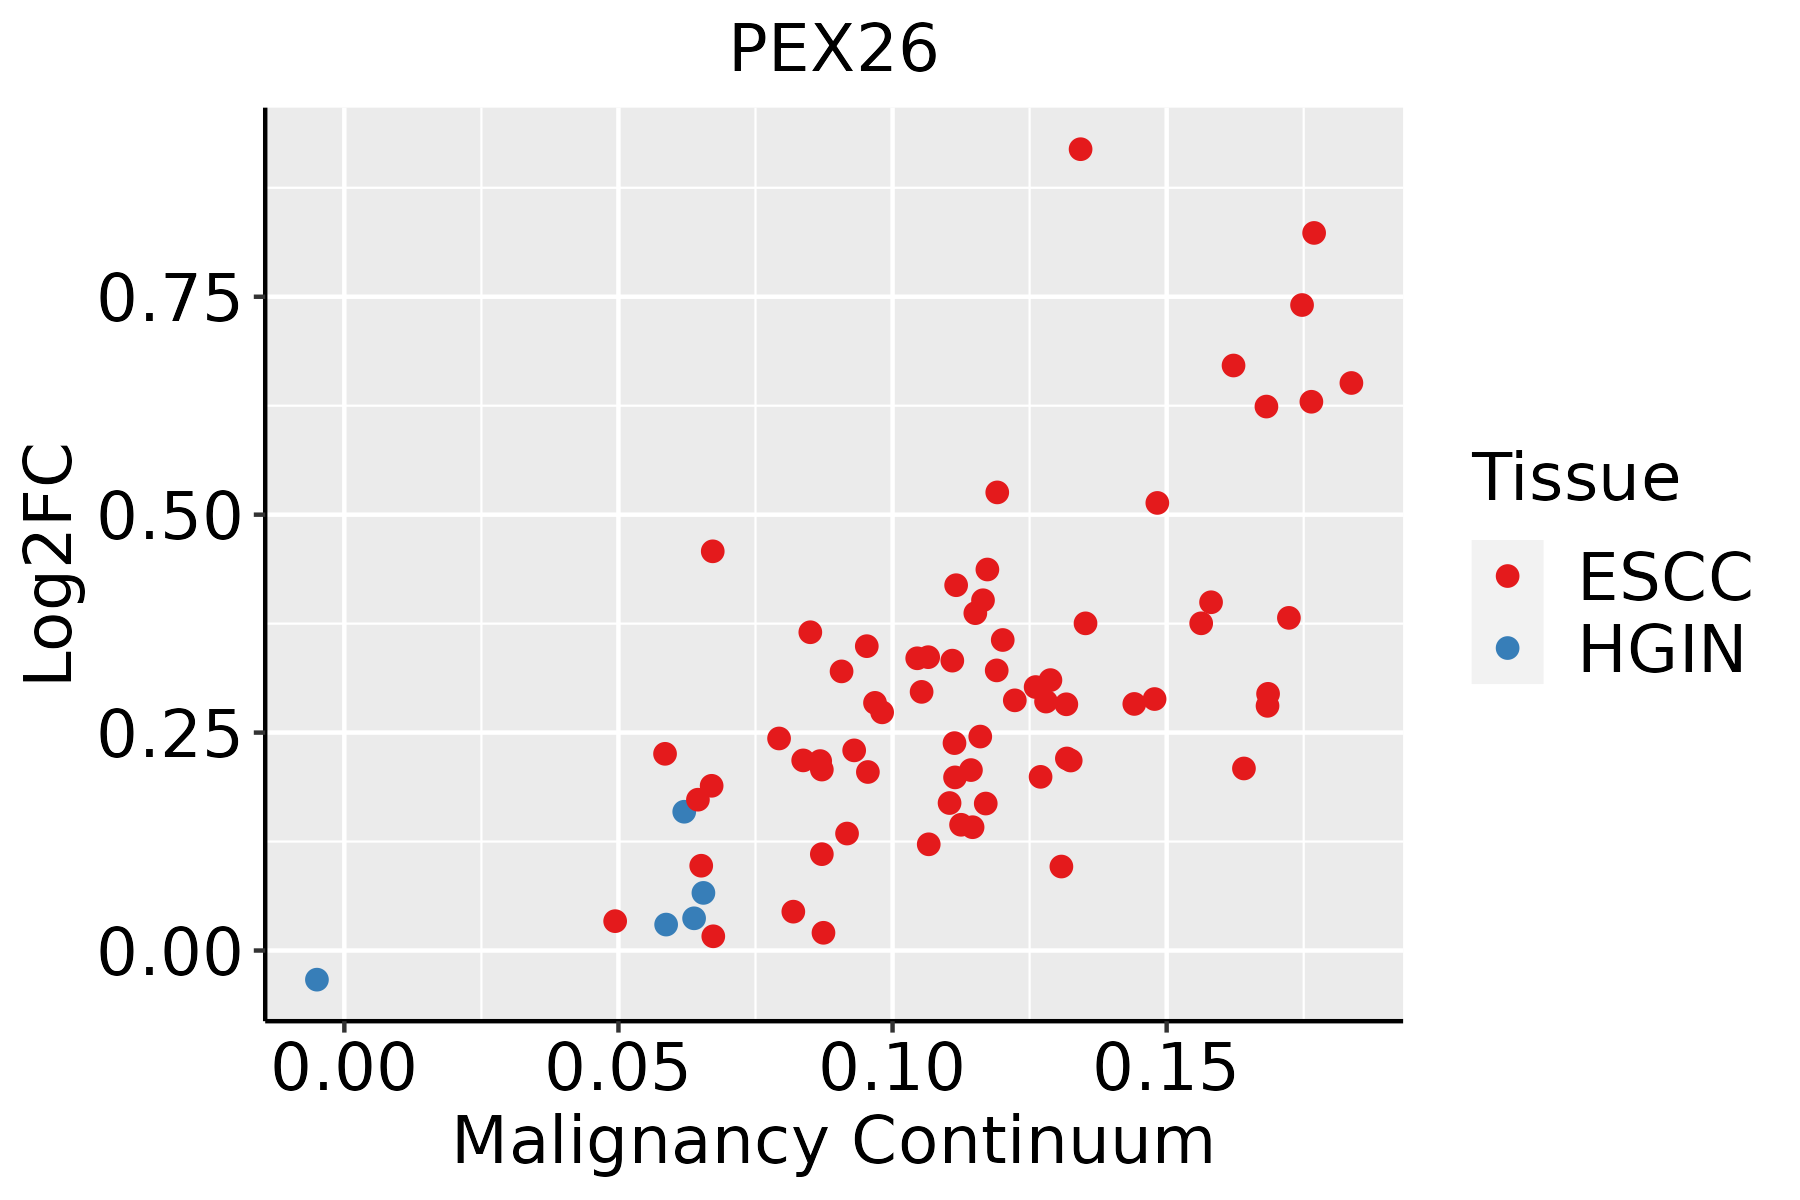 | ESCC: Esophageal squamous cell carcinoma |
| HGIN: High-grade intraepithelial neoplasias | ||
| LGIN: Low-grade intraepithelial neoplasias | ||
| Liver | 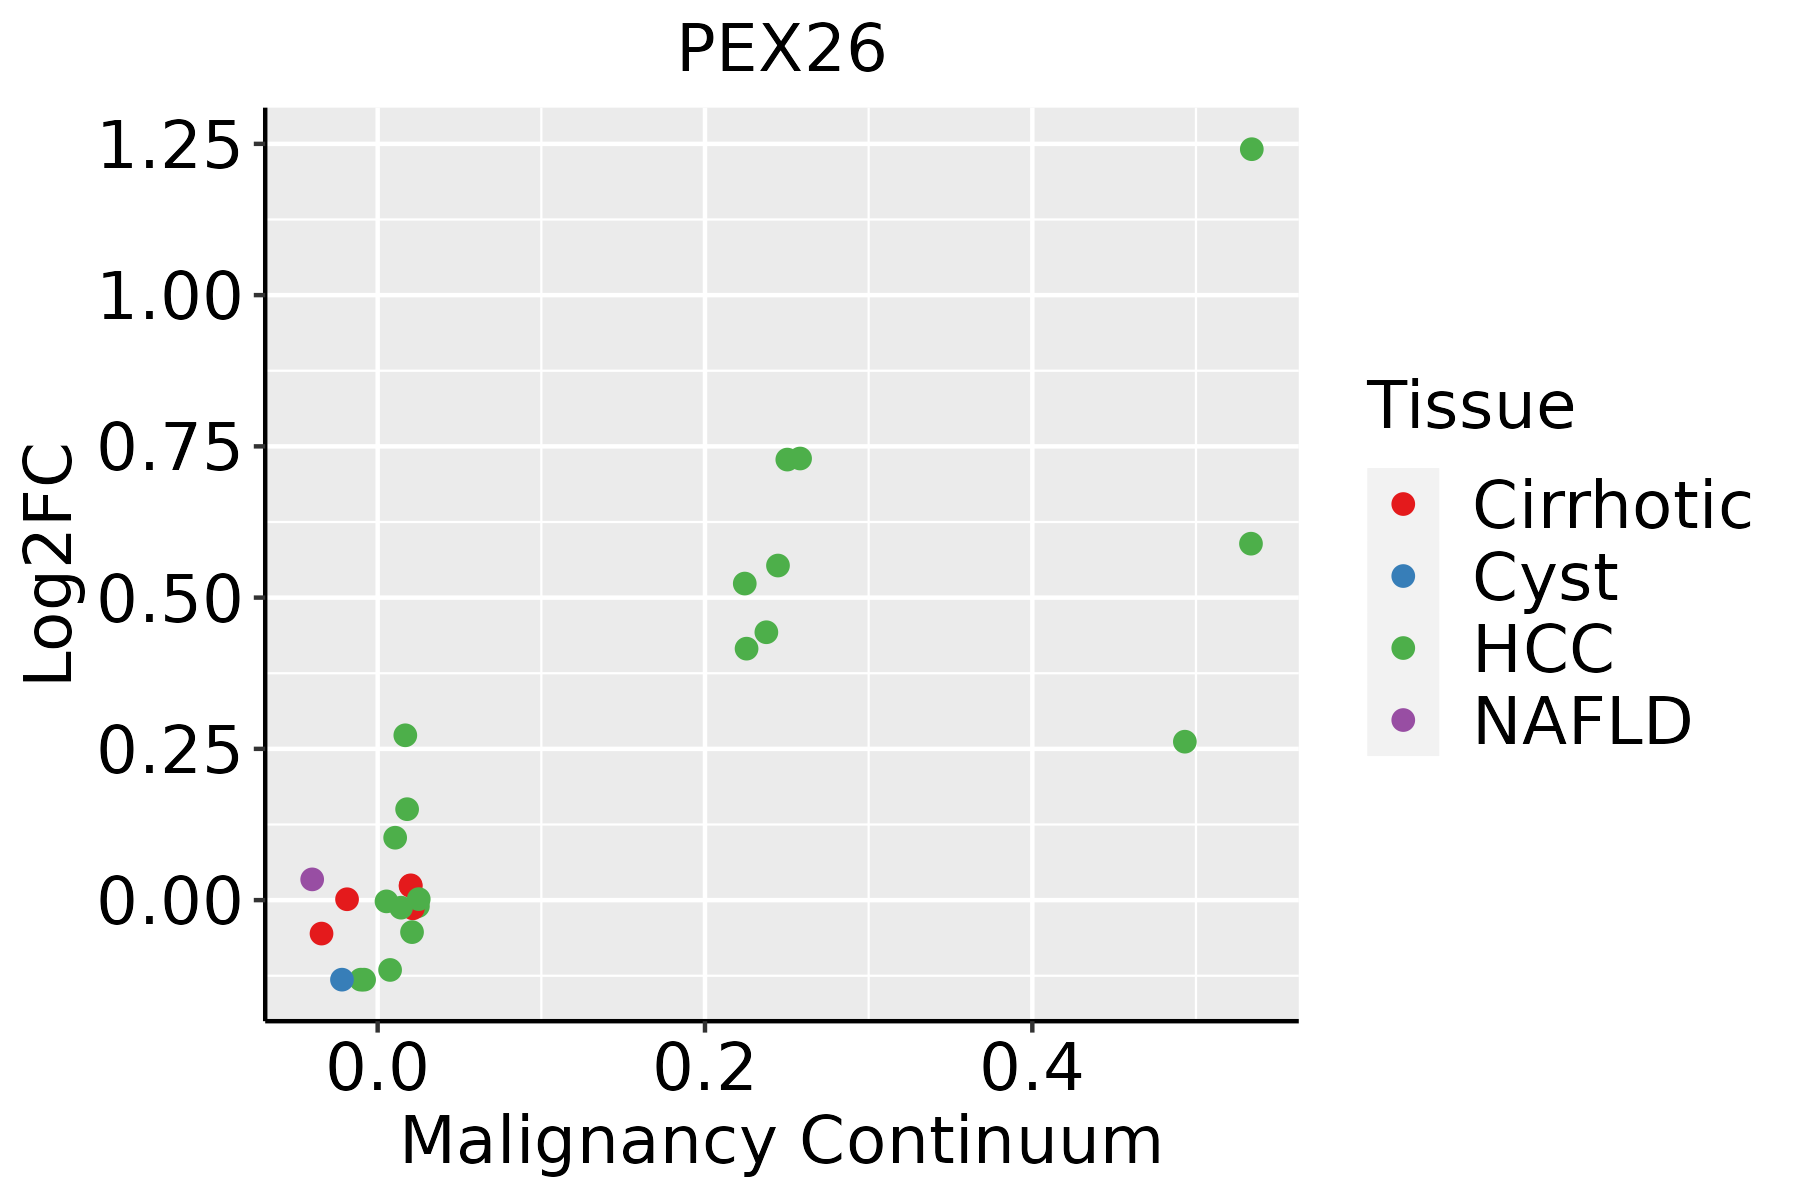 | HCC: Hepatocellular carcinoma |
| NAFLD: Non-alcoholic fatty liver disease | ||
| Oral Cavity | 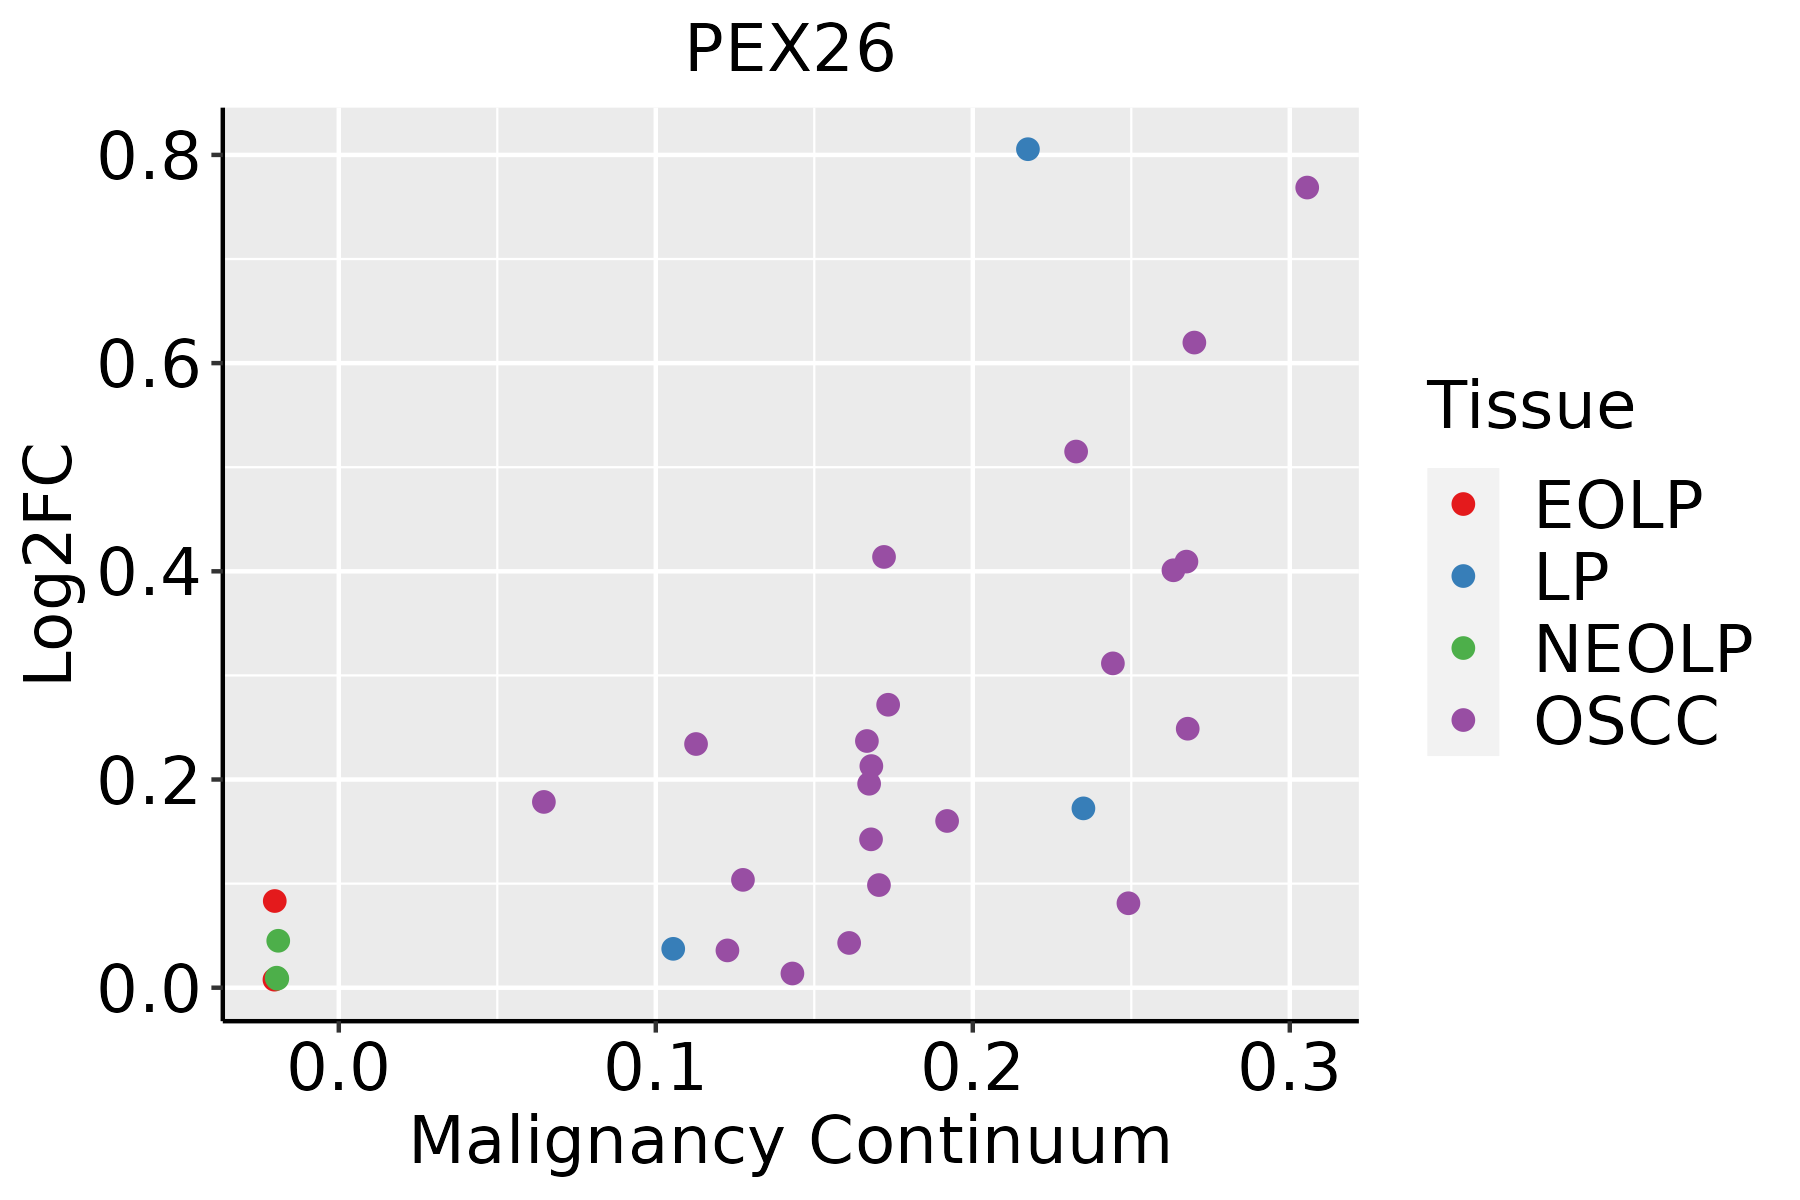 | EOLP: Erosive Oral lichen planus |
| LP: leukoplakia | ||
| NEOLP: Non-erosive oral lichen planus | ||
| OSCC: Oral squamous cell carcinoma | ||
| Thyroid | 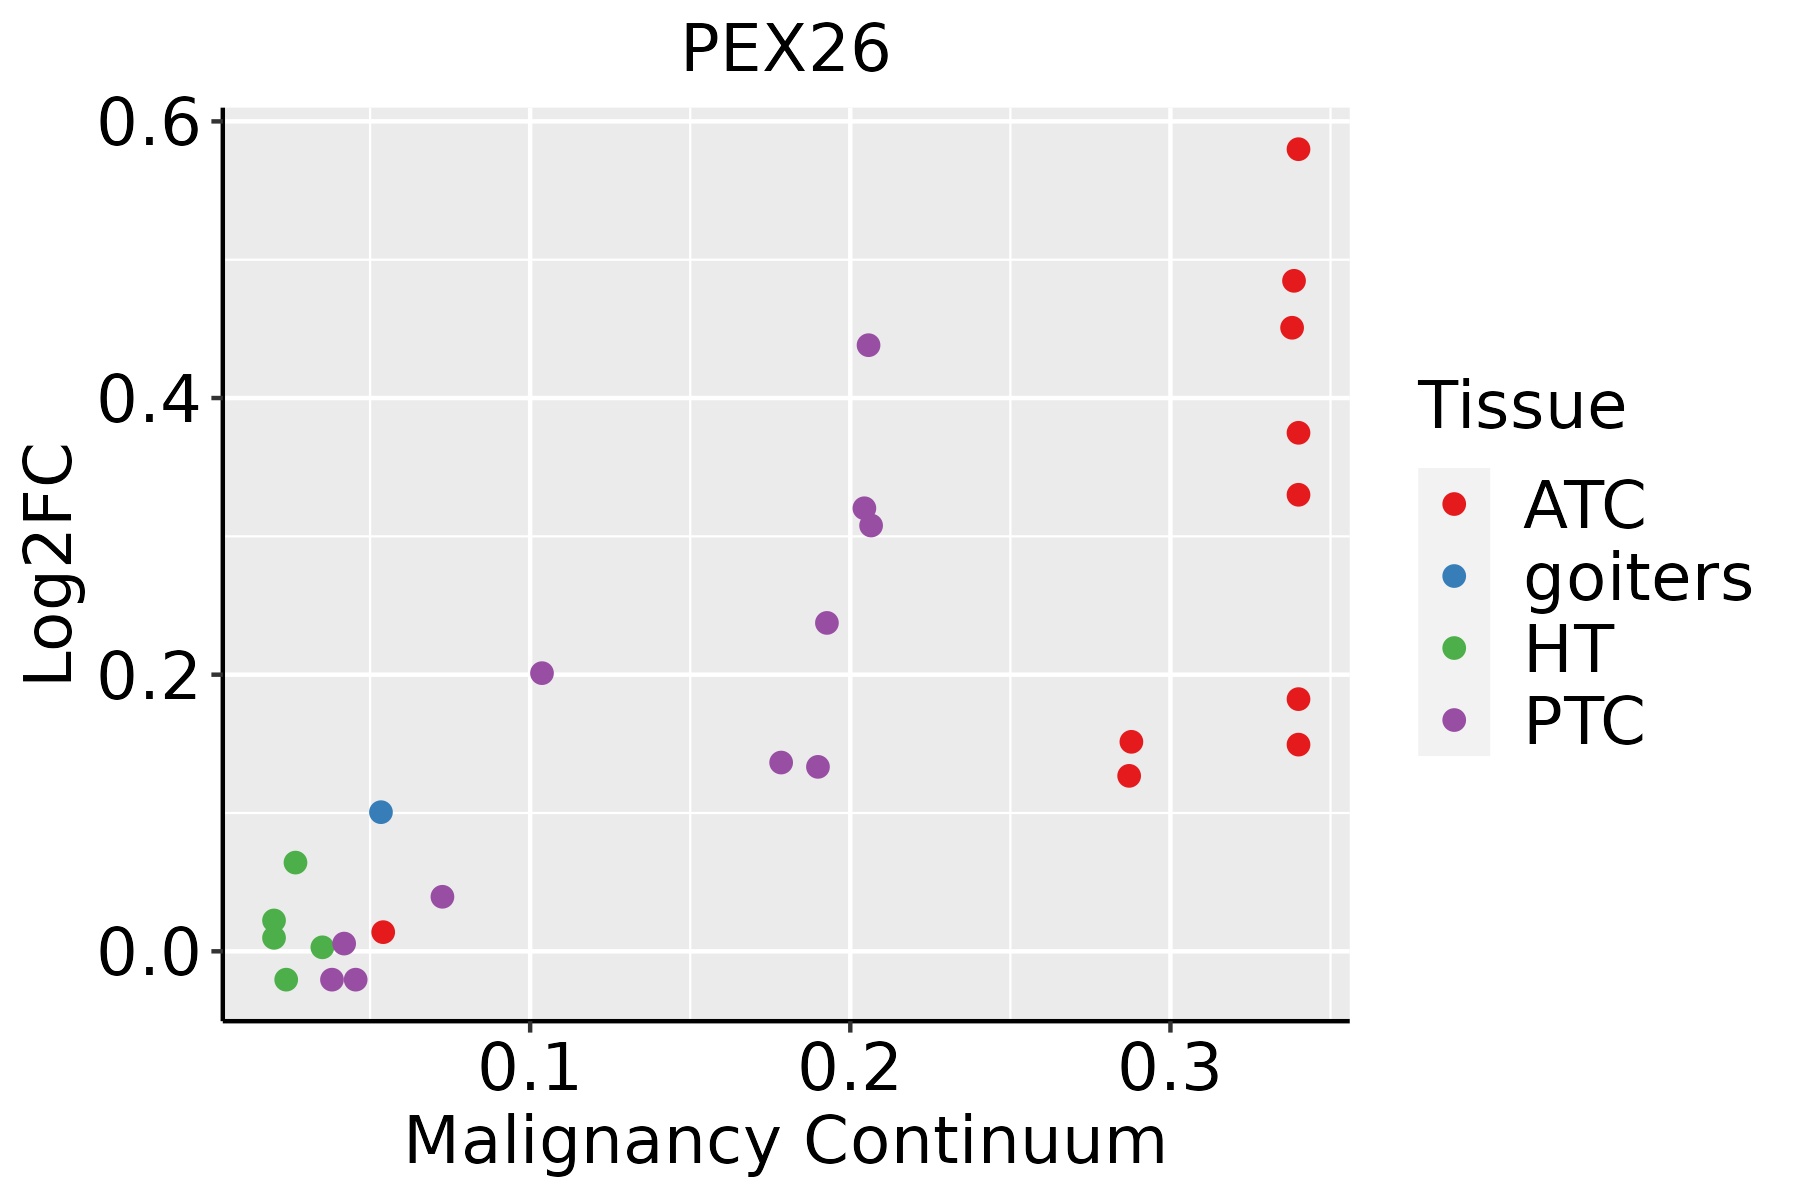 | ATC: Anaplastic thyroid cancer |
| HT: Hashimoto's thyroiditis | ||
| PTC: Papillary thyroid cancer |
| ∗log2FC in expression of this searched gene in stem-like cells from each diseased tissue sample relative to stem-like cells in normal samples in each tissue plotted against the malignancy continuum. Samples are colored based on if they are from different disease stage. |
Top |
Malignant transformation related pathway analysis |
| Find out the enriched GO biological processes and KEGG pathways involved in transition from healthy to precancer to cancer |
| Tissue | Disease Stage | Enriched GO biological Processes |
| Colorectum | AD |  |
| Colorectum | SER |  |
| Colorectum | MSS |  |
| Colorectum | MSI-H |  |
| Colorectum | FAP |  |
| ∗Top 15 enriched GO BP terms are showed in the bar plot of each disease state in each tissue. Each row represents a significant GO biological process which is colored according to the -log10(p.adjust). |
| Page: 1 2 3 4 5 6 7 8 9 |
| GO ID | Tissue | Disease Stage | Description | Gene Ratio | Bg Ratio | pvalue | p.adjust | Count |
| GO:0072594 | Colorectum | AD | establishment of protein localization to organelle | 148/3918 | 422/18723 | 7.95e-12 | 1.04e-09 | 148 |
| GO:0090150 | Colorectum | AD | establishment of protein localization to membrane | 100/3918 | 260/18723 | 6.01e-11 | 6.33e-09 | 100 |
| GO:0006605 | Colorectum | AD | protein targeting | 105/3918 | 314/18723 | 1.39e-07 | 6.44e-06 | 105 |
| GO:0017038 | Colorectum | AD | protein import | 67/3918 | 206/18723 | 6.34e-05 | 1.05e-03 | 67 |
| GO:0071806 | Colorectum | AD | protein transmembrane transport | 21/3918 | 59/18723 | 6.58e-03 | 4.08e-02 | 21 |
| GO:00725941 | Colorectum | SER | establishment of protein localization to organelle | 111/2897 | 422/18723 | 4.98e-09 | 4.49e-07 | 111 |
| GO:00901501 | Colorectum | SER | establishment of protein localization to membrane | 68/2897 | 260/18723 | 5.55e-06 | 2.01e-04 | 68 |
| GO:00066051 | Colorectum | SER | protein targeting | 76/2897 | 314/18723 | 3.19e-05 | 8.47e-04 | 76 |
| GO:00170381 | Colorectum | SER | protein import | 49/2897 | 206/18723 | 1.12e-03 | 1.29e-02 | 49 |
| GO:00718061 | Colorectum | SER | protein transmembrane transport | 17/2897 | 59/18723 | 6.64e-03 | 4.69e-02 | 17 |
| GO:00901504 | Colorectum | FAP | establishment of protein localization to membrane | 69/2622 | 260/18723 | 6.40e-08 | 4.54e-06 | 69 |
| GO:00725944 | Colorectum | FAP | establishment of protein localization to organelle | 96/2622 | 422/18723 | 6.63e-07 | 3.20e-05 | 96 |
| GO:00066054 | Colorectum | FAP | protein targeting | 74/2622 | 314/18723 | 3.21e-06 | 1.17e-04 | 74 |
| GO:00170384 | Colorectum | FAP | protein import | 47/2622 | 206/18723 | 4.10e-04 | 4.94e-03 | 47 |
| GO:0006612 | Colorectum | FAP | protein targeting to membrane | 30/2622 | 131/18723 | 3.95e-03 | 2.75e-02 | 30 |
| GO:00650021 | Colorectum | FAP | intracellular protein transmembrane transport | 14/2622 | 51/18723 | 8.70e-03 | 4.98e-02 | 14 |
| GO:0072594110 | Esophagus | ESCC | establishment of protein localization to organelle | 311/8552 | 422/18723 | 3.02e-32 | 2.13e-29 | 311 |
| GO:0006605111 | Esophagus | ESCC | protein targeting | 229/8552 | 314/18723 | 4.93e-23 | 1.01e-20 | 229 |
| GO:0090150110 | Esophagus | ESCC | establishment of protein localization to membrane | 182/8552 | 260/18723 | 1.27e-15 | 8.19e-14 | 182 |
| GO:001703818 | Esophagus | ESCC | protein import | 149/8552 | 206/18723 | 5.90e-15 | 3.31e-13 | 149 |
| Page: 1 2 3 4 |
| Pathway ID | Tissue | Disease Stage | Description | Gene Ratio | Bg Ratio | pvalue | p.adjust | qvalue | Count |
| hsa041467 | Esophagus | ESCC | Peroxisome | 55/4205 | 82/8465 | 1.04e-03 | 3.27e-03 | 1.68e-03 | 55 |
| hsa0414612 | Esophagus | ESCC | Peroxisome | 55/4205 | 82/8465 | 1.04e-03 | 3.27e-03 | 1.68e-03 | 55 |
| hsa041464 | Liver | HCC | Peroxisome | 58/4020 | 82/8465 | 1.57e-05 | 1.05e-04 | 5.85e-05 | 58 |
| hsa041465 | Liver | HCC | Peroxisome | 58/4020 | 82/8465 | 1.57e-05 | 1.05e-04 | 5.85e-05 | 58 |
| hsa041466 | Oral cavity | OSCC | Peroxisome | 47/3704 | 82/8465 | 9.01e-03 | 2.01e-02 | 1.03e-02 | 47 |
| hsa0414611 | Oral cavity | OSCC | Peroxisome | 47/3704 | 82/8465 | 9.01e-03 | 2.01e-02 | 1.03e-02 | 47 |
| hsa0414621 | Oral cavity | LP | Peroxisome | 33/2418 | 82/8465 | 1.48e-02 | 4.69e-02 | 3.03e-02 | 33 |
| hsa0414631 | Oral cavity | LP | Peroxisome | 33/2418 | 82/8465 | 1.48e-02 | 4.69e-02 | 3.03e-02 | 33 |
| Page: 1 |
Top |
Cell-cell communication analysis |
| Identification of potential cell-cell interactions between two cell types and their ligand-receptor pairs for different disease states |
| Ligand | Receptor | LRpair | Pathway | Tissue | Disease Stage |
| Page: 1 |
Top |
Single-cell gene regulatory network inference analysis |
| Find out the significant the regulons (TFs) and the target genes of each regulon across cell types for different disease states |
| TF | Cell Type | Tissue | Disease Stage | Target Gene | RSS | Regulon Activity |
| ∗The dot plots of a searched regulon are shown for all cell subpopulations in each disease state of each tissue based on the regulon specific score inferred using pySCENIC and by calculating the average expression. |
| Page: 1 |
Top |
Somatic mutation of malignant transformation related genes |
| Annotation of somatic variants for genes involved in malignant transformation |
| Hugo Symbol | Variant Class | Variant Classification | dbSNP RS | HGVSc | HGVSp | HGVSp Short | SWISSPROT | BIOTYPE | SIFT | PolyPhen | Tumor Sample Barcode | Tissue | Histology | Sex | Age | Stage | Therapy Types | Drugs | Outcome |
| PEX26 | SNV | Missense_Mutation | c.288N>A | p.Met96Ile | p.M96I | Q7Z412 | protein_coding | deleterious(0.01) | probably_damaging(0.995) | TCGA-A2-A04R-01 | Breast | breast invasive carcinoma | Female | <65 | I/II | Chemotherapy | taxol | SD | |
| PEX26 | SNV | Missense_Mutation | c.257N>C | p.Cys86Ser | p.C86S | Q7Z412 | protein_coding | tolerated(0.06) | benign(0.332) | TCGA-E9-A244-01 | Breast | breast invasive carcinoma | Female | <65 | I/II | Chemotherapy | cyclophosphamide | SD | |
| PEX26 | insertion | In_Frame_Ins | novel | c.665_666insGGGACTGCAGCATTCTTTTATACAGCAAAATGC | p.Gly223_Ser224insLeuGlnHisSerPheIleGlnGlnAsnAlaGly | p.G223_S224insLQHSFIQQNAG | Q7Z412 | protein_coding | TCGA-A2-A04Y-01 | Breast | breast invasive carcinoma | Female | <65 | I/II | Chemotherapy | cytoxan | SD | ||
| PEX26 | insertion | Nonsense_Mutation | novel | c.791_792insTTGCAAGAGTATGTGCAGTTAAGGAATGAAGGCTTTAG | p.Leu265CysfsTer7 | p.L265Cfs*7 | Q7Z412 | protein_coding | TCGA-AN-A041-01 | Breast | breast invasive carcinoma | Female | <65 | I/II | Unknown | Unknown | SD | ||
| PEX26 | SNV | Missense_Mutation | rs774880307 | c.905N>A | p.Arg302His | p.R302H | Q7Z412 | protein_coding | deleterious(0.02) | benign(0.001) | TCGA-2W-A8YY-01 | Cervix | cervical & endocervical cancer | Female | <65 | I/II | Chemotherapy | cisplatin | CR |
| PEX26 | SNV | Missense_Mutation | c.356A>C | p.Lys119Thr | p.K119T | Q7Z412 | protein_coding | deleterious(0) | probably_damaging(0.979) | TCGA-A6-6141-01 | Colorectum | colon adenocarcinoma | Male | <65 | I/II | Chemotherapy | 5-fu | SD | |
| PEX26 | SNV | Missense_Mutation | rs757411841 | c.716N>C | p.Leu239Pro | p.L239P | Q7Z412 | protein_coding | deleterious(0.01) | probably_damaging(0.958) | TCGA-AA-3811-01 | Colorectum | colon adenocarcinoma | Female | >=65 | III/IV | Unknown | Unknown | PD |
| PEX26 | SNV | Missense_Mutation | c.850N>A | p.Ala284Thr | p.A284T | Q7Z412 | protein_coding | tolerated(0.33) | benign(0.043) | TCGA-AA-A010-01 | Colorectum | colon adenocarcinoma | Female | <65 | I/II | Chemotherapy | folinic | CR | |
| PEX26 | SNV | Missense_Mutation | novel | c.343A>C | p.Lys115Gln | p.K115Q | Q7Z412 | protein_coding | tolerated(0.08) | benign(0.241) | TCGA-AG-A002-01 | Colorectum | rectum adenocarcinoma | Male | <65 | I/II | Unknown | Unknown | SD |
| PEX26 | SNV | Missense_Mutation | rs759680122 | c.293G>A | p.Arg98Gln | p.R98Q | Q7Z412 | protein_coding | tolerated(0.31) | probably_damaging(0.999) | TCGA-AJ-A3EK-01 | Endometrium | uterine corpus endometrioid carcinoma | Female | <65 | I/II | Chemotherapy | carboplatin | CR |
| Page: 1 2 3 |
Top |
Related drugs of malignant transformation related genes |
| Identification of chemicals and drugs interact with genes involved in malignant transfromation |
| (DGIdb 4.0) |
| Entrez ID | Symbol | Category | Interaction Types | Drug Claim Name | Drug Name | PMIDs |
| Page: 1 |

Copyright 2023-Present -The University of Texas Health Science Center at Houston |