
|
|||||
|
 | |
| |
| |
| |
| |
| |
|
Gene: PELP1 |
Gene summary for PELP1 |
| Gene information | Species | Human | Gene symbol | PELP1 | Gene ID | 27043 |
| Gene name | proline, glutamate and leucine rich protein 1 | |
| Gene Alias | MNAR | |
| Cytomap | 17p13.2 | |
| Gene Type | protein-coding | GO ID | GO:0006139 | UniProtAcc | B4DEX7 |
Top |
Malignant transformation analysis |
| Identification of the aberrant gene expression in precancerous and cancerous lesions by comparing the gene expression of stem-like cells in diseased tissues with normal stem cells |
| Entrez ID | Symbol | Replicates | Species | Organ | Tissue | Adj P-value | Log2FC | Malignancy |
| 27043 | PELP1 | P20T-E | Human | Esophagus | ESCC | 3.46e-12 | 1.95e-01 | 0.1124 |
| 27043 | PELP1 | P21T-E | Human | Esophagus | ESCC | 1.10e-21 | 3.85e-01 | 0.1617 |
| 27043 | PELP1 | P22T-E | Human | Esophagus | ESCC | 6.95e-27 | 4.04e-01 | 0.1236 |
| 27043 | PELP1 | P23T-E | Human | Esophagus | ESCC | 6.77e-12 | 2.98e-01 | 0.108 |
| 27043 | PELP1 | P24T-E | Human | Esophagus | ESCC | 1.71e-13 | 4.30e-01 | 0.1287 |
| 27043 | PELP1 | P26T-E | Human | Esophagus | ESCC | 1.21e-18 | 4.17e-01 | 0.1276 |
| 27043 | PELP1 | P27T-E | Human | Esophagus | ESCC | 9.69e-19 | 4.73e-01 | 0.1055 |
| 27043 | PELP1 | P28T-E | Human | Esophagus | ESCC | 1.42e-28 | 5.73e-01 | 0.1149 |
| 27043 | PELP1 | P30T-E | Human | Esophagus | ESCC | 8.43e-14 | 5.60e-01 | 0.137 |
| 27043 | PELP1 | P31T-E | Human | Esophagus | ESCC | 1.28e-19 | 4.52e-01 | 0.1251 |
| 27043 | PELP1 | P32T-E | Human | Esophagus | ESCC | 8.52e-30 | 5.98e-01 | 0.1666 |
| 27043 | PELP1 | P36T-E | Human | Esophagus | ESCC | 1.09e-12 | 3.90e-01 | 0.1187 |
| 27043 | PELP1 | P37T-E | Human | Esophagus | ESCC | 1.29e-17 | 4.62e-01 | 0.1371 |
| 27043 | PELP1 | P38T-E | Human | Esophagus | ESCC | 6.74e-04 | 2.01e-01 | 0.127 |
| 27043 | PELP1 | P39T-E | Human | Esophagus | ESCC | 6.52e-08 | 2.30e-01 | 0.0894 |
| 27043 | PELP1 | P40T-E | Human | Esophagus | ESCC | 3.82e-06 | 1.22e-01 | 0.109 |
| 27043 | PELP1 | P42T-E | Human | Esophagus | ESCC | 4.47e-16 | 4.91e-01 | 0.1175 |
| 27043 | PELP1 | P44T-E | Human | Esophagus | ESCC | 4.91e-10 | 1.66e-01 | 0.1096 |
| 27043 | PELP1 | P47T-E | Human | Esophagus | ESCC | 7.15e-16 | 1.56e-01 | 0.1067 |
| 27043 | PELP1 | P48T-E | Human | Esophagus | ESCC | 5.46e-09 | 2.65e-01 | 0.0959 |
| Page: 1 2 3 4 5 6 |
| Tissue | Expression Dynamics | Abbreviation |
| Esophagus | 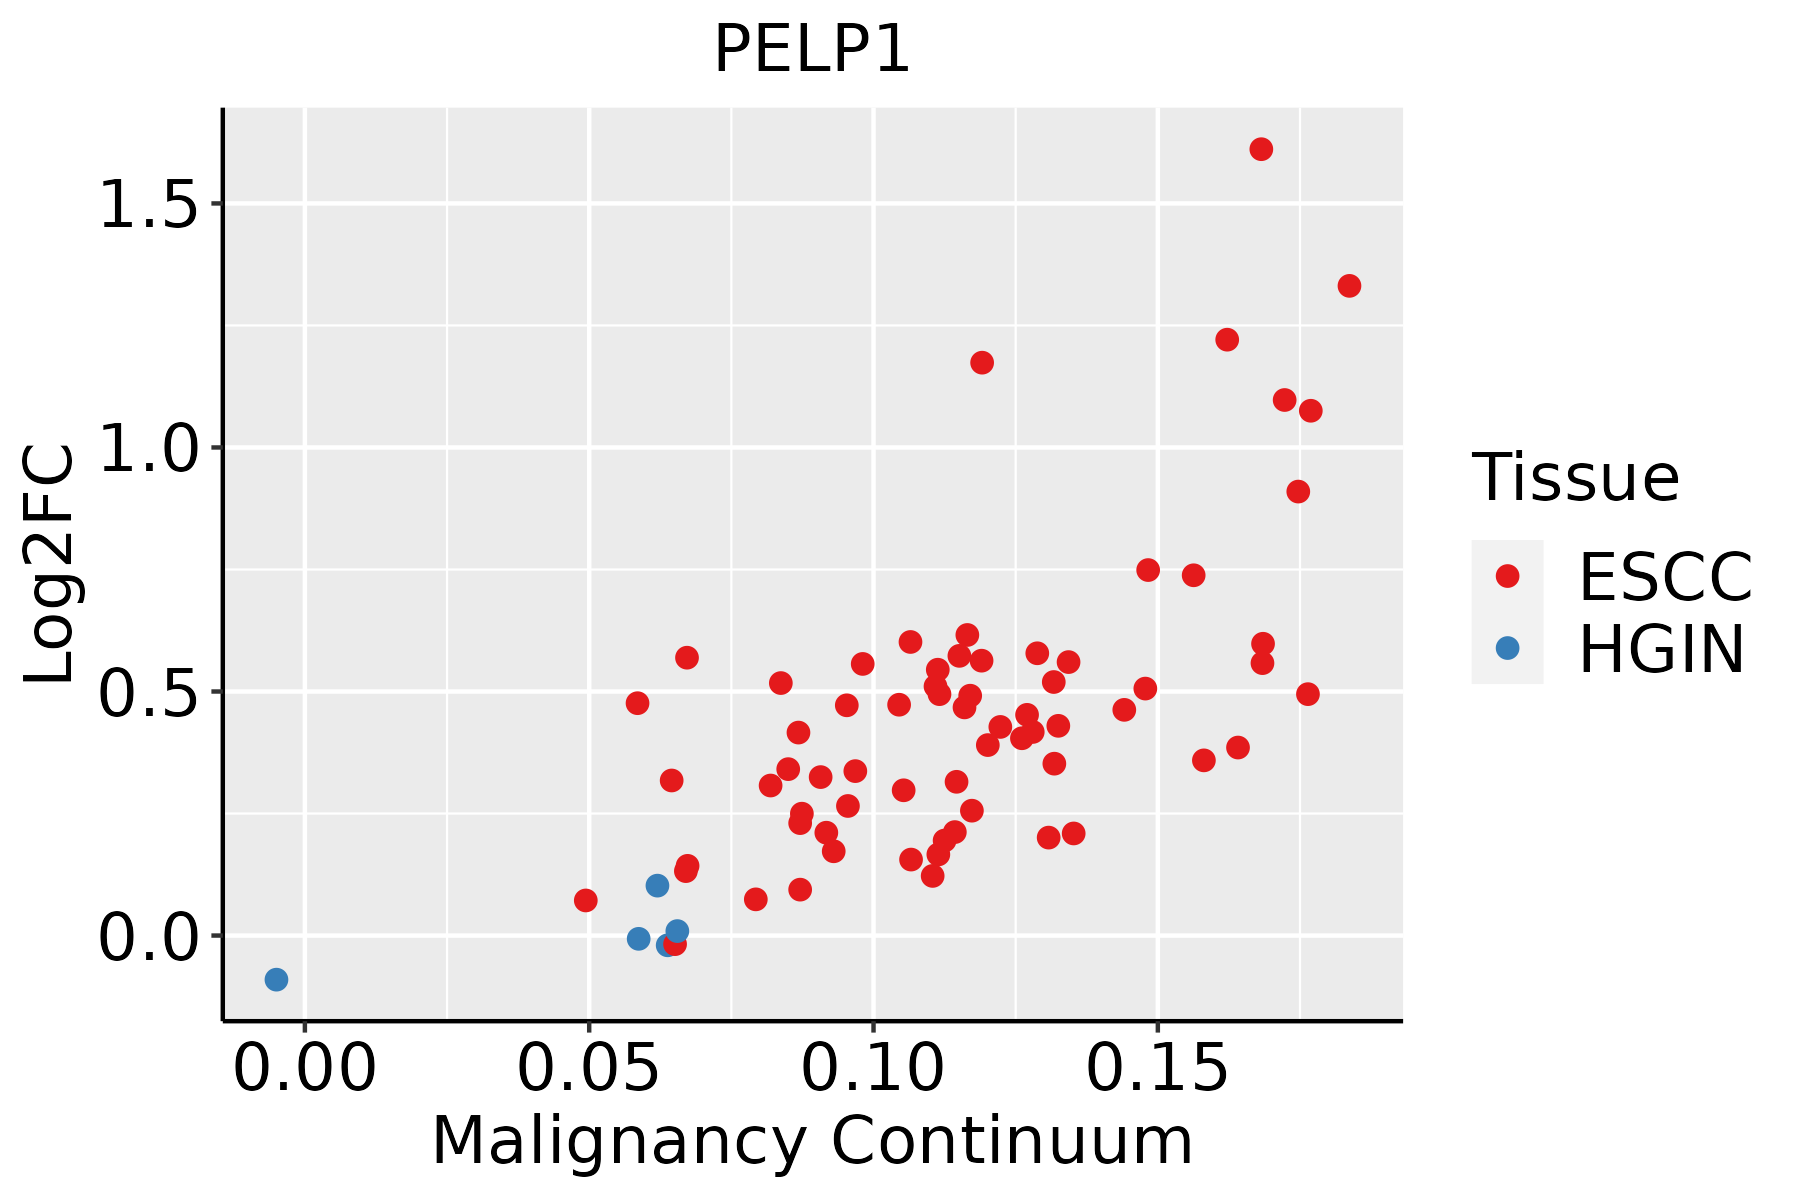 | ESCC: Esophageal squamous cell carcinoma |
| HGIN: High-grade intraepithelial neoplasias | ||
| LGIN: Low-grade intraepithelial neoplasias | ||
| Liver | 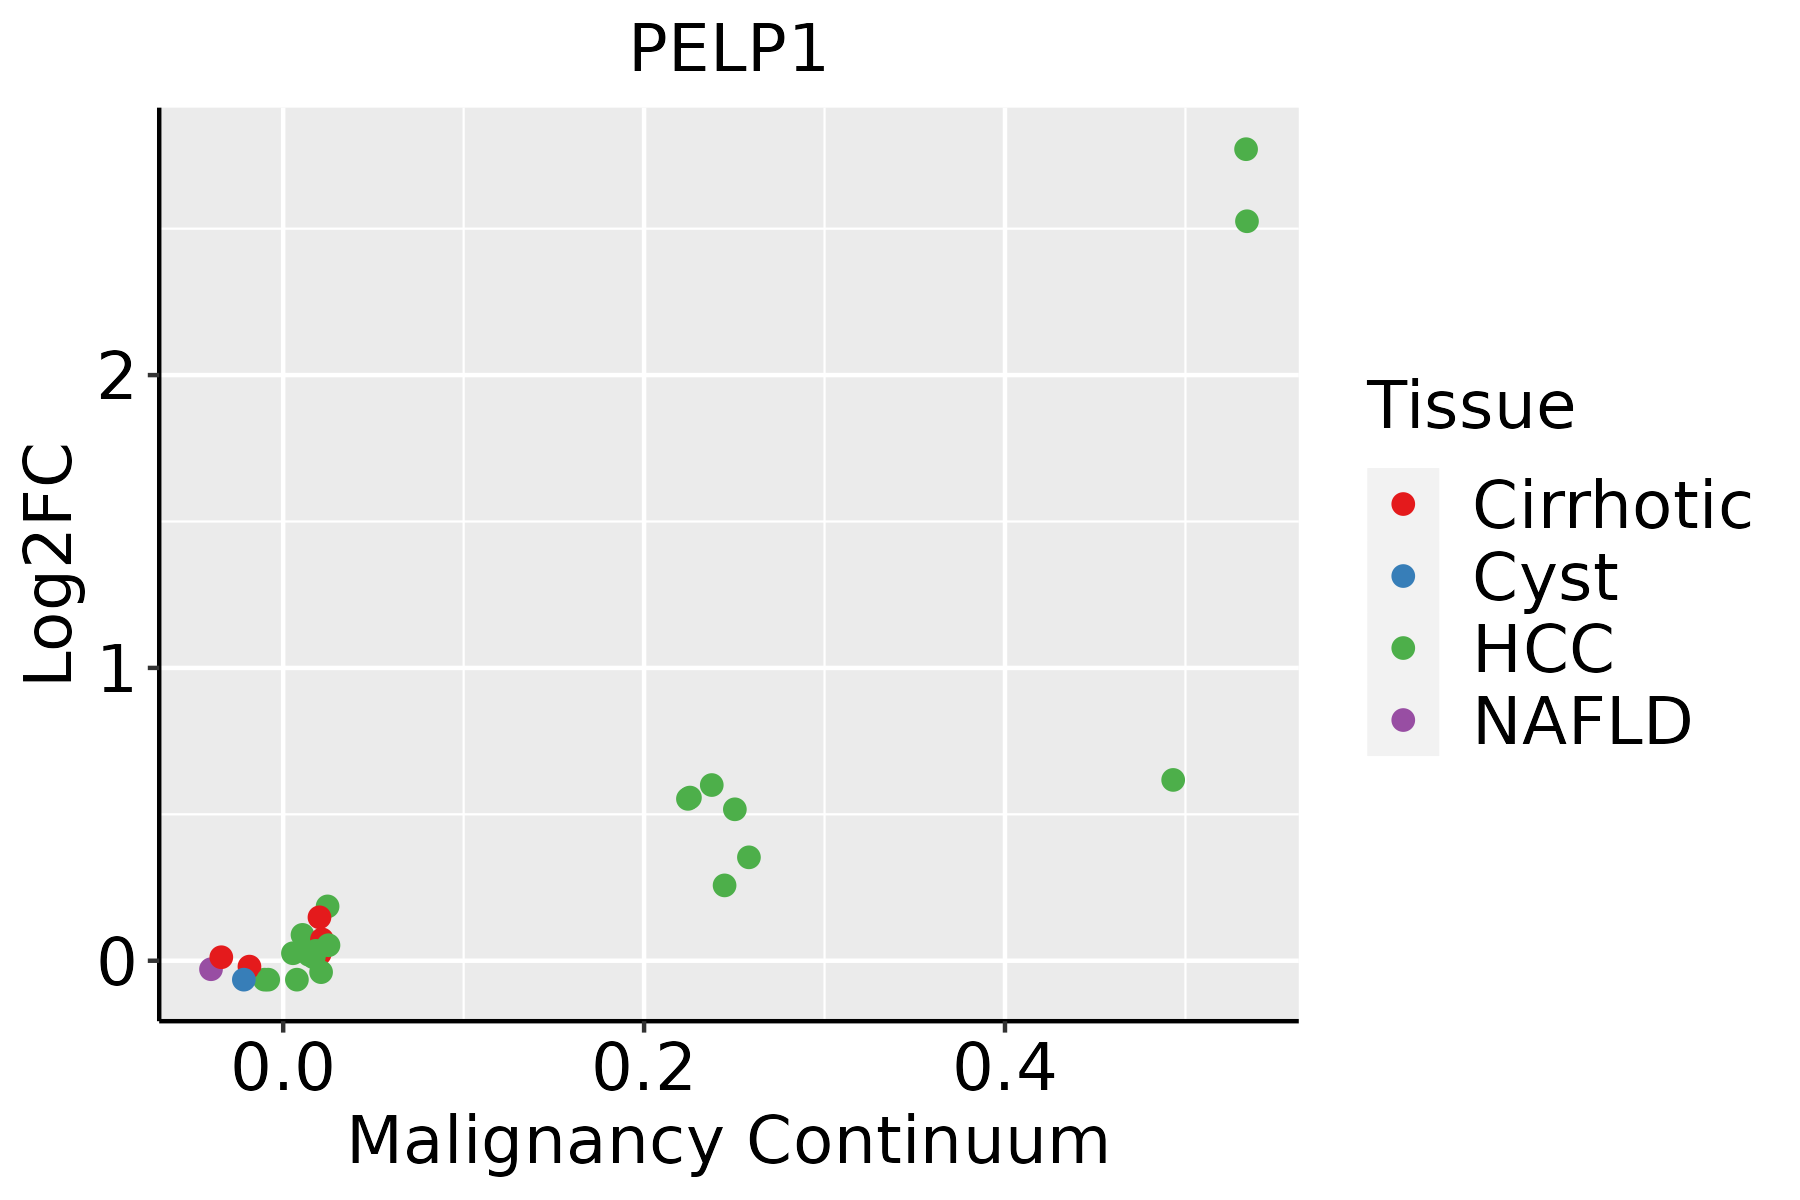 | HCC: Hepatocellular carcinoma |
| NAFLD: Non-alcoholic fatty liver disease | ||
| Oral Cavity | 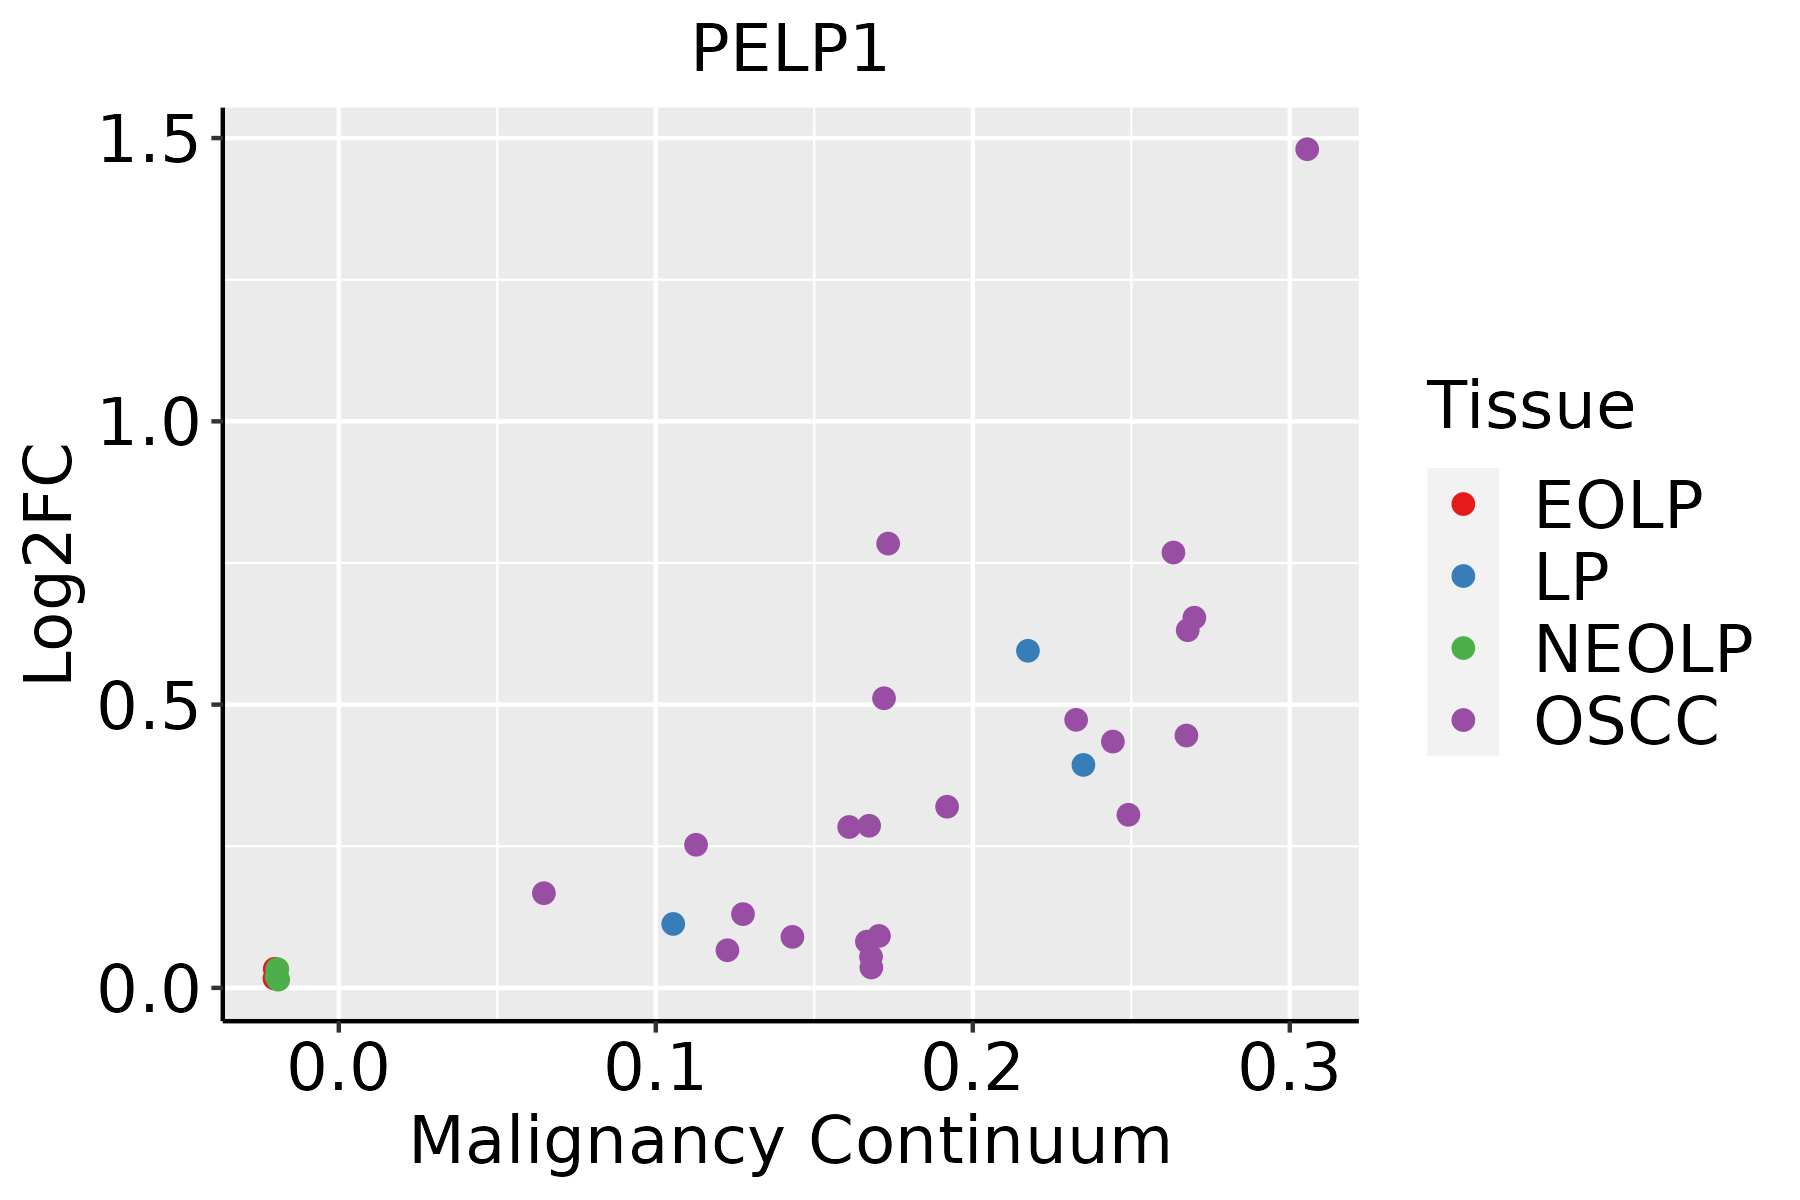 | EOLP: Erosive Oral lichen planus |
| LP: leukoplakia | ||
| NEOLP: Non-erosive oral lichen planus | ||
| OSCC: Oral squamous cell carcinoma | ||
| Skin |  | AK: Actinic keratosis |
| cSCC: Cutaneous squamous cell carcinoma | ||
| SCCIS:squamous cell carcinoma in situ | ||
| Thyroid | 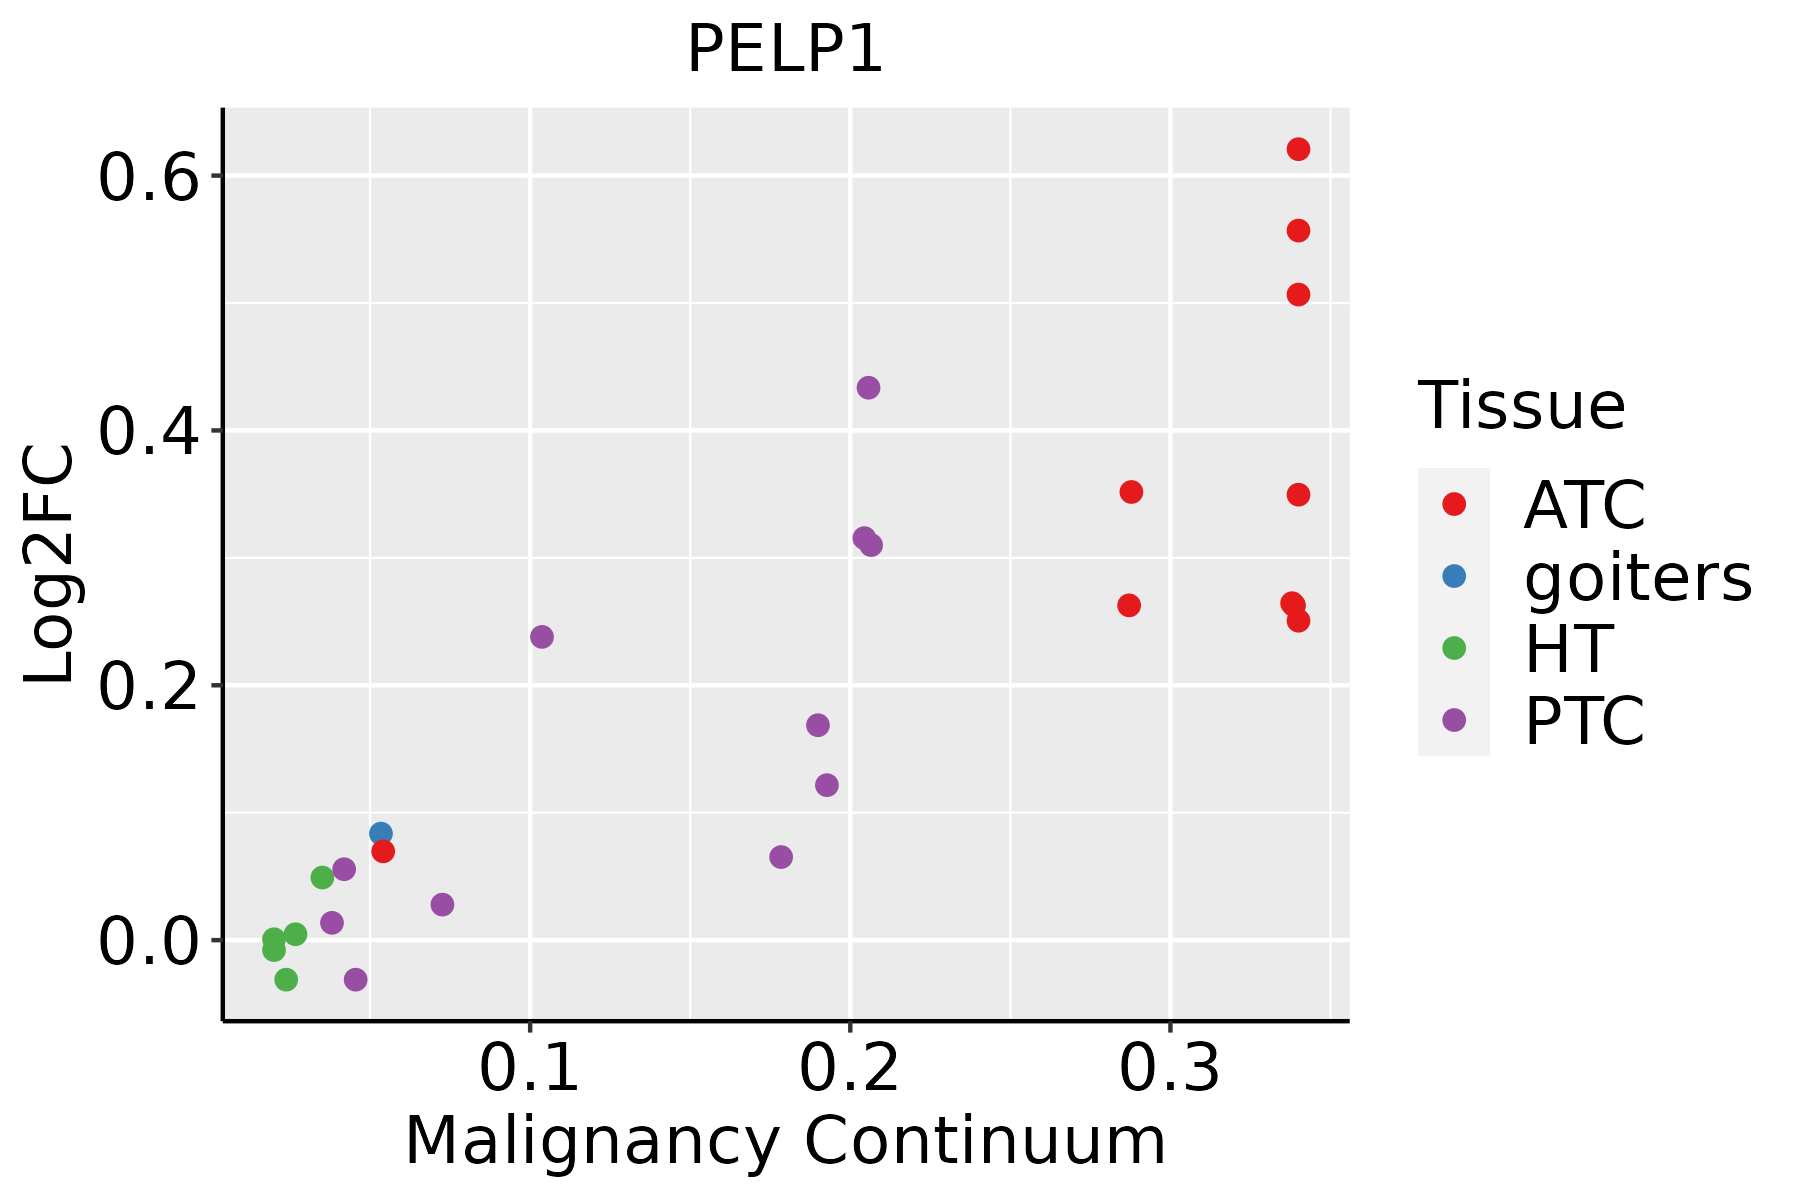 | ATC: Anaplastic thyroid cancer |
| HT: Hashimoto's thyroiditis | ||
| PTC: Papillary thyroid cancer |
| ∗log2FC in expression of this searched gene in stem-like cells from each diseased tissue sample relative to stem-like cells in normal samples in each tissue plotted against the malignancy continuum. Samples are colored based on if they are from different disease stage. |
Top |
Malignant transformation related pathway analysis |
| Find out the enriched GO biological processes and KEGG pathways involved in transition from healthy to precancer to cancer |
| Tissue | Disease Stage | Enriched GO biological Processes |
| Colorectum | AD |  |
| Colorectum | SER |  |
| Colorectum | MSS |  |
| Colorectum | MSI-H |  |
| Colorectum | FAP |  |
| ∗Top 15 enriched GO BP terms are showed in the bar plot of each disease state in each tissue. Each row represents a significant GO biological process which is colored according to the -log10(p.adjust). |
| Page: 1 2 3 4 5 6 7 8 9 |
| GO ID | Tissue | Disease Stage | Description | Gene Ratio | Bg Ratio | pvalue | p.adjust | Count |
| GO:00436275 | Esophagus | ESCC | response to estrogen | 45/8552 | 75/18723 | 8.75e-03 | 3.08e-02 | 45 |
| GO:0043627 | Liver | Cirrhotic | response to estrogen | 30/4634 | 75/18723 | 2.52e-03 | 1.51e-02 | 30 |
| GO:00436271 | Liver | HCC | response to estrogen | 44/7958 | 75/18723 | 3.44e-03 | 1.55e-02 | 44 |
| Page: 1 |
| Pathway ID | Tissue | Disease Stage | Description | Gene Ratio | Bg Ratio | pvalue | p.adjust | qvalue | Count |
| Page: 1 |
Top |
Cell-cell communication analysis |
| Identification of potential cell-cell interactions between two cell types and their ligand-receptor pairs for different disease states |
| Ligand | Receptor | LRpair | Pathway | Tissue | Disease Stage |
| Page: 1 |
Top |
Single-cell gene regulatory network inference analysis |
| Find out the significant the regulons (TFs) and the target genes of each regulon across cell types for different disease states |
| TF | Cell Type | Tissue | Disease Stage | Target Gene | RSS | Regulon Activity |
| ∗The dot plots of a searched regulon are shown for all cell subpopulations in each disease state of each tissue based on the regulon specific score inferred using pySCENIC and by calculating the average expression. |
| Page: 1 |
Top |
Somatic mutation of malignant transformation related genes |
| Annotation of somatic variants for genes involved in malignant transformation |
| Hugo Symbol | Variant Class | Variant Classification | dbSNP RS | HGVSc | HGVSp | HGVSp Short | SWISSPROT | BIOTYPE | SIFT | PolyPhen | Tumor Sample Barcode | Tissue | Histology | Sex | Age | Stage | Therapy Types | Drugs | Outcome |
| PELP1 | SNV | Missense_Mutation | novel | c.834N>C | p.Leu278Phe | p.L278F | protein_coding | tolerated(0.71) | probably_damaging(0.923) | TCGA-5L-AAT1-01 | Breast | breast invasive carcinoma | Female | <65 | III/IV | Hormone Therapy | letrozol | SD | |
| PELP1 | SNV | Missense_Mutation | novel | c.787C>T | p.Leu263Phe | p.L263F | protein_coding | tolerated(0.18) | probably_damaging(0.986) | TCGA-A7-A6VX-01 | Breast | breast invasive carcinoma | Female | >=65 | I/II | Chemotherapy | docetaxel | CR | |
| PELP1 | SNV | Missense_Mutation | novel | c.3479N>G | p.Ala1160Gly | p.A1160G | protein_coding | deleterious_low_confidence(0) | probably_damaging(0.994) | TCGA-AC-A8OQ-01 | Breast | breast invasive carcinoma | Female | >=65 | I/II | Unknown | Unknown | SD | |
| PELP1 | SNV | Missense_Mutation | c.1961N>T | p.Ala654Val | p.A654V | protein_coding | tolerated(0.42) | possibly_damaging(0.743) | TCGA-B6-A0I9-01 | Breast | breast invasive carcinoma | Female | <65 | III/IV | Unknown | Unknown | PD | ||
| PELP1 | SNV | Missense_Mutation | novel | c.1993N>C | p.Glu665Gln | p.E665Q | protein_coding | tolerated(0.26) | possibly_damaging(0.55) | TCGA-BH-A0B6-01 | Breast | breast invasive carcinoma | Female | <65 | I/II | Unknown | Unknown | SD | |
| PELP1 | SNV | Missense_Mutation | rs774281042 | c.3091N>C | p.Thr1031Pro | p.T1031P | protein_coding | tolerated_low_confidence(0.18) | benign(0) | TCGA-BH-A1F5-01 | Breast | breast invasive carcinoma | Female | <65 | I/II | Unknown | Unknown | SD | |
| PELP1 | SNV | Missense_Mutation | c.2155N>T | p.Gly719Cys | p.G719C | protein_coding | tolerated(0.1) | possibly_damaging(0.658) | TCGA-C8-A12M-01 | Breast | breast invasive carcinoma | Female | >=65 | I/II | Unknown | Unknown | SD | ||
| PELP1 | SNV | Missense_Mutation | c.1364T>C | p.Val455Ala | p.V455A | protein_coding | tolerated(0.13) | probably_damaging(0.941) | TCGA-D8-A1XK-01 | Breast | breast invasive carcinoma | Female | <65 | I/II | Chemotherapy | doxorubicine+cyclophosphamide | SD | ||
| PELP1 | insertion | In_Frame_Ins | novel | c.3496_3497insTCTGTTGCCCAGGCTGGAGTGCAGTGGCATGGTCTCAGCTCACTG | p.Pro1166delinsLeuCysCysProGlyTrpSerAlaValAlaTrpSerGlnLeuThrAla | p.P1166delinsLCCPGWSAVAWSQLTA | protein_coding | TCGA-A2-A0EM-01 | Breast | breast invasive carcinoma | Female | >=65 | I/II | Hormone Therapy | tamoxiphen | SD | |||
| PELP1 | insertion | Nonsense_Mutation | novel | c.1265_1266insGGCACAGCAGGAGGGGAGGTAGAAGAAG | p.Ile422MetfsTer8 | p.I422Mfs*8 | protein_coding | TCGA-AN-A041-01 | Breast | breast invasive carcinoma | Female | <65 | I/II | Unknown | Unknown | SD |
| Page: 1 2 3 4 5 6 7 8 9 10 |
Top |
Related drugs of malignant transformation related genes |
| Identification of chemicals and drugs interact with genes involved in malignant transfromation |
| (DGIdb 4.0) |
| Entrez ID | Symbol | Category | Interaction Types | Drug Claim Name | Drug Name | PMIDs |
| Page: 1 |

Copyright 2023-Present -The University of Texas Health Science Center at Houston |