
|
|||||
|
 | |
| |
| |
| |
| |
| |
|
Gene: PCYOX1 |
Gene summary for PCYOX1 |
| Gene information | Species | Human | Gene symbol | PCYOX1 | Gene ID | 51449 |
| Gene name | prenylcysteine oxidase 1 | |
| Gene Alias | PCL1 | |
| Cytomap | 2p13.3 | |
| Gene Type | protein-coding | GO ID | GO:0006508 | UniProtAcc | Q9UHG3 |
Top |
Malignant transformation analysis |
| Identification of the aberrant gene expression in precancerous and cancerous lesions by comparing the gene expression of stem-like cells in diseased tissues with normal stem cells |
| Entrez ID | Symbol | Replicates | Species | Organ | Tissue | Adj P-value | Log2FC | Malignancy |
| 51449 | PCYOX1 | LZE4T | Human | Esophagus | ESCC | 5.51e-13 | 6.50e-01 | 0.0811 |
| 51449 | PCYOX1 | LZE5T | Human | Esophagus | ESCC | 1.83e-07 | 1.51e-01 | 0.0514 |
| 51449 | PCYOX1 | LZE20T | Human | Esophagus | ESCC | 1.99e-05 | -2.55e-02 | 0.0662 |
| 51449 | PCYOX1 | LZE22T | Human | Esophagus | ESCC | 2.77e-07 | 3.03e-01 | 0.068 |
| 51449 | PCYOX1 | LZE24T | Human | Esophagus | ESCC | 7.06e-07 | 1.24e-01 | 0.0596 |
| 51449 | PCYOX1 | P1T-E | Human | Esophagus | ESCC | 3.71e-05 | 4.44e-01 | 0.0875 |
| 51449 | PCYOX1 | P2T-E | Human | Esophagus | ESCC | 1.44e-49 | 6.30e-01 | 0.1177 |
| 51449 | PCYOX1 | P4T-E | Human | Esophagus | ESCC | 7.26e-19 | 5.21e-01 | 0.1323 |
| 51449 | PCYOX1 | P5T-E | Human | Esophagus | ESCC | 1.37e-18 | 5.53e-02 | 0.1327 |
| 51449 | PCYOX1 | P8T-E | Human | Esophagus | ESCC | 4.58e-25 | 4.99e-01 | 0.0889 |
| 51449 | PCYOX1 | P9T-E | Human | Esophagus | ESCC | 4.17e-13 | 2.24e-01 | 0.1131 |
| 51449 | PCYOX1 | P10T-E | Human | Esophagus | ESCC | 1.12e-25 | 4.57e-01 | 0.116 |
| 51449 | PCYOX1 | P11T-E | Human | Esophagus | ESCC | 1.21e-07 | 6.53e-01 | 0.1426 |
| 51449 | PCYOX1 | P12T-E | Human | Esophagus | ESCC | 7.58e-22 | 5.24e-01 | 0.1122 |
| 51449 | PCYOX1 | P15T-E | Human | Esophagus | ESCC | 4.85e-19 | 5.78e-01 | 0.1149 |
| 51449 | PCYOX1 | P16T-E | Human | Esophagus | ESCC | 5.49e-23 | 4.44e-01 | 0.1153 |
| 51449 | PCYOX1 | P20T-E | Human | Esophagus | ESCC | 2.22e-17 | 5.53e-01 | 0.1124 |
| 51449 | PCYOX1 | P21T-E | Human | Esophagus | ESCC | 2.79e-33 | 7.39e-01 | 0.1617 |
| 51449 | PCYOX1 | P22T-E | Human | Esophagus | ESCC | 5.28e-34 | 6.38e-01 | 0.1236 |
| 51449 | PCYOX1 | P23T-E | Human | Esophagus | ESCC | 1.61e-19 | 5.07e-01 | 0.108 |
| Page: 1 2 3 4 5 6 7 8 |
| Tissue | Expression Dynamics | Abbreviation |
| Colorectum (GSE201348) |  | FAP: Familial adenomatous polyposis |
| CRC: Colorectal cancer | ||
| Colorectum (HTA11) |  | AD: Adenomas |
| SER: Sessile serrated lesions | ||
| MSI-H: Microsatellite-high colorectal cancer | ||
| MSS: Microsatellite stable colorectal cancer | ||
| Esophagus | 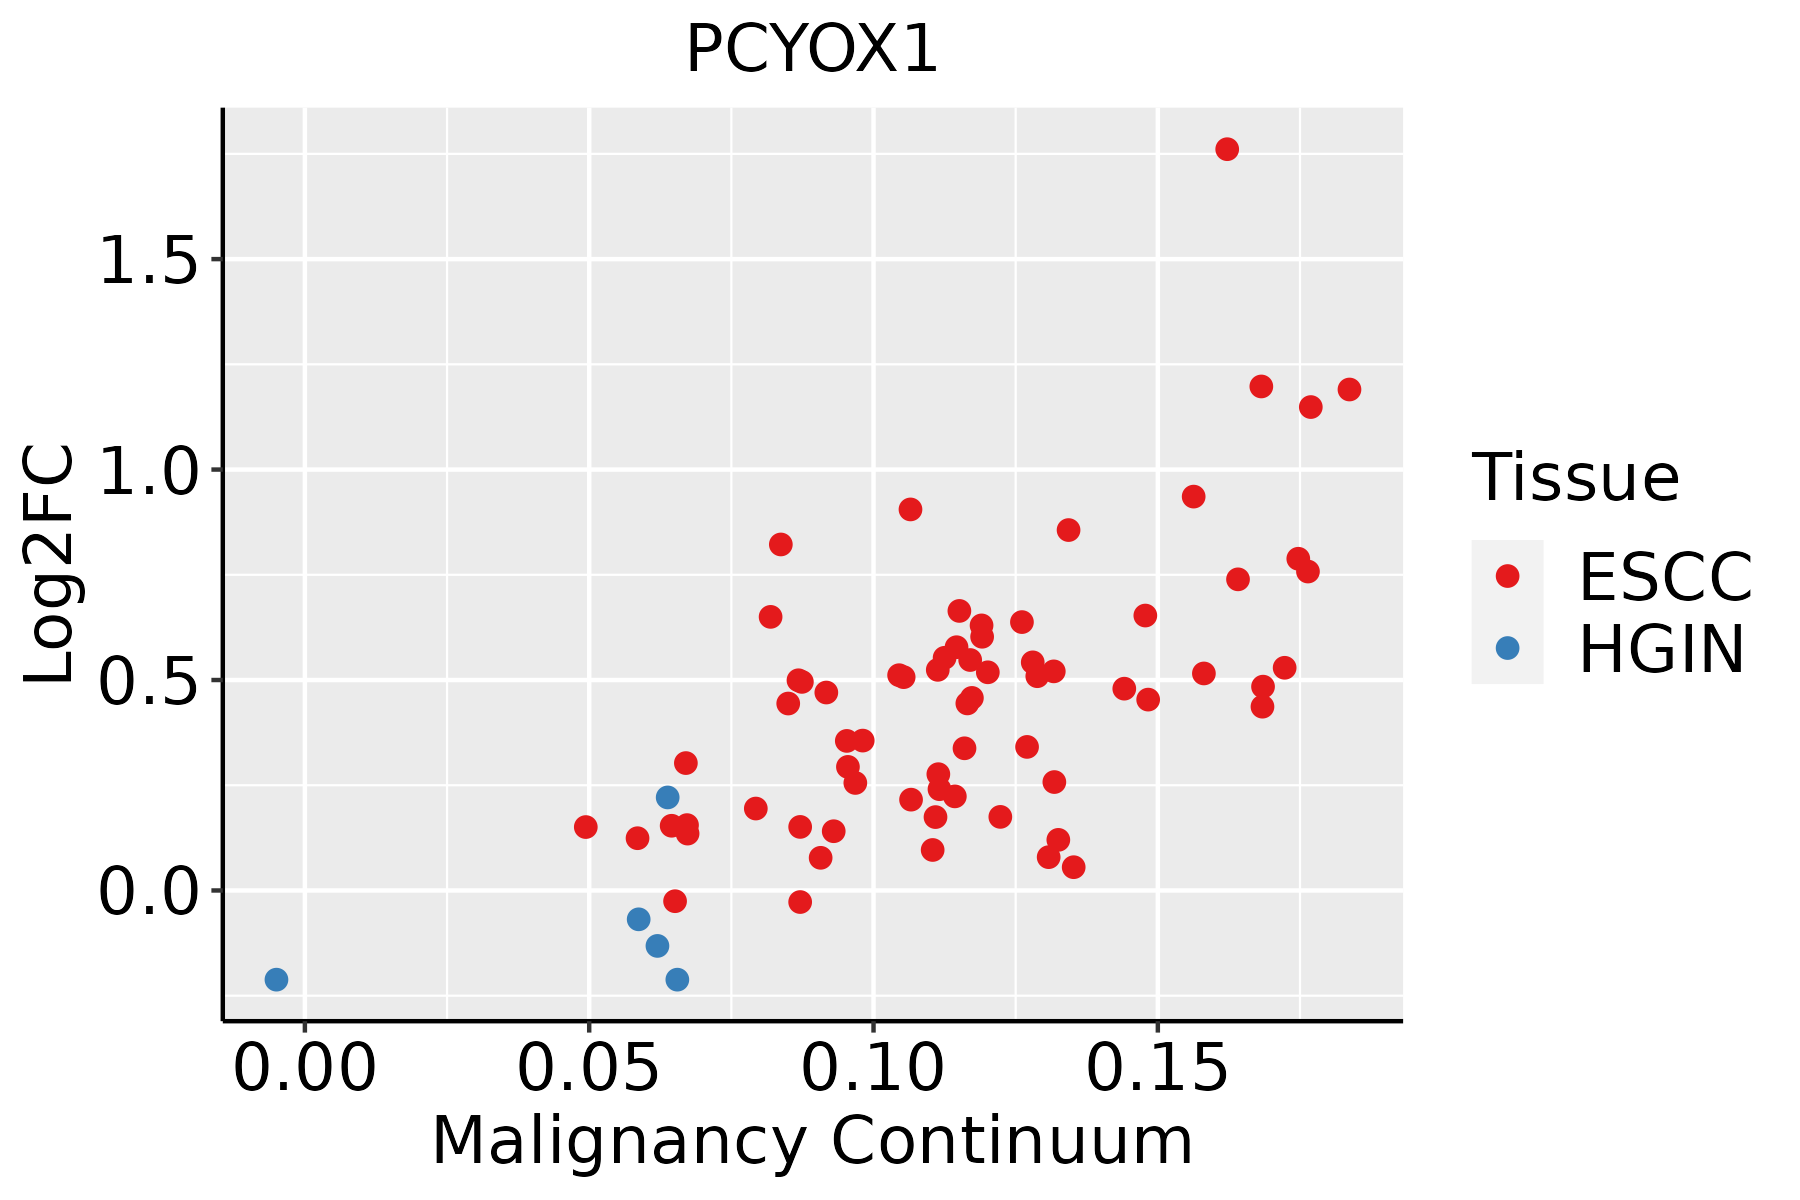 | ESCC: Esophageal squamous cell carcinoma |
| HGIN: High-grade intraepithelial neoplasias | ||
| LGIN: Low-grade intraepithelial neoplasias | ||
| Liver | 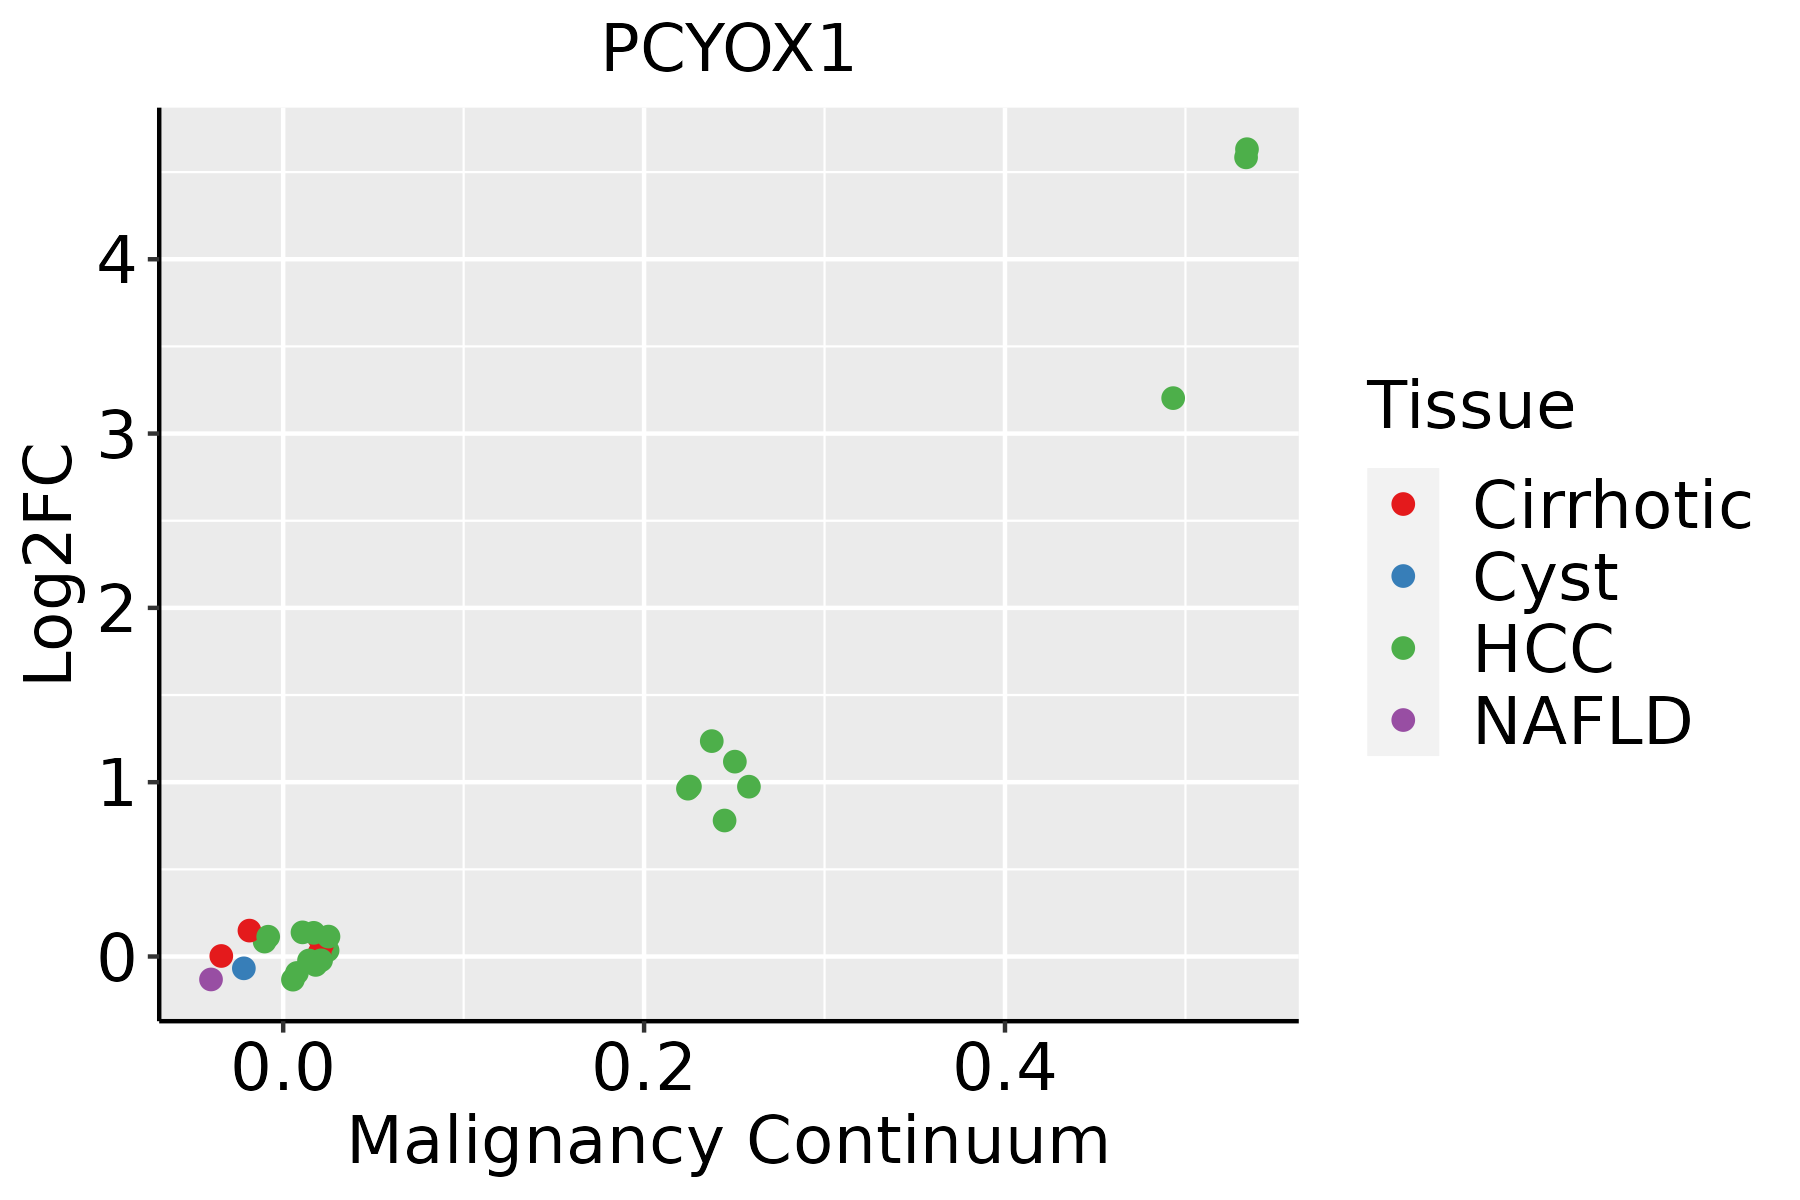 | HCC: Hepatocellular carcinoma |
| NAFLD: Non-alcoholic fatty liver disease | ||
| Oral Cavity | 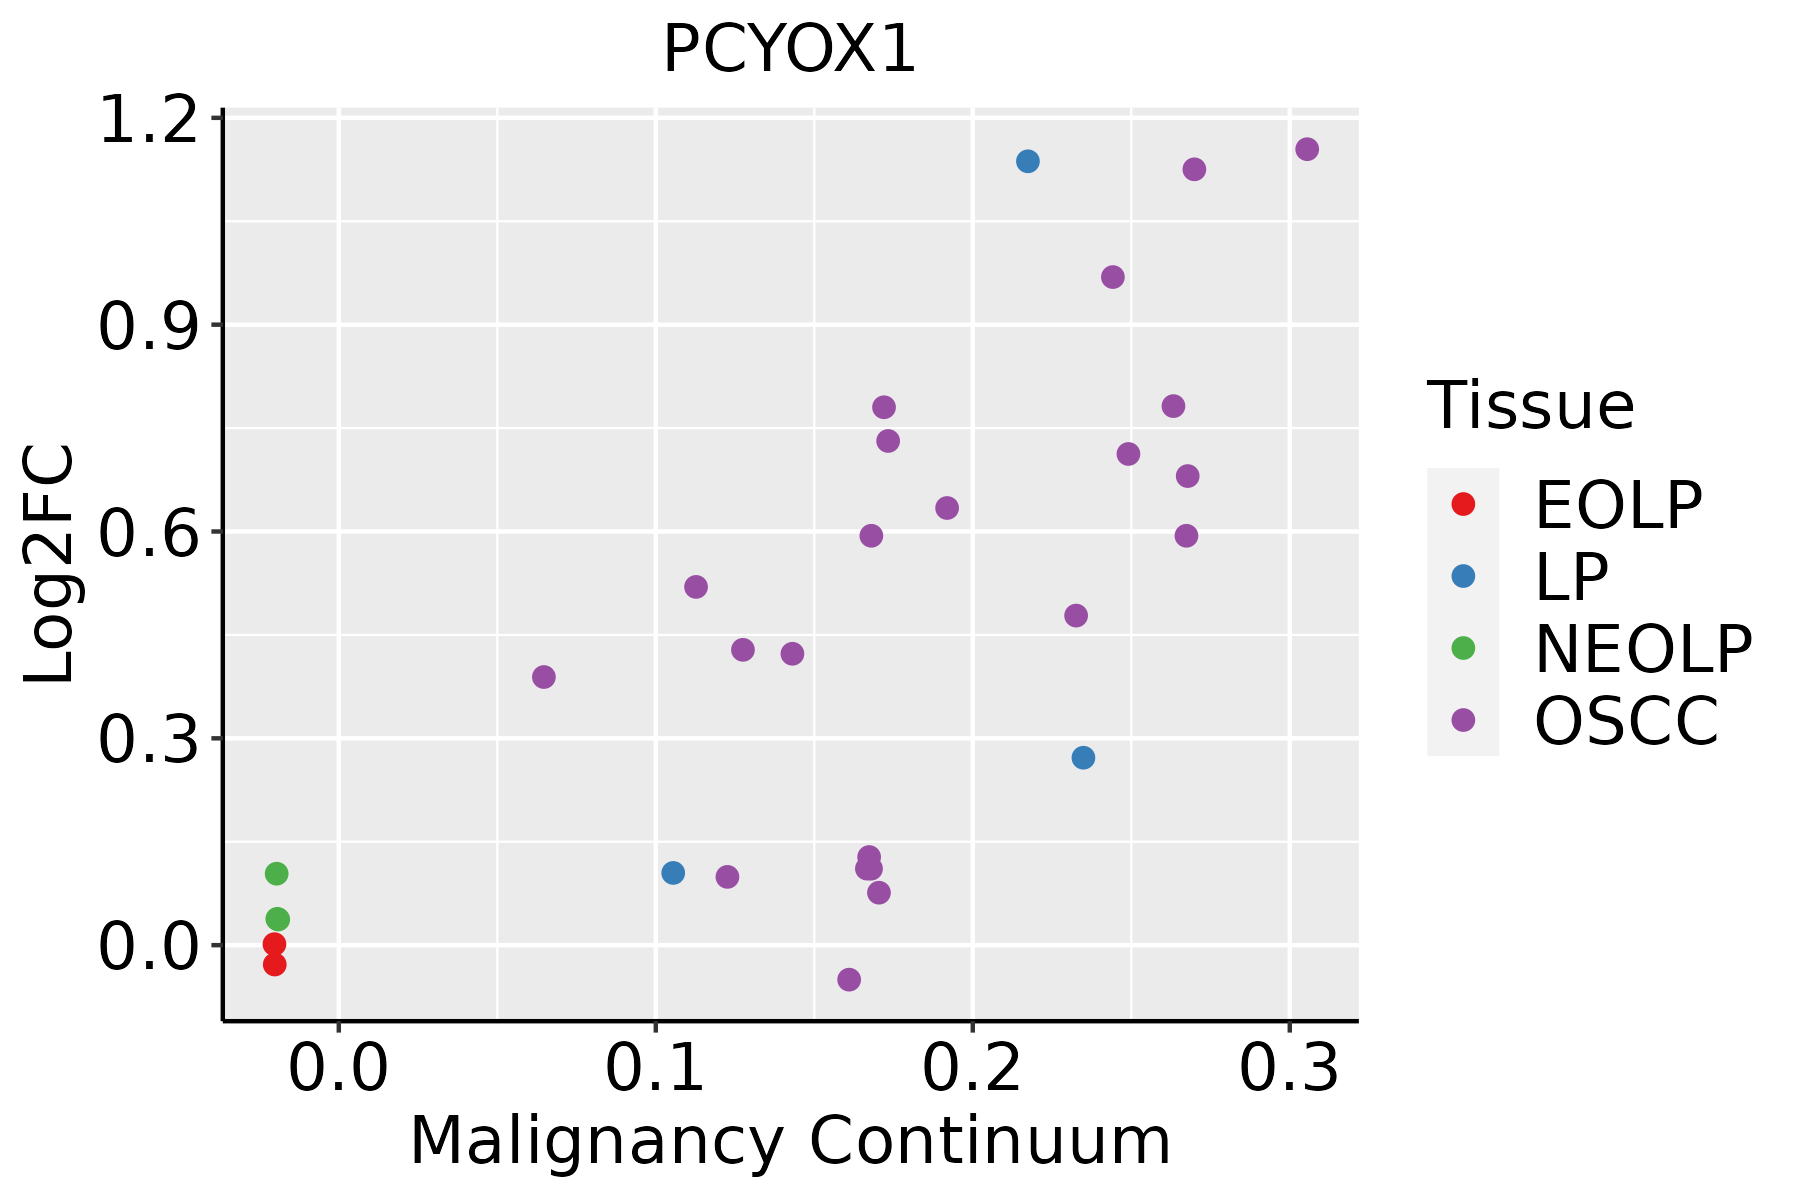 | EOLP: Erosive Oral lichen planus |
| LP: leukoplakia | ||
| NEOLP: Non-erosive oral lichen planus | ||
| OSCC: Oral squamous cell carcinoma | ||
| Prostate |  | BPH: Benign Prostatic Hyperplasia |
| Skin | 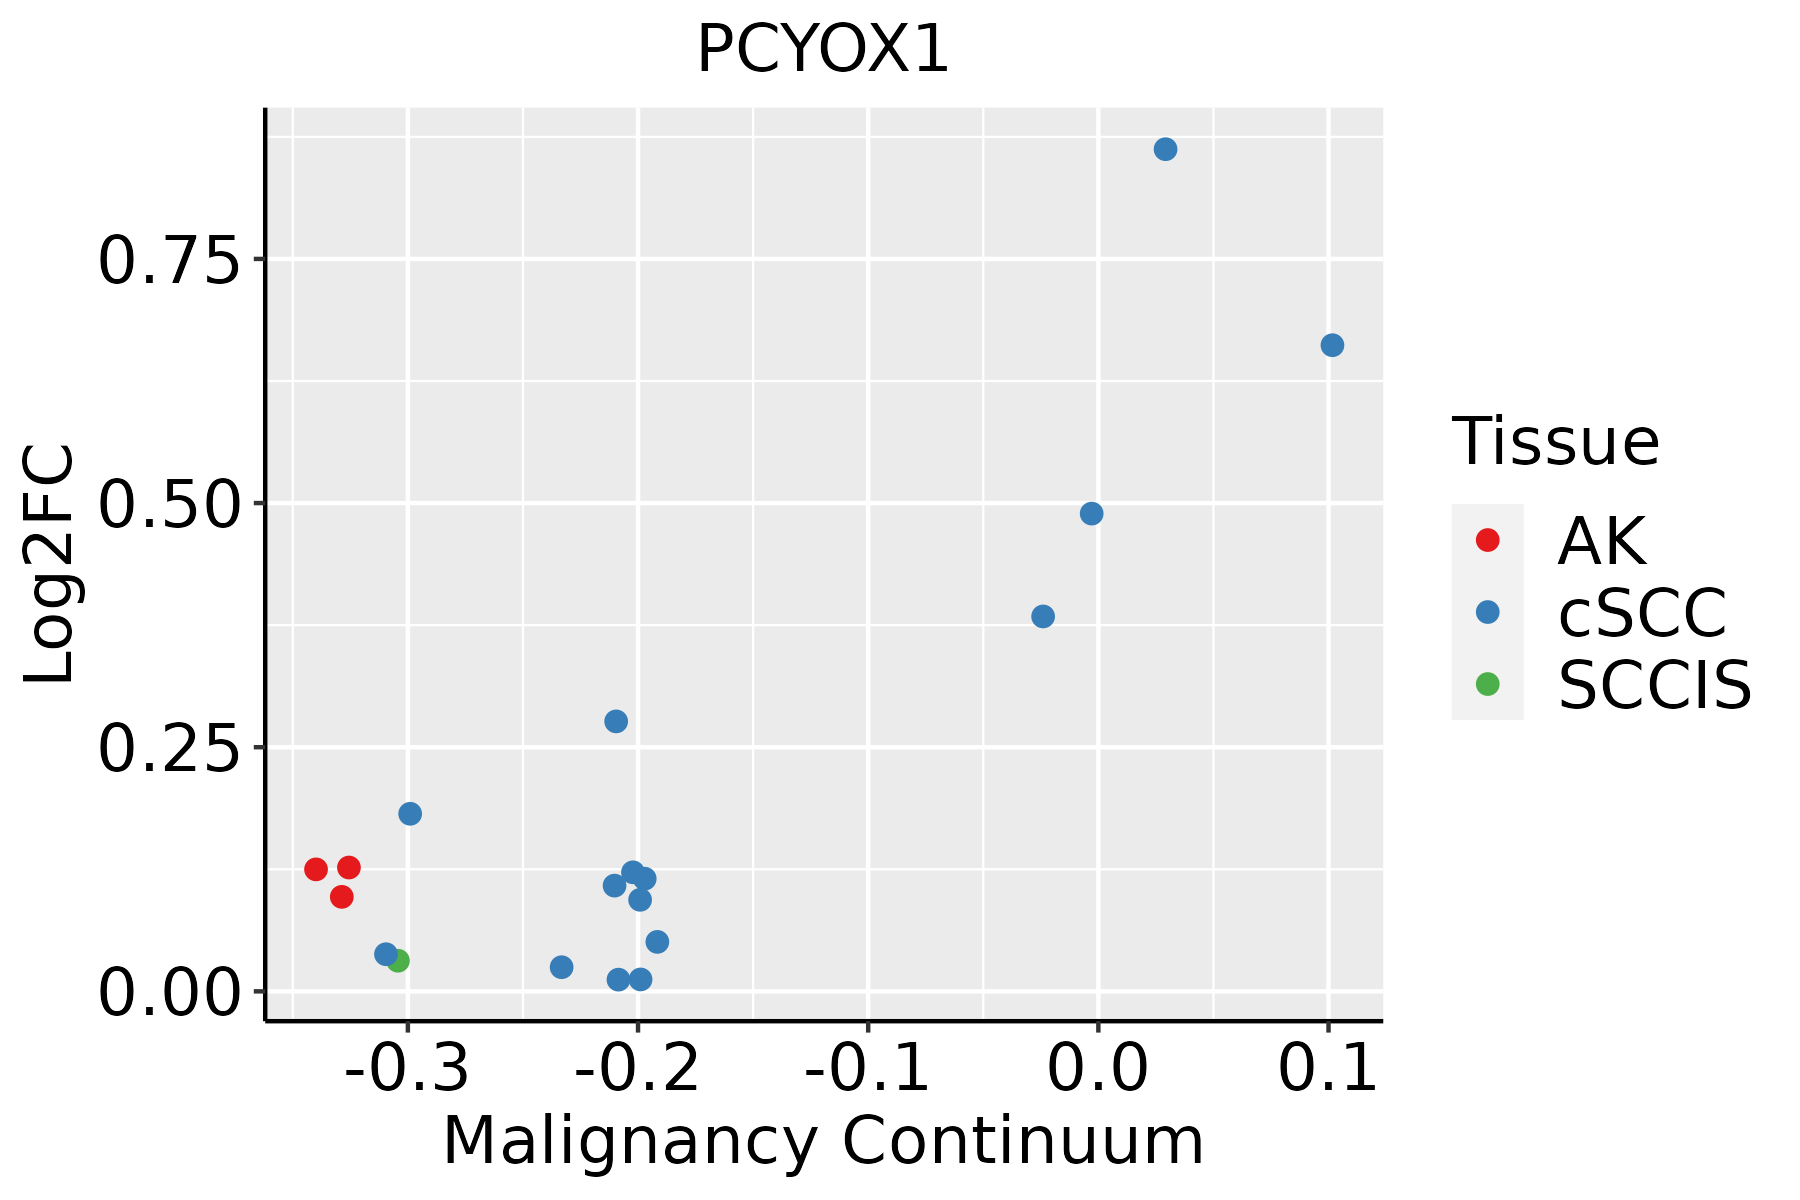 | AK: Actinic keratosis |
| cSCC: Cutaneous squamous cell carcinoma | ||
| SCCIS:squamous cell carcinoma in situ | ||
| Thyroid | 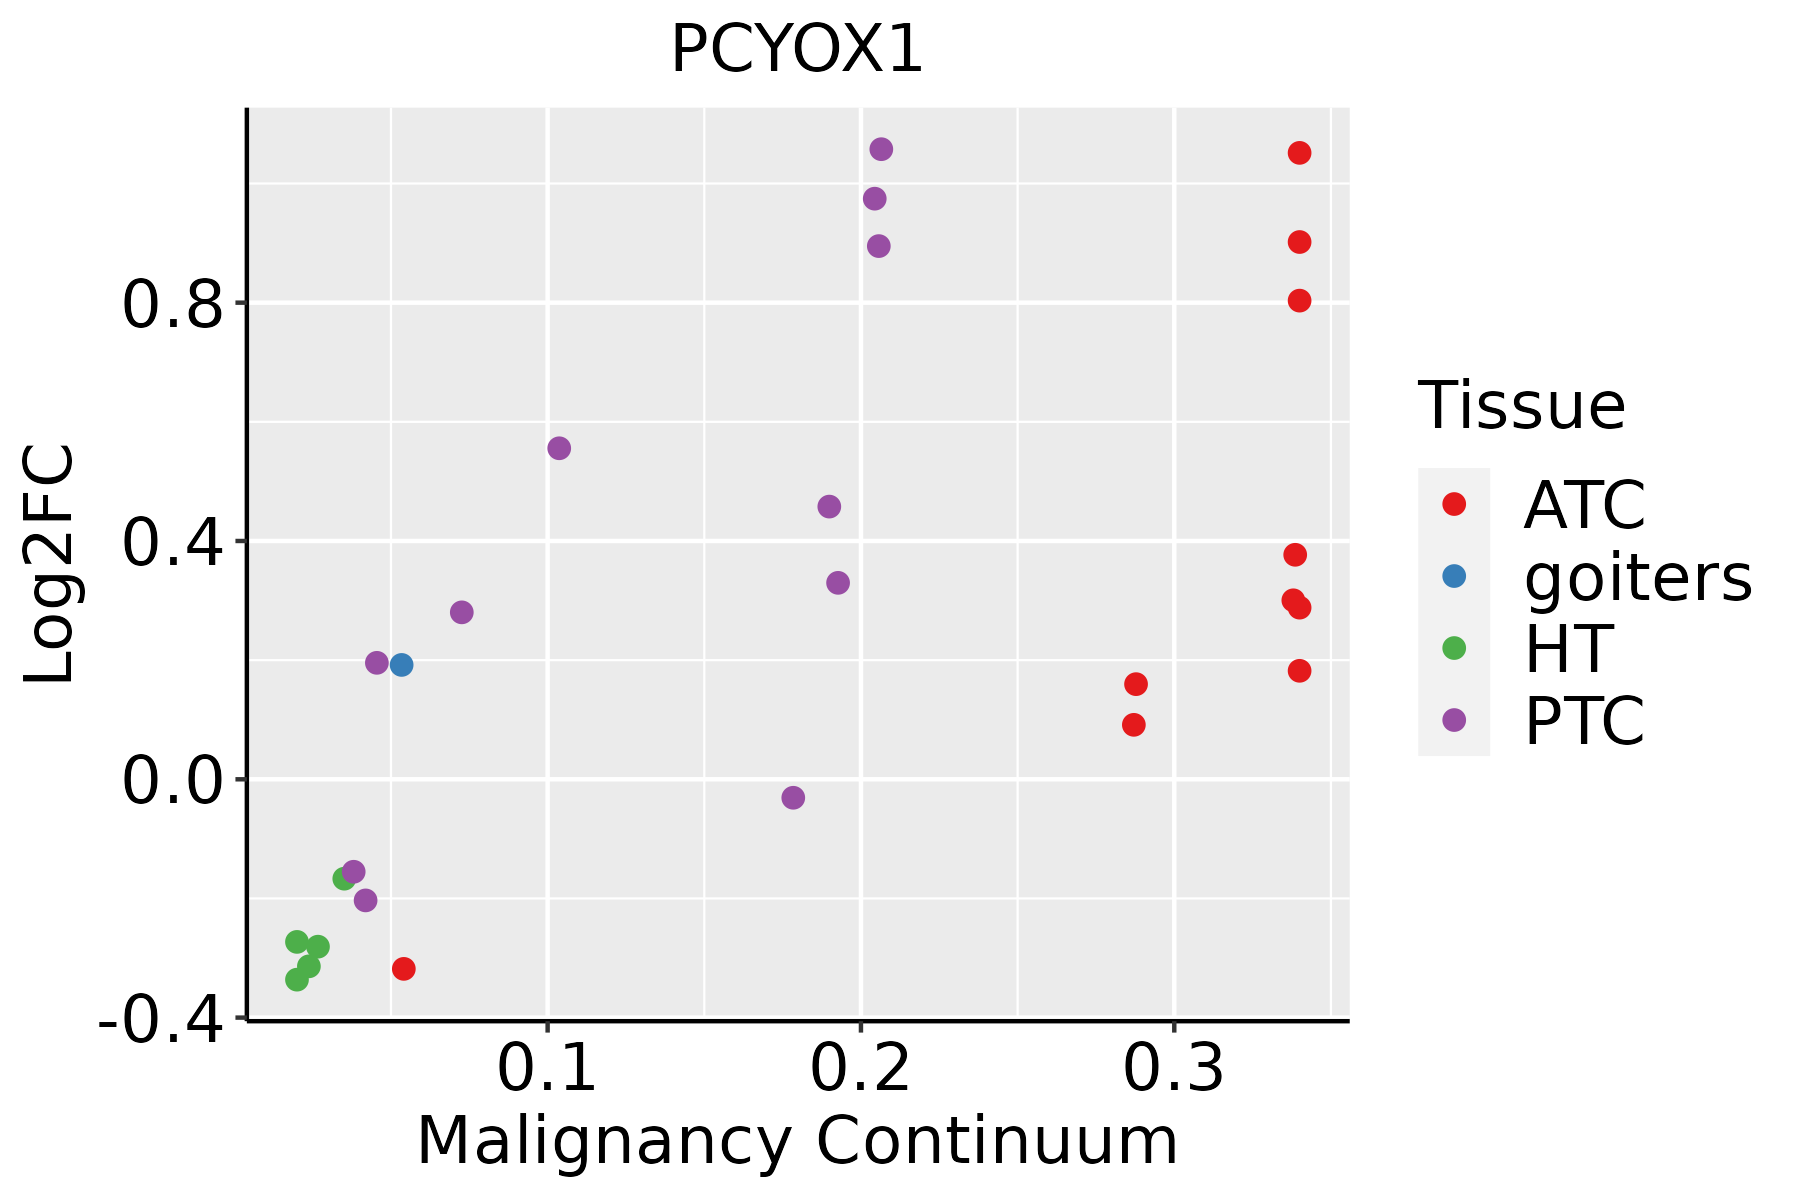 | ATC: Anaplastic thyroid cancer |
| HT: Hashimoto's thyroiditis | ||
| PTC: Papillary thyroid cancer |
| ∗log2FC in expression of this searched gene in stem-like cells from each diseased tissue sample relative to stem-like cells in normal samples in each tissue plotted against the malignancy continuum. Samples are colored based on if they are from different disease stage. |
Top |
Malignant transformation related pathway analysis |
| Find out the enriched GO biological processes and KEGG pathways involved in transition from healthy to precancer to cancer |
| Tissue | Disease Stage | Enriched GO biological Processes |
| Colorectum | AD |  |
| Colorectum | SER |  |
| Colorectum | MSS |  |
| Colorectum | MSI-H |  |
| Colorectum | FAP |  |
| ∗Top 15 enriched GO BP terms are showed in the bar plot of each disease state in each tissue. Each row represents a significant GO biological process which is colored according to the -log10(p.adjust). |
| Page: 1 2 3 4 5 6 7 8 9 |
| GO ID | Tissue | Disease Stage | Description | Gene Ratio | Bg Ratio | pvalue | p.adjust | Count |
| GO:0006575 | Colorectum | AD | cellular modified amino acid metabolic process | 59/3918 | 188/18723 | 4.80e-04 | 5.27e-03 | 59 |
| GO:0015698 | Colorectum | AD | inorganic anion transport | 52/3918 | 180/18723 | 6.83e-03 | 4.22e-02 | 52 |
| GO:00065751 | Colorectum | MSS | cellular modified amino acid metabolic process | 55/3467 | 188/18723 | 2.16e-04 | 3.01e-03 | 55 |
| GO:00065752 | Colorectum | MSI-H | cellular modified amino acid metabolic process | 25/1319 | 188/18723 | 1.61e-03 | 2.39e-02 | 25 |
| GO:00065757 | Esophagus | ESCC | cellular modified amino acid metabolic process | 112/8552 | 188/18723 | 8.31e-05 | 6.06e-04 | 112 |
| GO:000657511 | Liver | Cirrhotic | cellular modified amino acid metabolic process | 70/4634 | 188/18723 | 9.04e-05 | 9.69e-04 | 70 |
| GO:000657521 | Liver | HCC | cellular modified amino acid metabolic process | 119/7958 | 188/18723 | 6.47e-09 | 1.67e-07 | 119 |
| GO:00065756 | Oral cavity | OSCC | cellular modified amino acid metabolic process | 91/7305 | 188/18723 | 5.33e-03 | 2.07e-02 | 91 |
| GO:000657512 | Oral cavity | LP | cellular modified amino acid metabolic process | 64/4623 | 188/18723 | 2.43e-03 | 1.73e-02 | 64 |
| GO:00065758 | Skin | cSCC | cellular modified amino acid metabolic process | 73/4864 | 188/18723 | 7.11e-05 | 6.85e-04 | 73 |
| GO:00065759 | Thyroid | HT | cellular modified amino acid metabolic process | 28/1272 | 188/18723 | 7.21e-05 | 1.31e-03 | 28 |
| GO:000657513 | Thyroid | PTC | cellular modified amino acid metabolic process | 85/5968 | 188/18723 | 8.29e-05 | 7.01e-04 | 85 |
| GO:000657522 | Thyroid | ATC | cellular modified amino acid metabolic process | 82/6293 | 188/18723 | 2.60e-03 | 1.20e-02 | 82 |
| Page: 1 |
| Pathway ID | Tissue | Disease Stage | Description | Gene Ratio | Bg Ratio | pvalue | p.adjust | qvalue | Count |
| hsa009005 | Esophagus | ESCC | Terpenoid backbone biosynthesis | 20/4205 | 23/8465 | 2.14e-04 | 7.87e-04 | 4.03e-04 | 20 |
| hsa0090012 | Esophagus | ESCC | Terpenoid backbone biosynthesis | 20/4205 | 23/8465 | 2.14e-04 | 7.87e-04 | 4.03e-04 | 20 |
| hsa00900 | Liver | HCC | Terpenoid backbone biosynthesis | 17/4020 | 23/8465 | 9.26e-03 | 2.46e-02 | 1.37e-02 | 17 |
| hsa009001 | Liver | HCC | Terpenoid backbone biosynthesis | 17/4020 | 23/8465 | 9.26e-03 | 2.46e-02 | 1.37e-02 | 17 |
| hsa009004 | Oral cavity | OSCC | Terpenoid backbone biosynthesis | 19/3704 | 23/8465 | 1.55e-04 | 5.34e-04 | 2.72e-04 | 19 |
| hsa0090011 | Oral cavity | OSCC | Terpenoid backbone biosynthesis | 19/3704 | 23/8465 | 1.55e-04 | 5.34e-04 | 2.72e-04 | 19 |
| hsa009002 | Oral cavity | LP | Terpenoid backbone biosynthesis | 12/2418 | 23/8465 | 1.43e-02 | 4.59e-02 | 2.96e-02 | 12 |
| hsa009003 | Oral cavity | LP | Terpenoid backbone biosynthesis | 12/2418 | 23/8465 | 1.43e-02 | 4.59e-02 | 2.96e-02 | 12 |
| Page: 1 |
Top |
Cell-cell communication analysis |
| Identification of potential cell-cell interactions between two cell types and their ligand-receptor pairs for different disease states |
| Ligand | Receptor | LRpair | Pathway | Tissue | Disease Stage |
| Page: 1 |
Top |
Single-cell gene regulatory network inference analysis |
| Find out the significant the regulons (TFs) and the target genes of each regulon across cell types for different disease states |
| TF | Cell Type | Tissue | Disease Stage | Target Gene | RSS | Regulon Activity |
| ∗The dot plots of a searched regulon are shown for all cell subpopulations in each disease state of each tissue based on the regulon specific score inferred using pySCENIC and by calculating the average expression. |
| Page: 1 |
Top |
Somatic mutation of malignant transformation related genes |
| Annotation of somatic variants for genes involved in malignant transformation |
| Hugo Symbol | Variant Class | Variant Classification | dbSNP RS | HGVSc | HGVSp | HGVSp Short | SWISSPROT | BIOTYPE | SIFT | PolyPhen | Tumor Sample Barcode | Tissue | Histology | Sex | Age | Stage | Therapy Types | Drugs | Outcome |
| PCYOX1 | SNV | Missense_Mutation | novel | c.52N>A | p.Leu18Met | p.L18M | Q9UHG3 | protein_coding | tolerated(0.06) | probably_damaging(0.994) | TCGA-A7-A56D-01 | Breast | breast invasive carcinoma | Female | >=65 | I/II | Hormone Therapy | arimidex | SD |
| PCYOX1 | SNV | Missense_Mutation | novel | c.550N>A | p.His184Asn | p.H184N | Q9UHG3 | protein_coding | tolerated(0.09) | benign(0.076) | TCGA-AN-A046-01 | Breast | breast invasive carcinoma | Female | >=65 | I/II | Unknown | Unknown | SD |
| PCYOX1 | SNV | Missense_Mutation | rs756161282 | c.143N>T | p.Ser48Leu | p.S48L | Q9UHG3 | protein_coding | deleterious(0) | probably_damaging(0.93) | TCGA-D8-A1JN-01 | Breast | breast invasive carcinoma | Female | >=65 | III/IV | Hormone Therapy | anastrozolum | SD |
| PCYOX1 | SNV | Missense_Mutation | c.514C>G | p.His172Asp | p.H172D | Q9UHG3 | protein_coding | deleterious(0) | benign(0.09) | TCGA-GM-A2D9-01 | Breast | breast invasive carcinoma | Female | >=65 | I/II | Hormone Therapy | arimidex | SD | |
| PCYOX1 | insertion | Nonsense_Mutation | novel | c.923_924insTTTTGAAAAATAATCTTTTTTTTTTT | p.Asp309PhefsTer4 | p.D309Ffs*4 | Q9UHG3 | protein_coding | TCGA-BH-A0HF-01 | Breast | breast invasive carcinoma | Female | >=65 | I/II | Hormone Therapy | arimidex | SD | ||
| PCYOX1 | SNV | Missense_Mutation | rs749505886 | c.214G>A | p.Gly72Arg | p.G72R | Q9UHG3 | protein_coding | deleterious(0) | probably_damaging(1) | TCGA-2W-A8YY-01 | Cervix | cervical & endocervical cancer | Female | <65 | I/II | Chemotherapy | cisplatin | CR |
| PCYOX1 | SNV | Missense_Mutation | rs745845529 | c.412G>A | p.Val138Met | p.V138M | Q9UHG3 | protein_coding | tolerated(0.34) | benign(0.015) | TCGA-2W-A8YY-01 | Cervix | cervical & endocervical cancer | Female | <65 | I/II | Chemotherapy | cisplatin | CR |
| PCYOX1 | SNV | Missense_Mutation | c.1267N>G | p.Leu423Val | p.L423V | Q9UHG3 | protein_coding | tolerated(0.31) | benign(0.011) | TCGA-C5-A1MH-01 | Cervix | cervical & endocervical cancer | Female | >=65 | III/IV | Chemotherapy | cisplatin | PD | |
| PCYOX1 | SNV | Missense_Mutation | novel | c.1183N>T | p.Pro395Ser | p.P395S | Q9UHG3 | protein_coding | tolerated(0.37) | benign(0.005) | TCGA-EA-A44S-01 | Cervix | cervical & endocervical cancer | Female | <65 | III/IV | Chemotherapy | carboplatin | SD |
| PCYOX1 | SNV | Missense_Mutation | rs773198726 | c.160C>T | p.Arg54Trp | p.R54W | Q9UHG3 | protein_coding | deleterious(0) | probably_damaging(0.999) | TCGA-AA-3696-01 | Colorectum | colon adenocarcinoma | Female | >=65 | III/IV | Unknown | Unknown | PD |
| Page: 1 2 3 4 5 6 |
Top |
Related drugs of malignant transformation related genes |
| Identification of chemicals and drugs interact with genes involved in malignant transfromation |
| (DGIdb 4.0) |
| Entrez ID | Symbol | Category | Interaction Types | Drug Claim Name | Drug Name | PMIDs |
| Page: 1 |

Copyright 2023-Present -The University of Texas Health Science Center at Houston |