
|
|||||
|
 | |
| |
| |
| |
| |
| |
|
Gene: PCAT1 |
Gene summary for PCAT1 |
| Gene information | Species | Human | Gene symbol | PCAT1 | Gene ID | 100750225 |
| Gene name | prostate cancer associated transcript 1 | |
| Gene Alias | PCA1 | |
| Cytomap | 8q24.21 | |
| Gene Type | ncRNA | GO ID | NA | UniProtAcc | NA |
Top |
Malignant transformation analysis |
| Identification of the aberrant gene expression in precancerous and cancerous lesions by comparing the gene expression of stem-like cells in diseased tissues with normal stem cells |
| Entrez ID | Symbol | Replicates | Species | Organ | Tissue | Adj P-value | Log2FC | Malignancy |
| 100750225 | PCAT1 | A002-C-116 | Human | Colorectum | FAP | 7.03e-11 | -2.46e-01 | -0.0452 |
| 100750225 | PCAT1 | A018-E-020 | Human | Colorectum | FAP | 1.59e-06 | -2.83e-01 | -0.2034 |
| 100750225 | PCAT1 | CRC-3-11773 | Human | Colorectum | CRC | 1.99e-10 | 6.34e-01 | 0.2564 |
| 100750225 | PCAT1 | AEH-subject1 | Human | Endometrium | AEH | 1.26e-25 | 6.36e-01 | -0.3059 |
| 100750225 | PCAT1 | AEH-subject2 | Human | Endometrium | AEH | 1.53e-22 | 6.25e-01 | -0.2525 |
| 100750225 | PCAT1 | AEH-subject3 | Human | Endometrium | AEH | 2.48e-15 | 4.90e-01 | -0.2576 |
| 100750225 | PCAT1 | AEH-subject4 | Human | Endometrium | AEH | 5.10e-07 | 3.20e-01 | -0.2657 |
| 100750225 | PCAT1 | AEH-subject5 | Human | Endometrium | AEH | 3.90e-22 | 6.49e-01 | -0.2953 |
| 100750225 | PCAT1 | EEC-subject1 | Human | Endometrium | EEC | 1.65e-17 | 5.57e-01 | -0.2682 |
| 100750225 | PCAT1 | EEC-subject2 | Human | Endometrium | EEC | 2.45e-16 | 5.02e-01 | -0.2607 |
| 100750225 | PCAT1 | EEC-subject4 | Human | Endometrium | EEC | 2.22e-44 | 1.06e+00 | -0.2571 |
| 100750225 | PCAT1 | EEC-subject5 | Human | Endometrium | EEC | 3.28e-06 | 2.90e-01 | -0.249 |
| 100750225 | PCAT1 | NAFLD1 | Human | Liver | NAFLD | 2.23e-04 | 5.93e-01 | -0.04 |
| 100750225 | PCAT1 | HCC1_Meng | Human | Liver | HCC | 4.04e-05 | -8.06e-02 | 0.0246 |
| 100750225 | PCAT1 | HCC1 | Human | Liver | HCC | 7.10e-07 | 9.05e-01 | 0.5336 |
| 100750225 | PCAT1 | HCC2 | Human | Liver | HCC | 7.45e-09 | 1.41e+00 | 0.5341 |
| 100750225 | PCAT1 | HCC5 | Human | Liver | HCC | 6.49e-15 | 1.22e+00 | 0.4932 |
| 100750225 | PCAT1 | RNA-P10T2-P10T2-3 | Human | Lung | AAH | 1.22e-02 | 6.03e-01 | -0.1408 |
| 100750225 | PCAT1 | RNA-P17T-P17T-2 | Human | Lung | IAC | 1.99e-06 | 7.33e-01 | 0.3371 |
| 100750225 | PCAT1 | RNA-P17T-P17T-4 | Human | Lung | IAC | 1.48e-03 | 6.68e-01 | 0.343 |
| Page: 1 2 3 4 |
| Tissue | Expression Dynamics | Abbreviation |
| Colorectum (GSE201348) |  | FAP: Familial adenomatous polyposis |
| CRC: Colorectal cancer | ||
| Colorectum (HTA11) |  | AD: Adenomas |
| SER: Sessile serrated lesions | ||
| MSI-H: Microsatellite-high colorectal cancer | ||
| MSS: Microsatellite stable colorectal cancer | ||
| Endometrium | 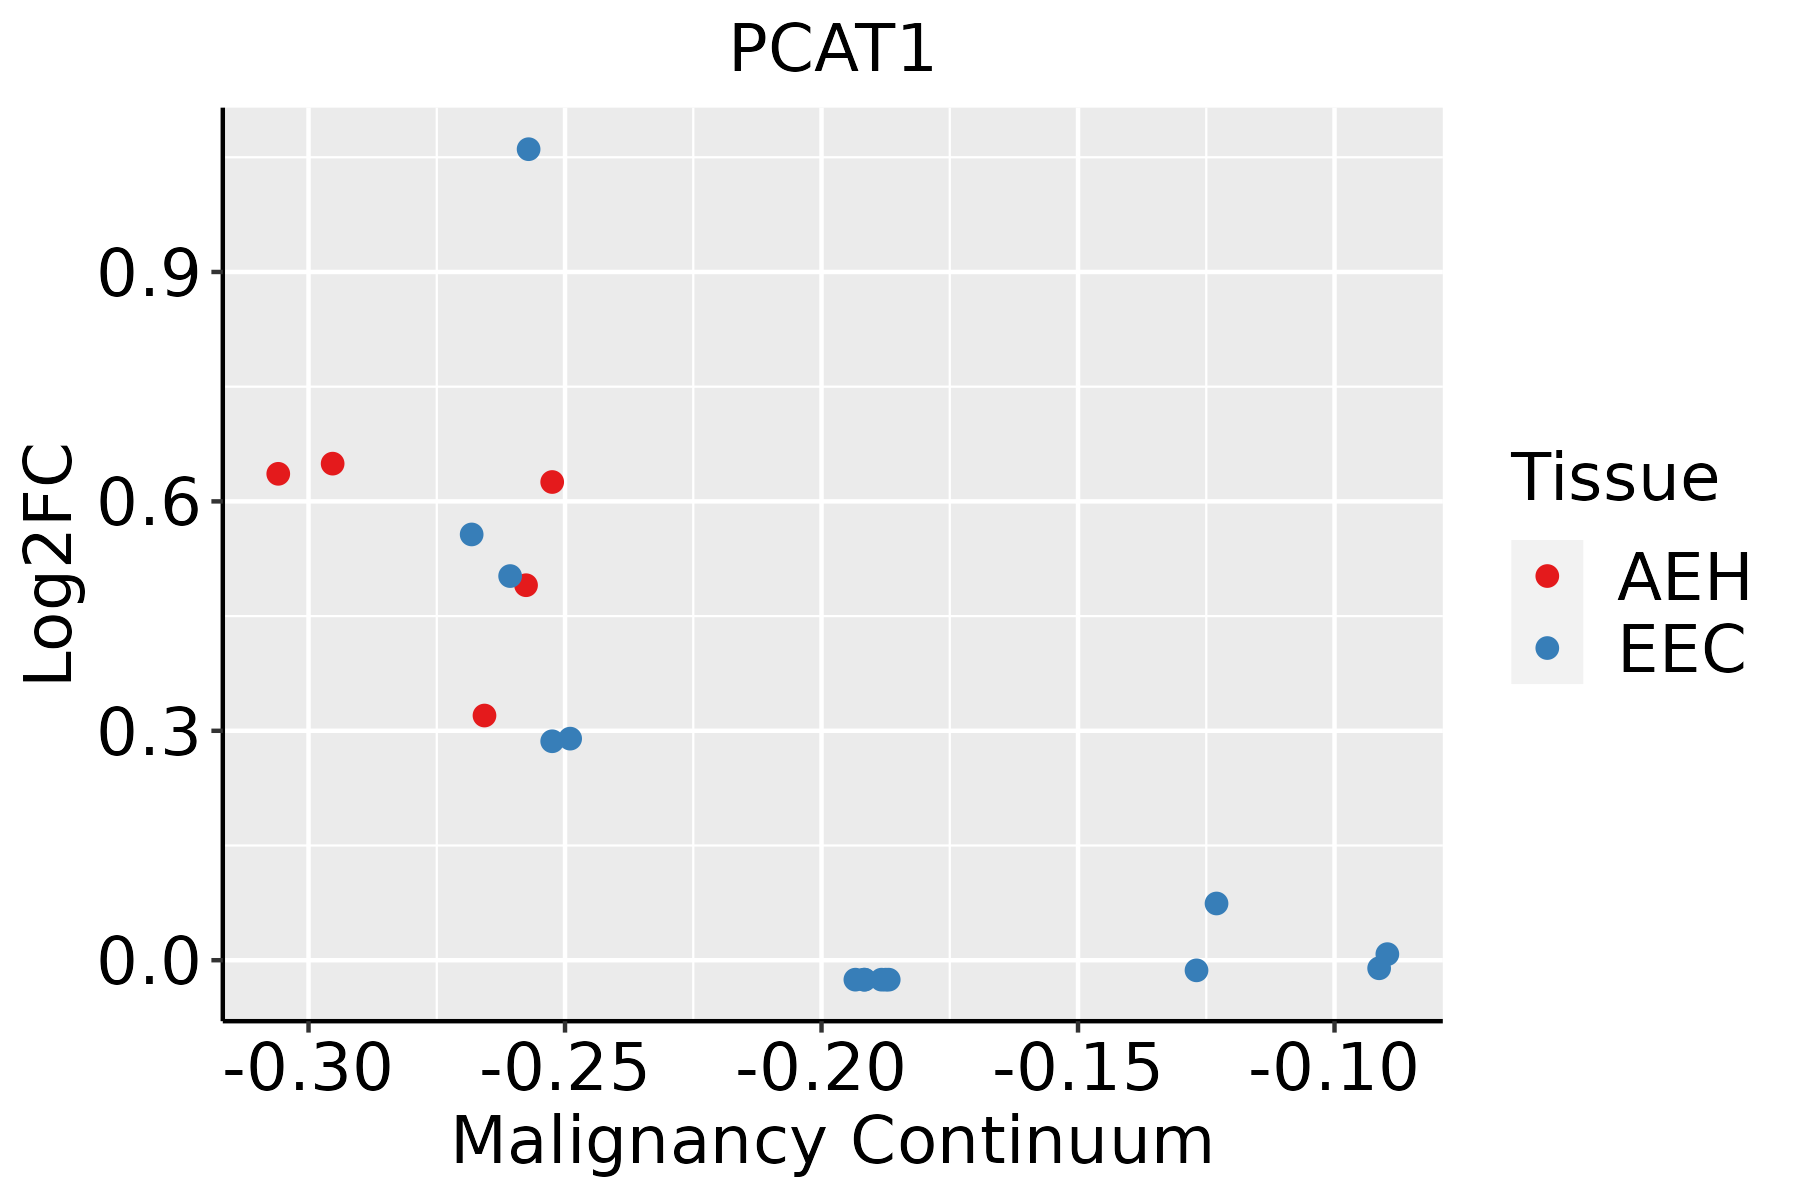 | AEH: Atypical endometrial hyperplasia |
| EEC: Endometrioid Cancer | ||
| Liver | 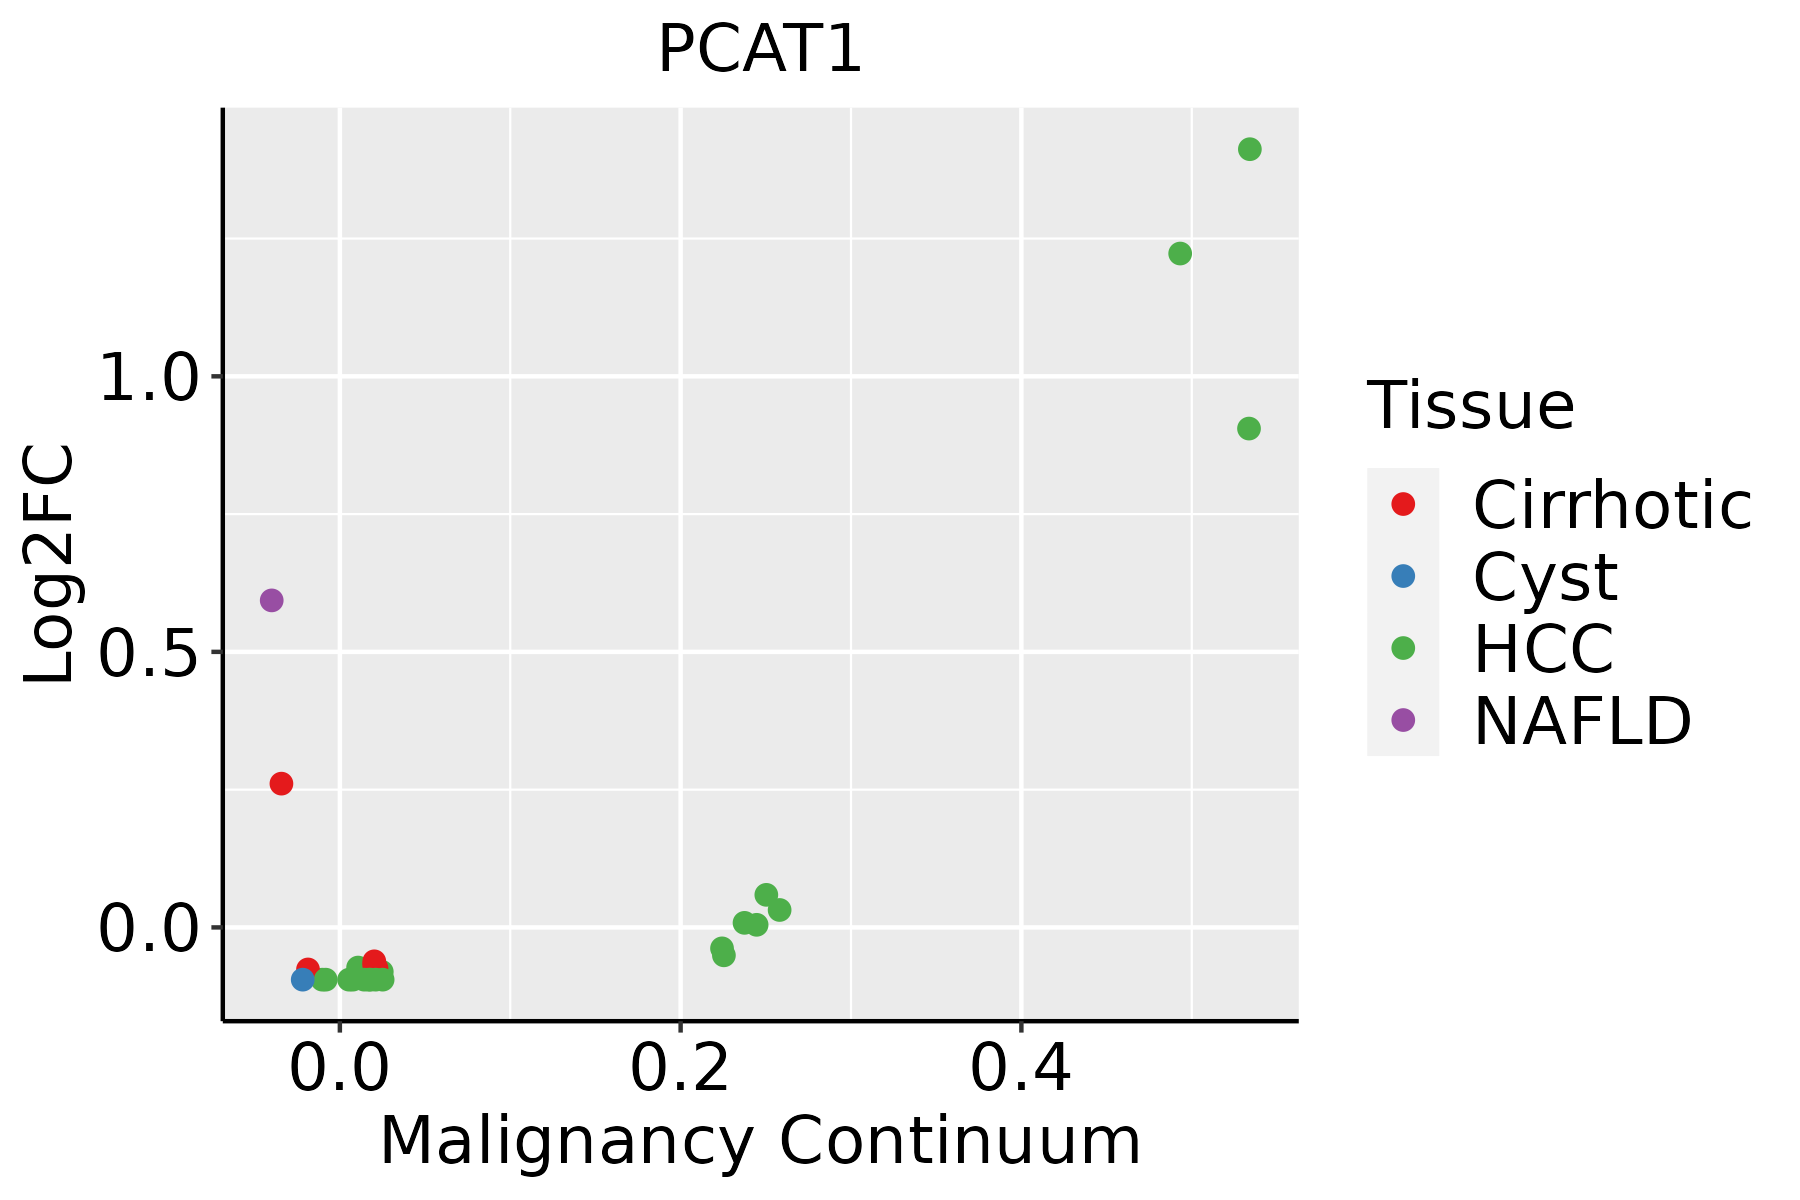 | HCC: Hepatocellular carcinoma |
| NAFLD: Non-alcoholic fatty liver disease | ||
| Lung |  | AAH: Atypical adenomatous hyperplasia |
| AIS: Adenocarcinoma in situ | ||
| IAC: Invasive lung adenocarcinoma | ||
| MIA: Minimally invasive adenocarcinoma | ||
| Skin | 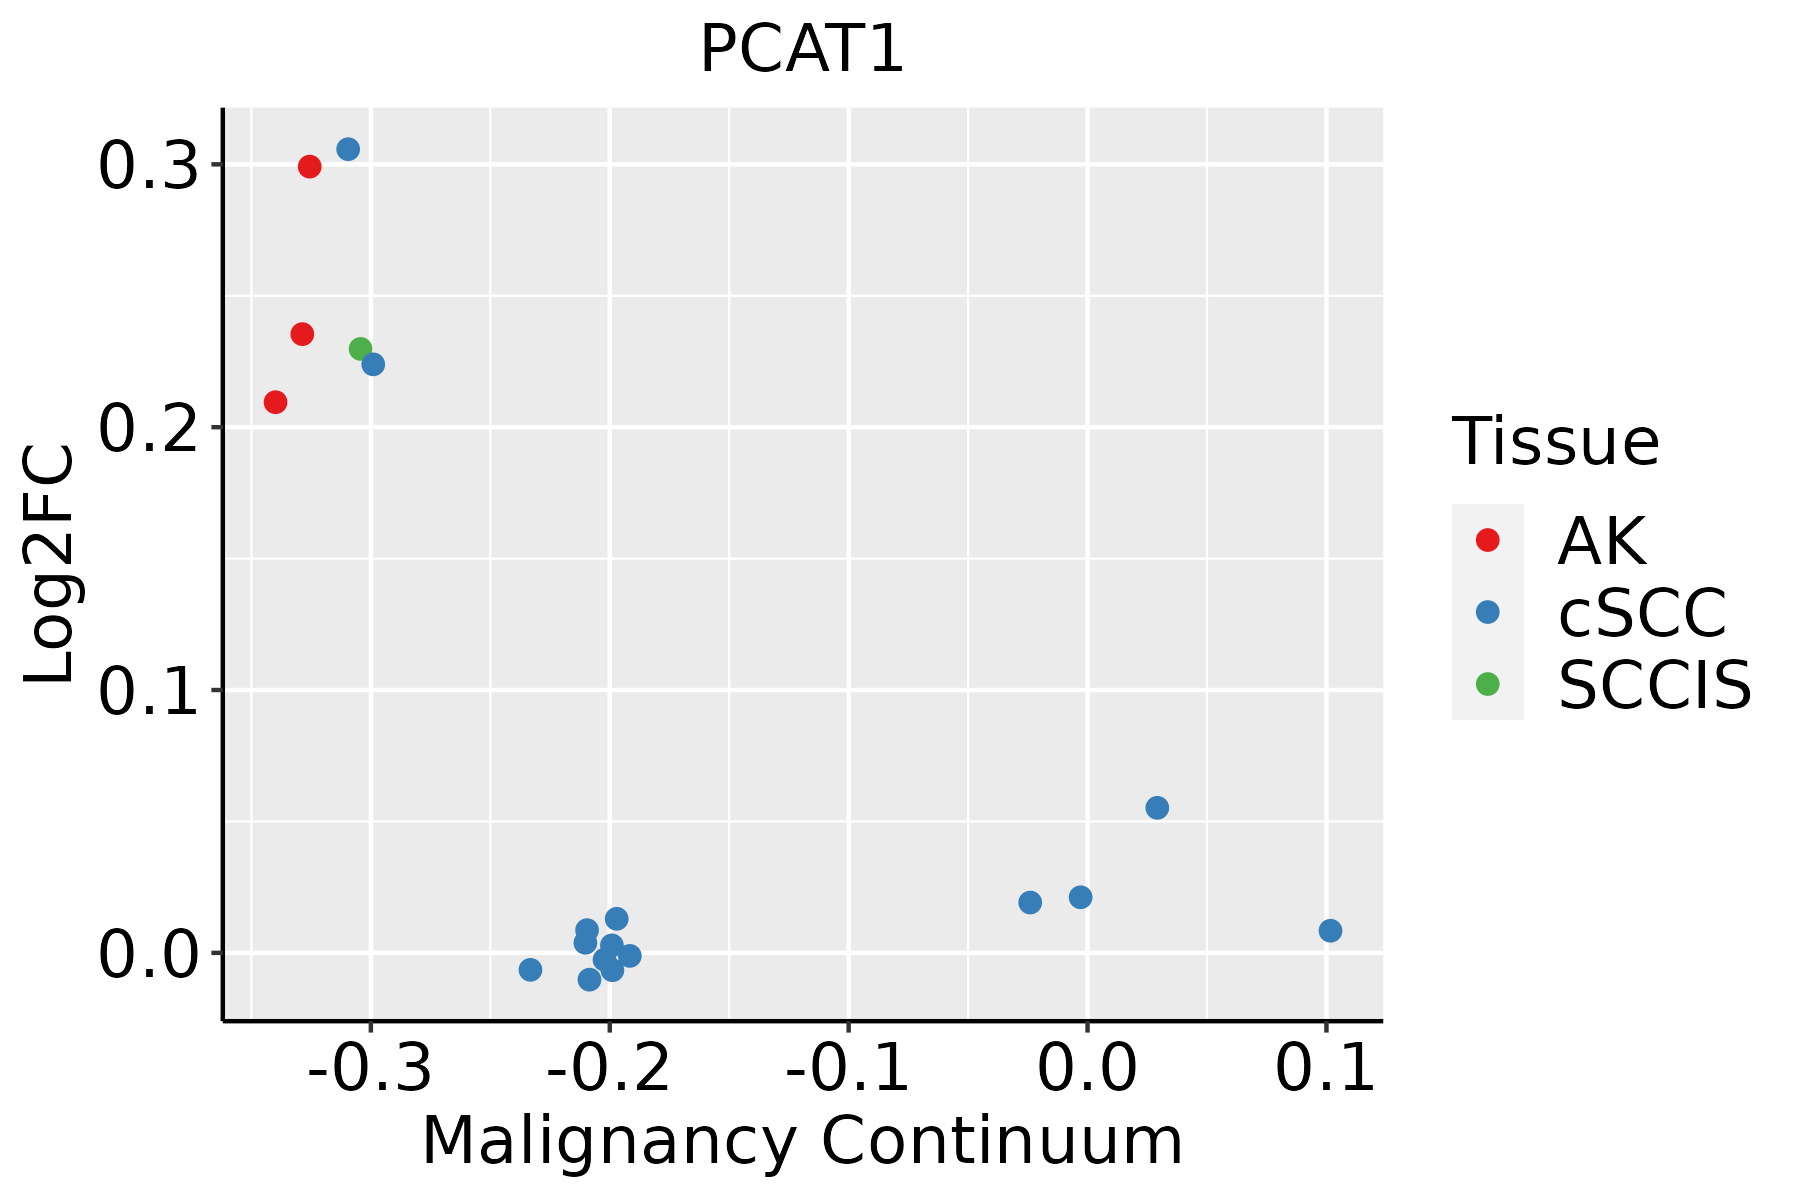 | AK: Actinic keratosis |
| cSCC: Cutaneous squamous cell carcinoma | ||
| SCCIS:squamous cell carcinoma in situ |
| ∗log2FC in expression of this searched gene in stem-like cells from each diseased tissue sample relative to stem-like cells in normal samples in each tissue plotted against the malignancy continuum. Samples are colored based on if they are from different disease stage. |
Top |
Malignant transformation related pathway analysis |
| Find out the enriched GO biological processes and KEGG pathways involved in transition from healthy to precancer to cancer |
| Tissue | Disease Stage | Enriched GO biological Processes |
| Colorectum | AD |  |
| Colorectum | SER |  |
| Colorectum | MSS |  |
| Colorectum | MSI-H |  |
| Colorectum | FAP |  |
| ∗Top 15 enriched GO BP terms are showed in the bar plot of each disease state in each tissue. Each row represents a significant GO biological process which is colored according to the -log10(p.adjust). |
| Page: 1 2 3 4 5 6 7 8 9 |
| GO ID | Tissue | Disease Stage | Description | Gene Ratio | Bg Ratio | pvalue | p.adjust | Count |
| GO:0042176111 | Esophagus | ESCC | regulation of protein catabolic process | 280/8552 | 391/18723 | 8.65e-26 | 2.39e-23 | 280 |
| GO:0009896111 | Esophagus | ESCC | positive regulation of catabolic process | 332/8552 | 492/18723 | 4.36e-23 | 9.22e-21 | 332 |
| GO:0045732111 | Esophagus | ESCC | positive regulation of protein catabolic process | 167/8552 | 231/18723 | 1.47e-16 | 1.14e-14 | 167 |
| GO:0010563111 | Esophagus | ESCC | negative regulation of phosphorus metabolic process | 274/8552 | 442/18723 | 2.32e-12 | 9.41e-11 | 274 |
| GO:0045936111 | Esophagus | ESCC | negative regulation of phosphate metabolic process | 273/8552 | 441/18723 | 3.18e-12 | 1.25e-10 | 273 |
| GO:00086544 | Esophagus | ESCC | phospholipid biosynthetic process | 162/8552 | 253/18723 | 2.59e-09 | 5.73e-08 | 162 |
| GO:00464744 | Esophagus | ESCC | glycerophospholipid biosynthetic process | 135/8552 | 211/18723 | 5.75e-08 | 1.02e-06 | 135 |
| GO:00450175 | Esophagus | ESCC | glycerolipid biosynthetic process | 154/8552 | 252/18723 | 5.20e-07 | 6.96e-06 | 154 |
| GO:00066446 | Esophagus | ESCC | phospholipid metabolic process | 218/8552 | 383/18723 | 5.37e-06 | 5.59e-05 | 218 |
| GO:00066561 | Esophagus | ESCC | phosphatidylcholine biosynthetic process | 24/8552 | 29/18723 | 4.50e-05 | 3.55e-04 | 24 |
| GO:00066505 | Esophagus | ESCC | glycerophospholipid metabolic process | 174/8552 | 306/18723 | 4.92e-05 | 3.85e-04 | 174 |
| GO:00066541 | Esophagus | ESCC | phosphatidic acid biosynthetic process | 26/8552 | 33/18723 | 1.06e-04 | 7.43e-04 | 26 |
| GO:00464733 | Esophagus | ESCC | phosphatidic acid metabolic process | 28/8552 | 37/18723 | 2.00e-04 | 1.26e-03 | 28 |
| GO:00464864 | Esophagus | ESCC | glycerolipid metabolic process | 211/8552 | 392/18723 | 6.51e-04 | 3.46e-03 | 211 |
| GO:01501724 | Esophagus | ESCC | regulation of phosphatidylcholine metabolic process | 9/8552 | 10/18723 | 5.09e-03 | 1.92e-02 | 9 |
| GO:00192168 | Esophagus | ESCC | regulation of lipid metabolic process | 172/8552 | 331/18723 | 1.20e-02 | 4.02e-02 | 172 |
| GO:000989622 | Liver | HCC | positive regulation of catabolic process | 335/7958 | 492/18723 | 3.83e-31 | 1.87e-28 | 335 |
| GO:004217622 | Liver | HCC | regulation of protein catabolic process | 267/7958 | 391/18723 | 2.45e-25 | 7.38e-23 | 267 |
| GO:004573222 | Liver | HCC | positive regulation of protein catabolic process | 163/7958 | 231/18723 | 4.00e-18 | 4.69e-16 | 163 |
| GO:001056322 | Liver | HCC | negative regulation of phosphorus metabolic process | 259/7958 | 442/18723 | 4.29e-12 | 1.92e-10 | 259 |
| Page: 1 2 3 4 5 |
| Pathway ID | Tissue | Disease Stage | Description | Gene Ratio | Bg Ratio | pvalue | p.adjust | qvalue | Count |
| Page: 1 |
Top |
Cell-cell communication analysis |
| Identification of potential cell-cell interactions between two cell types and their ligand-receptor pairs for different disease states |
| Ligand | Receptor | LRpair | Pathway | Tissue | Disease Stage |
| Page: 1 |
Top |
Single-cell gene regulatory network inference analysis |
| Find out the significant the regulons (TFs) and the target genes of each regulon across cell types for different disease states |
| TF | Cell Type | Tissue | Disease Stage | Target Gene | RSS | Regulon Activity |
| ∗The dot plots of a searched regulon are shown for all cell subpopulations in each disease state of each tissue based on the regulon specific score inferred using pySCENIC and by calculating the average expression. |
| Page: 1 |
Top |
Somatic mutation of malignant transformation related genes |
| Annotation of somatic variants for genes involved in malignant transformation |
| Hugo Symbol | Variant Class | Variant Classification | dbSNP RS | HGVSc | HGVSp | HGVSp Short | SWISSPROT | BIOTYPE | SIFT | PolyPhen | Tumor Sample Barcode | Tissue | Histology | Sex | Age | Stage | Therapy Types | Drugs | Outcome |
| Page: 1 |
Top |
Related drugs of malignant transformation related genes |
| Identification of chemicals and drugs interact with genes involved in malignant transfromation |
| (DGIdb 4.0) |
| Entrez ID | Symbol | Category | Interaction Types | Drug Claim Name | Drug Name | PMIDs |
| Page: 1 |

Copyright 2023-Present -The University of Texas Health Science Center at Houston |