
|
|||||
|
 | |
| |
| |
| |
| |
| |
|
Gene: PBX3 |
Gene summary for PBX3 |
| Gene information | Species | Human | Gene symbol | PBX3 | Gene ID | 5090 |
| Gene name | PBX homeobox 3 | |
| Gene Alias | PBX3 | |
| Cytomap | 9q33.3 | |
| Gene Type | protein-coding | GO ID | GO:0001654 | UniProtAcc | P40426 |
Top |
Malignant transformation analysis |
| Identification of the aberrant gene expression in precancerous and cancerous lesions by comparing the gene expression of stem-like cells in diseased tissues with normal stem cells |
| Entrez ID | Symbol | Replicates | Species | Organ | Tissue | Adj P-value | Log2FC | Malignancy |
| 5090 | PBX3 | SYSMH3 | Human | Oral cavity | OSCC | 2.76e-05 | 1.06e-01 | 0.2442 |
| 5090 | PBX3 | HTA12-15-2 | Human | Pancreas | PDAC | 4.13e-08 | 8.14e-01 | 0.2315 |
| 5090 | PBX3 | HTA12-23-1 | Human | Pancreas | PDAC | 6.99e-14 | 1.20e+00 | 0.3405 |
| 5090 | PBX3 | HTA12-25-1 | Human | Pancreas | PDAC | 1.63e-06 | 8.31e-01 | 0.313 |
| 5090 | PBX3 | HTA12-26-1 | Human | Pancreas | PDAC | 5.45e-28 | 1.35e+00 | 0.3728 |
| 5090 | PBX3 | HTA12-29-1 | Human | Pancreas | PDAC | 1.39e-76 | 1.46e+00 | 0.3722 |
| 5090 | PBX3 | male-WTA | Human | Thyroid | PTC | 6.46e-40 | 3.09e-01 | 0.1037 |
| 5090 | PBX3 | PTC01 | Human | Thyroid | PTC | 2.86e-12 | 1.33e-01 | 0.1899 |
| 5090 | PBX3 | PTC03 | Human | Thyroid | PTC | 1.14e-02 | 5.61e-01 | 0.1784 |
| 5090 | PBX3 | PTC04 | Human | Thyroid | PTC | 9.38e-19 | 4.83e-01 | 0.1927 |
| 5090 | PBX3 | PTC05 | Human | Thyroid | PTC | 2.06e-13 | 9.81e-01 | 0.2065 |
| 5090 | PBX3 | PTC06 | Human | Thyroid | PTC | 6.98e-26 | 1.05e+00 | 0.2057 |
| 5090 | PBX3 | PTC07 | Human | Thyroid | PTC | 1.48e-21 | 5.40e-01 | 0.2044 |
| 5090 | PBX3 | ATC12 | Human | Thyroid | ATC | 4.59e-09 | 5.31e-02 | 0.34 |
| 5090 | PBX3 | ATC13 | Human | Thyroid | ATC | 4.23e-24 | 4.54e-01 | 0.34 |
| 5090 | PBX3 | ATC2 | Human | Thyroid | ATC | 6.63e-04 | 4.13e-01 | 0.34 |
| 5090 | PBX3 | ATC4 | Human | Thyroid | ATC | 1.26e-03 | 1.02e-01 | 0.34 |
| 5090 | PBX3 | ATC5 | Human | Thyroid | ATC | 6.91e-27 | 5.12e-01 | 0.34 |
| Page: 1 2 |
| Tissue | Expression Dynamics | Abbreviation |
| Cervix |  | CC: Cervix cancer |
| HSIL_HPV: HPV-infected high-grade squamous intraepithelial lesions | ||
| N_HPV: HPV-infected normal cervix | ||
| Lung | 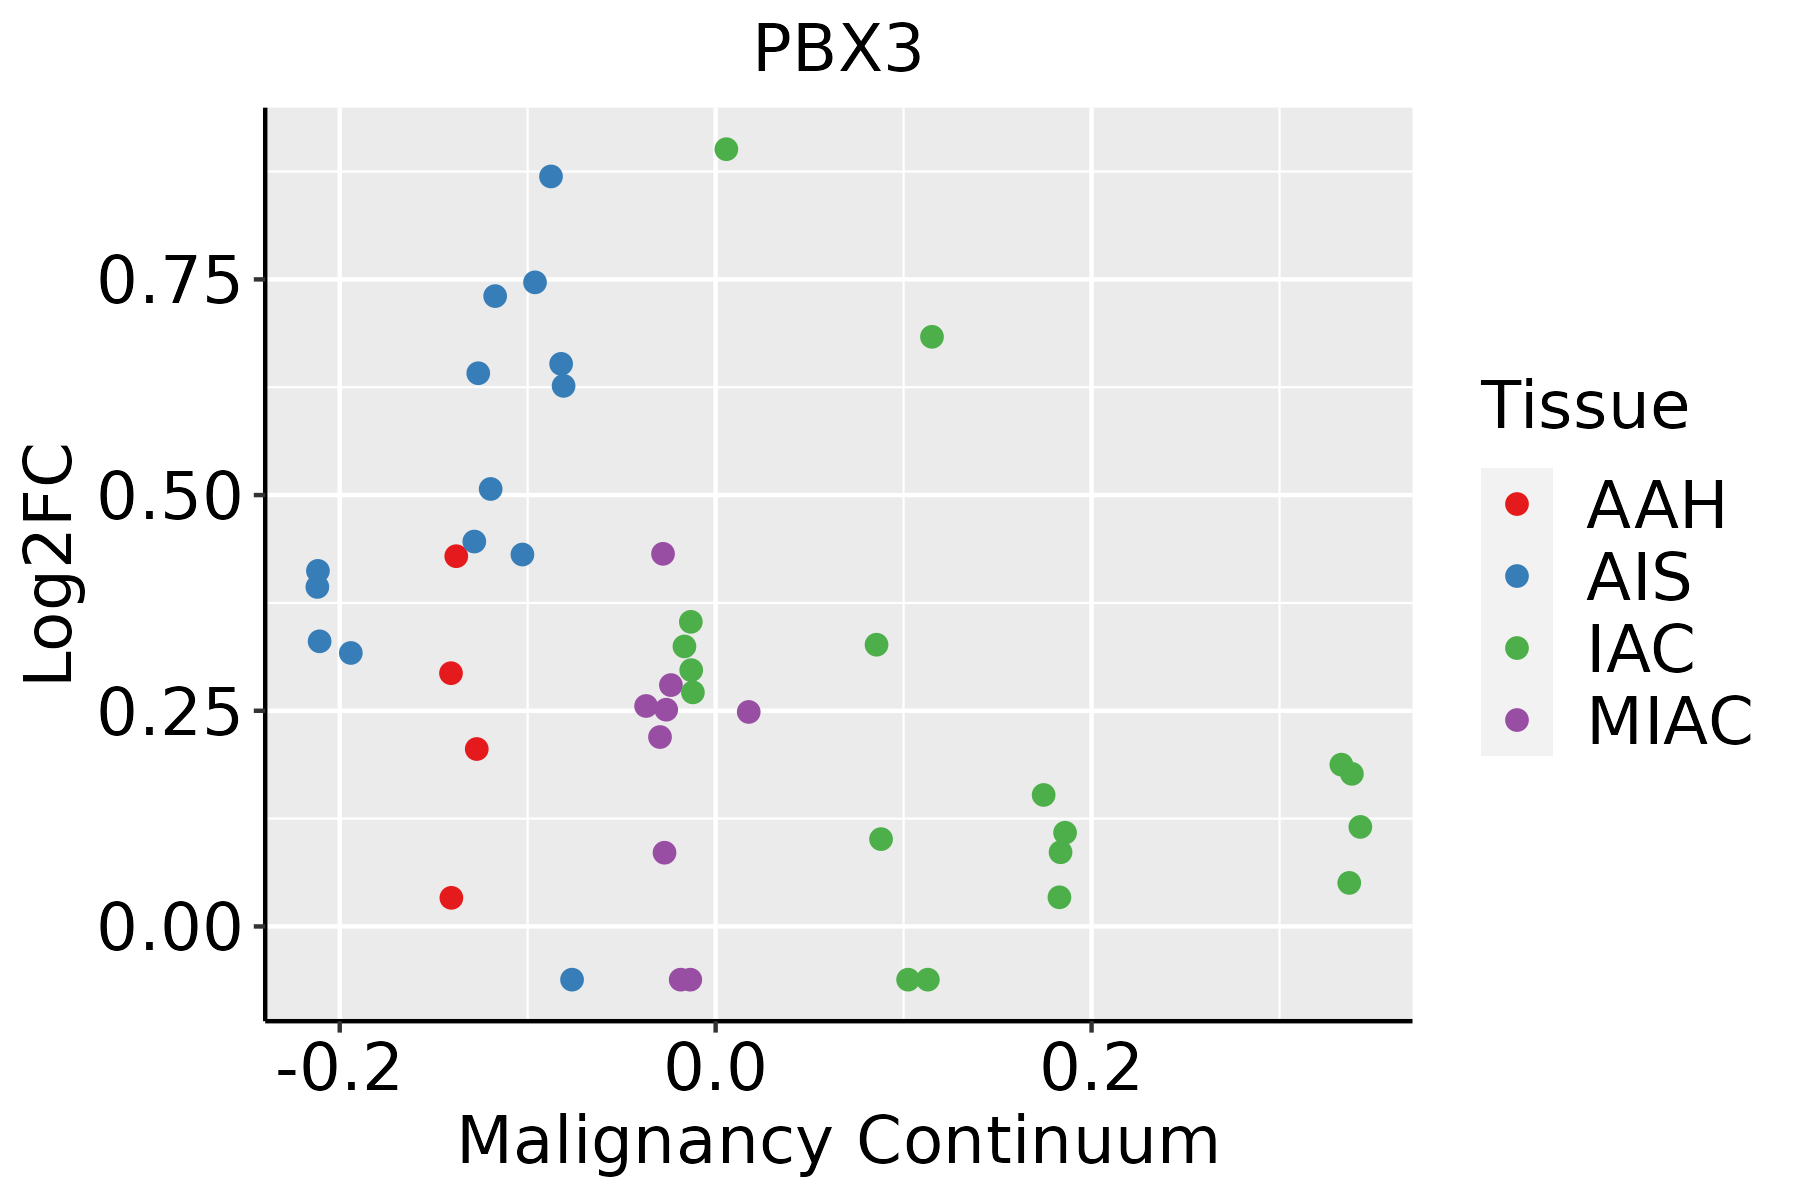 | AAH: Atypical adenomatous hyperplasia |
| AIS: Adenocarcinoma in situ | ||
| IAC: Invasive lung adenocarcinoma | ||
| MIA: Minimally invasive adenocarcinoma | ||
| Oral Cavity |  | EOLP: Erosive Oral lichen planus |
| LP: leukoplakia | ||
| NEOLP: Non-erosive oral lichen planus | ||
| OSCC: Oral squamous cell carcinoma | ||
| Prostate | 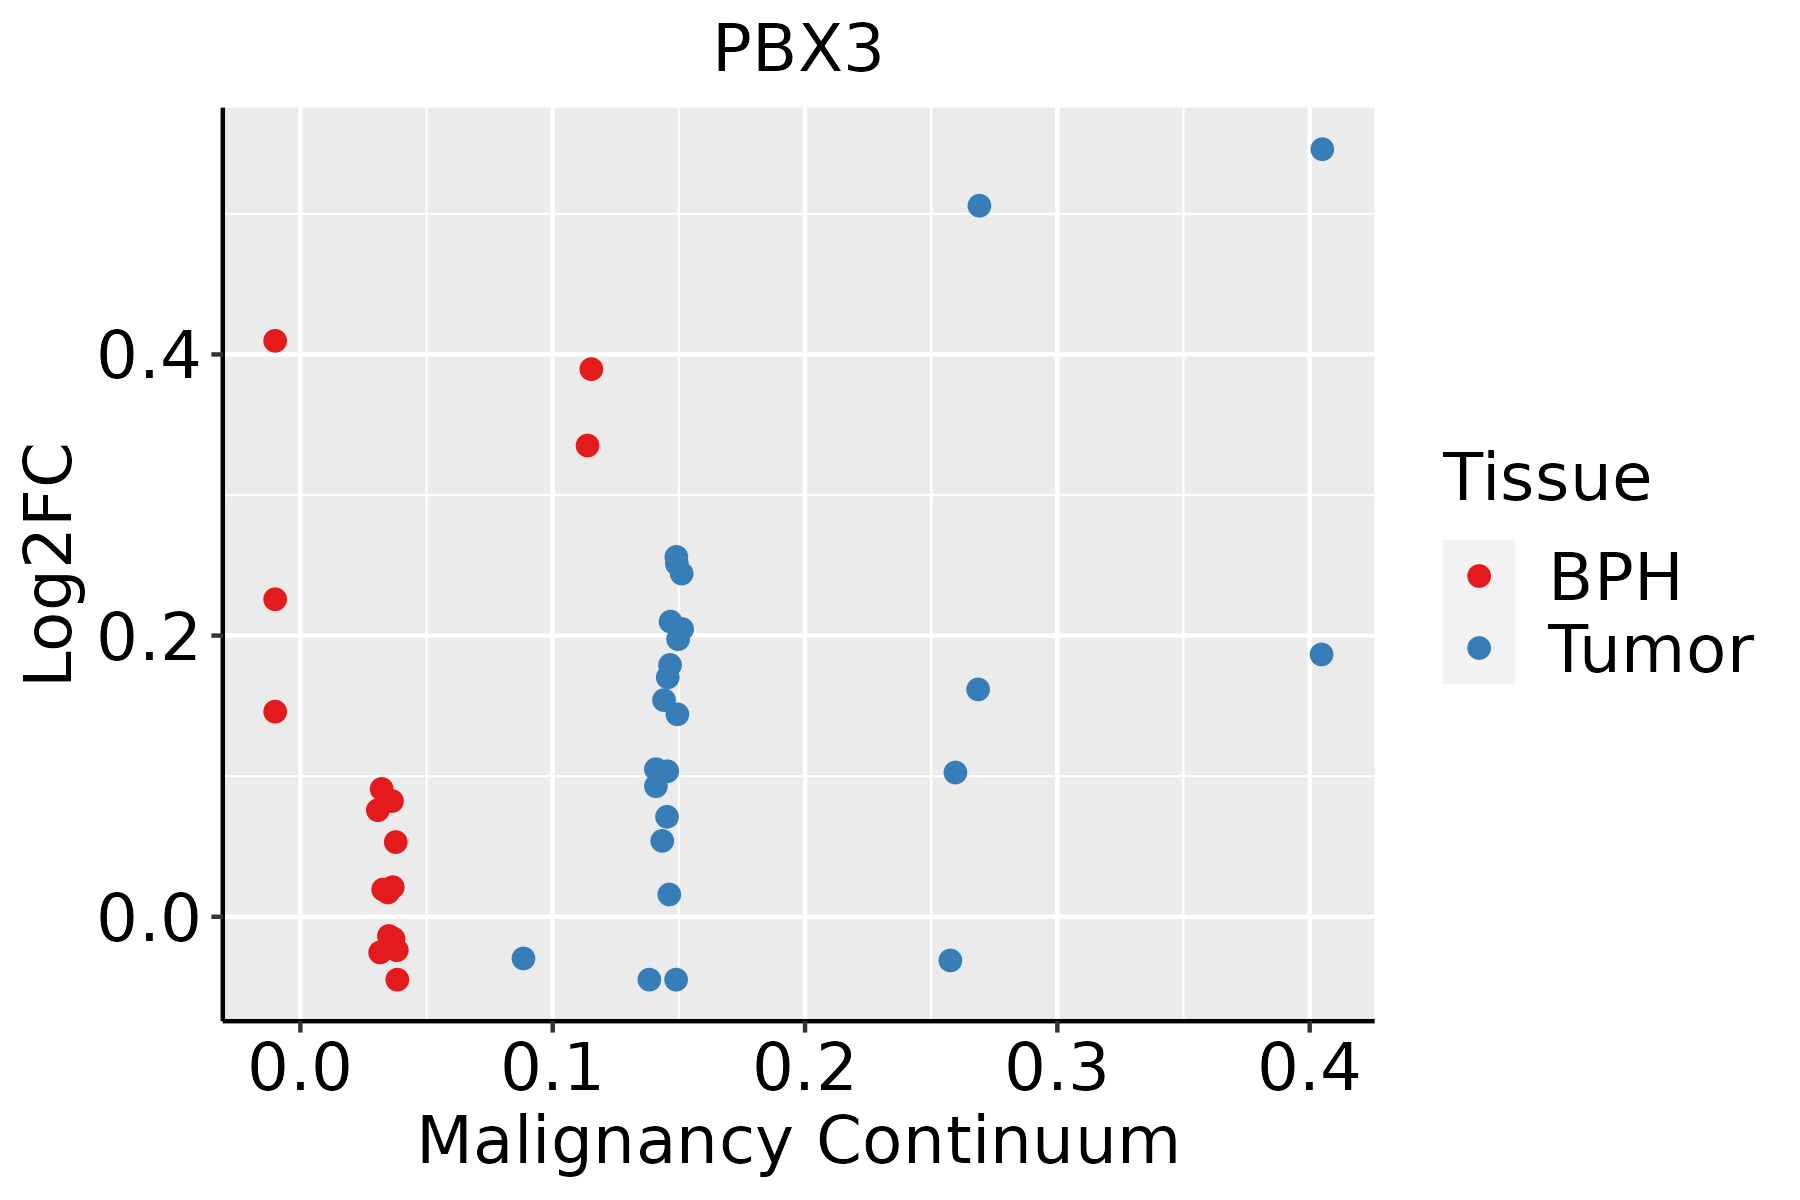 | BPH: Benign Prostatic Hyperplasia |
| Thyroid |  | ATC: Anaplastic thyroid cancer |
| HT: Hashimoto's thyroiditis | ||
| PTC: Papillary thyroid cancer |
| ∗log2FC in expression of this searched gene in stem-like cells from each diseased tissue sample relative to stem-like cells in normal samples in each tissue plotted against the malignancy continuum. Samples are colored based on if they are from different disease stage. |
Top |
Malignant transformation related pathway analysis |
| Find out the enriched GO biological processes and KEGG pathways involved in transition from healthy to precancer to cancer |
| Tissue | Disease Stage | Enriched GO biological Processes |
| Colorectum | AD |  |
| Colorectum | SER |  |
| Colorectum | MSS |  |
| Colorectum | MSI-H |  |
| Colorectum | FAP |  |
| ∗Top 15 enriched GO BP terms are showed in the bar plot of each disease state in each tissue. Each row represents a significant GO biological process which is colored according to the -log10(p.adjust). |
| Page: 1 2 3 4 5 6 7 8 9 |
| GO ID | Tissue | Disease Stage | Description | Gene Ratio | Bg Ratio | pvalue | p.adjust | Count |
| GO:0150063 | Cervix | CC | visual system development | 63/2311 | 375/18723 | 6.58e-03 | 3.65e-02 | 63 |
| GO:0001654 | Cervix | CC | eye development | 62/2311 | 371/18723 | 7.83e-03 | 4.13e-02 | 62 |
| GO:0048880 | Cervix | CC | sensory system development | 63/2311 | 381/18723 | 9.29e-03 | 4.66e-02 | 63 |
| GO:0007585 | Lung | IAC | respiratory gaseous exchange by respiratory system | 18/2061 | 68/18723 | 2.99e-04 | 4.82e-03 | 18 |
| GO:00485684 | Lung | IAC | embryonic organ development | 64/2061 | 427/18723 | 6.46e-03 | 4.59e-02 | 64 |
| GO:0007626 | Lung | AIS | locomotory behavior | 31/1849 | 179/18723 | 1.39e-03 | 1.70e-02 | 31 |
| GO:00075851 | Lung | AIS | respiratory gaseous exchange by respiratory system | 15/1849 | 68/18723 | 2.24e-03 | 2.38e-02 | 15 |
| GO:00016542 | Oral cavity | EOLP | eye development | 62/2218 | 371/18723 | 3.18e-03 | 1.85e-02 | 62 |
| GO:01500632 | Oral cavity | EOLP | visual system development | 62/2218 | 375/18723 | 4.07e-03 | 2.24e-02 | 62 |
| GO:00488802 | Oral cavity | EOLP | sensory system development | 62/2218 | 381/18723 | 5.82e-03 | 2.94e-02 | 62 |
| GO:00083442 | Oral cavity | EOLP | adult locomotory behavior | 16/2218 | 71/18723 | 7.90e-03 | 3.75e-02 | 16 |
| GO:01500631 | Oral cavity | NEOLP | visual system development | 70/2005 | 375/18723 | 2.46e-06 | 5.64e-05 | 70 |
| GO:000165411 | Oral cavity | NEOLP | eye development | 69/2005 | 371/18723 | 3.30e-06 | 7.40e-05 | 69 |
| GO:00488801 | Oral cavity | NEOLP | sensory system development | 70/2005 | 381/18723 | 4.38e-06 | 9.42e-05 | 70 |
| GO:00485686 | Oral cavity | NEOLP | embryonic organ development | 71/2005 | 427/18723 | 1.12e-04 | 1.34e-03 | 71 |
| GO:00083441 | Oral cavity | NEOLP | adult locomotory behavior | 15/2005 | 71/18723 | 7.39e-03 | 3.73e-02 | 15 |
| GO:00485685 | Prostate | Tumor | embryonic organ development | 93/3246 | 427/18723 | 9.84e-03 | 4.18e-02 | 93 |
| GO:00016541 | Prostate | Tumor | eye development | 82/3246 | 371/18723 | 1.02e-02 | 4.27e-02 | 82 |
| GO:00485688 | Thyroid | ATC | embryonic organ development | 172/6293 | 427/18723 | 2.08e-03 | 9.84e-03 | 172 |
| Page: 1 |
| Pathway ID | Tissue | Disease Stage | Description | Gene Ratio | Bg Ratio | pvalue | p.adjust | qvalue | Count |
| hsa052026 | Lung | IAC | Transcriptional misregulation in cancer | 40/1053 | 193/8465 | 6.90e-04 | 5.90e-03 | 3.92e-03 | 40 |
| hsa0520211 | Lung | IAC | Transcriptional misregulation in cancer | 40/1053 | 193/8465 | 6.90e-04 | 5.90e-03 | 3.92e-03 | 40 |
| hsa052022 | Lung | AIS | Transcriptional misregulation in cancer | 39/961 | 193/8465 | 2.15e-04 | 2.41e-03 | 1.54e-03 | 39 |
| hsa052023 | Lung | AIS | Transcriptional misregulation in cancer | 39/961 | 193/8465 | 2.15e-04 | 2.41e-03 | 1.54e-03 | 39 |
| hsa052027 | Prostate | BPH | Transcriptional misregulation in cancer | 53/1718 | 193/8465 | 9.56e-03 | 2.92e-02 | 1.81e-02 | 53 |
| hsa0520212 | Prostate | BPH | Transcriptional misregulation in cancer | 53/1718 | 193/8465 | 9.56e-03 | 2.92e-02 | 1.81e-02 | 53 |
| hsa0520221 | Prostate | Tumor | Transcriptional misregulation in cancer | 59/1791 | 193/8465 | 1.22e-03 | 5.26e-03 | 3.26e-03 | 59 |
| hsa0520231 | Prostate | Tumor | Transcriptional misregulation in cancer | 59/1791 | 193/8465 | 1.22e-03 | 5.26e-03 | 3.26e-03 | 59 |
| Page: 1 |
Top |
Cell-cell communication analysis |
| Identification of potential cell-cell interactions between two cell types and their ligand-receptor pairs for different disease states |
| Ligand | Receptor | LRpair | Pathway | Tissue | Disease Stage |
| Page: 1 |
Top |
Single-cell gene regulatory network inference analysis |
| Find out the significant the regulons (TFs) and the target genes of each regulon across cell types for different disease states |
| TF | Cell Type | Tissue | Disease Stage | Target Gene | RSS | Regulon Activity |
| PBX3 | PLA | Liver | Cirrhotic | CLECL1,HOMER3,CDK1, etc. | 1.31e-01 |  |
| PBX3 | BMEM | Liver | HCC | CLECL1,HOMER3,CDK1, etc. | 7.07e-02 |  |
| PBX3 | PLA | Liver | HCC | CLECL1,HOMER3,CDK1, etc. | 1.47e-01 | |
| PBX3 | STM | Lung | IAC | NPAS3,LINC01937,TMEM132D, etc. | 4.67e-02 |  |
| PBX3 | AT2L | Lung | MIAC | NPAS3,LINC01937,TMEM132D, etc. | 6.09e-01 |  |
| PBX3 | ABP | Lung | MIAC | NPAS3,LINC01937,TMEM132D, etc. | 2.66e-03 | |
| PBX3 | EE | Stomach | GC | PDK3,NKX6-3,ENPP4, etc. | 1.54e-01 |  |
| ∗The dot plots of a searched regulon are shown for all cell subpopulations in each disease state of each tissue based on the regulon specific score inferred using pySCENIC and by calculating the average expression. |
| Page: 1 |
Top |
Somatic mutation of malignant transformation related genes |
| Annotation of somatic variants for genes involved in malignant transformation |
| Hugo Symbol | Variant Class | Variant Classification | dbSNP RS | HGVSc | HGVSp | HGVSp Short | SWISSPROT | BIOTYPE | SIFT | PolyPhen | Tumor Sample Barcode | Tissue | Histology | Sex | Age | Stage | Therapy Types | Drugs | Outcome |
| PBX3 | SNV | Missense_Mutation | c.310N>A | p.Pro104Thr | p.P104T | P40426 | protein_coding | tolerated(0.11) | benign(0.033) | TCGA-A2-A0EQ-01 | Breast | breast invasive carcinoma | Female | <65 | I/II | Chemotherapy | adriamycin | SD | |
| PBX3 | SNV | Missense_Mutation | rs757125897 | c.623N>A | p.Arg208Gln | p.R208Q | P40426 | protein_coding | tolerated(0.08) | possibly_damaging(0.862) | TCGA-AN-A046-01 | Breast | breast invasive carcinoma | Female | >=65 | I/II | Unknown | Unknown | SD |
| PBX3 | SNV | Missense_Mutation | rs774888450 | c.1234G>A | p.Ala412Thr | p.A412T | P40426 | protein_coding | deleterious(0.04) | benign(0.195) | TCGA-BI-A0VR-01 | Cervix | cervical & endocervical cancer | Female | <65 | III/IV | Unknown | Unknown | SD |
| PBX3 | SNV | Missense_Mutation | novel | c.977A>G | p.Asn326Ser | p.N326S | P40426 | protein_coding | tolerated(1) | benign(0) | TCGA-DS-A5RQ-01 | Cervix | cervical & endocervical cancer | Female | >=65 | I/II | Chemotherapy | cisplatin | CR |
| PBX3 | SNV | Missense_Mutation | c.504G>T | p.Glu168Asp | p.E168D | P40426 | protein_coding | deleterious(0.02) | possibly_damaging(0.549) | TCGA-FU-A3HZ-01 | Cervix | cervical & endocervical cancer | Female | <65 | I/II | Chemotherapy | cisplatin | CR | |
| PBX3 | SNV | Missense_Mutation | c.1022C>A | p.Ser341Tyr | p.S341Y | P40426 | protein_coding | tolerated(0.09) | probably_damaging(0.929) | TCGA-FU-A3HZ-01 | Cervix | cervical & endocervical cancer | Female | <65 | I/II | Chemotherapy | cisplatin | CR | |
| PBX3 | SNV | Missense_Mutation | c.428N>T | p.Ser143Leu | p.S143L | P40426 | protein_coding | tolerated(0.32) | benign(0.04) | TCGA-Q1-A6DW-01 | Cervix | cervical & endocervical cancer | Female | <65 | I/II | Chemotherapy | cisplatin | SD | |
| PBX3 | SNV | Missense_Mutation | c.1289C>T | p.Ser430Leu | p.S430L | P40426 | protein_coding | deleterious(0) | benign(0.368) | TCGA-AA-A010-01 | Colorectum | colon adenocarcinoma | Female | <65 | I/II | Chemotherapy | folinic | CR | |
| PBX3 | SNV | Missense_Mutation | novel | c.722A>G | p.Asn241Ser | p.N241S | P40426 | protein_coding | deleterious(0.03) | possibly_damaging(0.854) | TCGA-CA-6717-01 | Colorectum | colon adenocarcinoma | Male | <65 | I/II | Chemotherapy | oxaliplatin | CR |
| PBX3 | SNV | Missense_Mutation | rs778017986 | c.1135N>T | p.Arg379Cys | p.R379C | P40426 | protein_coding | deleterious_low_confidence(0.01) | possibly_damaging(0.899) | TCGA-D5-6530-01 | Colorectum | colon adenocarcinoma | Male | <65 | I/II | Unknown | Unknown | SD |
| Page: 1 2 3 4 5 6 |
Top |
Related drugs of malignant transformation related genes |
| Identification of chemicals and drugs interact with genes involved in malignant transfromation |
| (DGIdb 4.0) |
| Entrez ID | Symbol | Category | Interaction Types | Drug Claim Name | Drug Name | PMIDs |
| Page: 1 |

Copyright 2023-Present -The University of Texas Health Science Center at Houston |