| Tissue | Expression Dynamics | Abbreviation |
| Cervix | 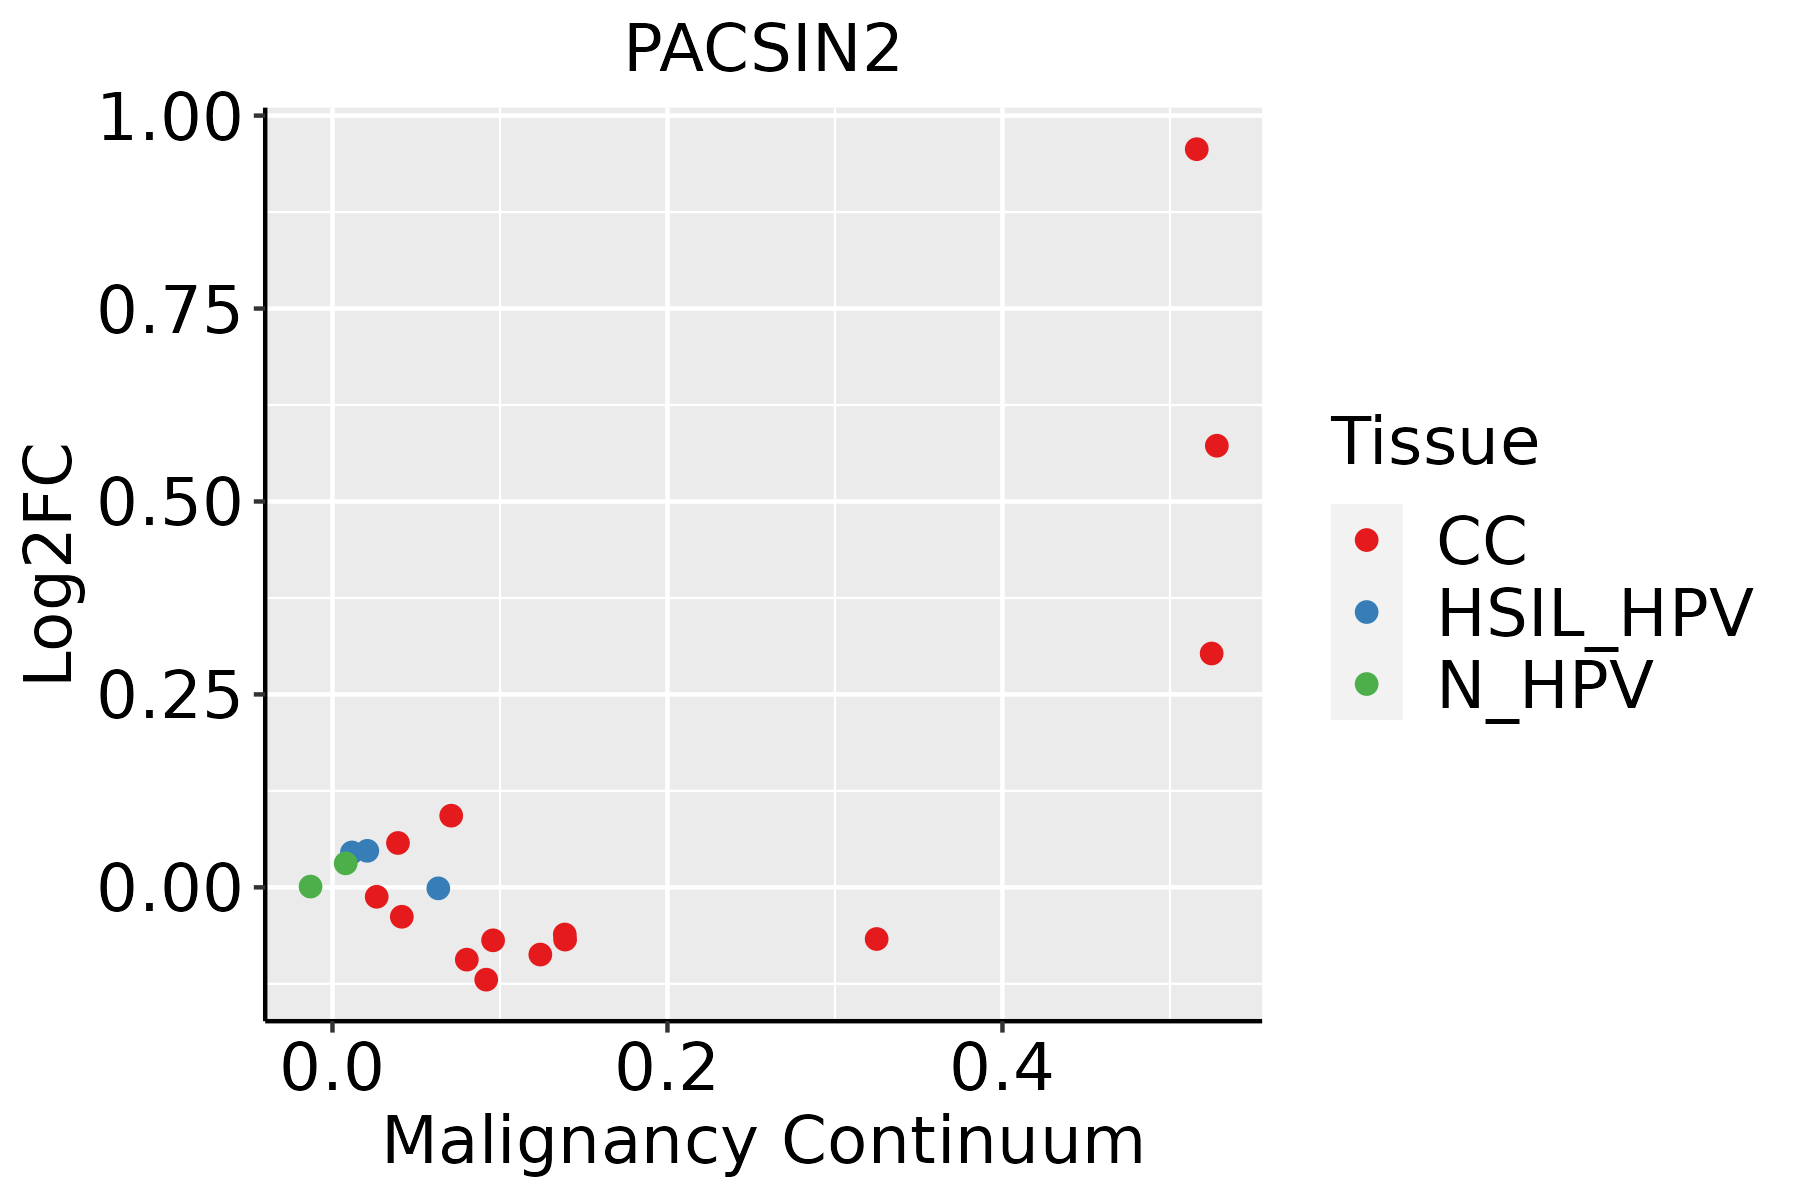 | CC: Cervix cancer |
| HSIL_HPV: HPV-infected high-grade squamous intraepithelial lesions |
| N_HPV: HPV-infected normal cervix |
| Colorectum (GSE201348) |  | FAP: Familial adenomatous polyposis |
| CRC: Colorectal cancer |
| Colorectum (HTA11) |  | AD: Adenomas |
| SER: Sessile serrated lesions |
| MSI-H: Microsatellite-high colorectal cancer |
| MSS: Microsatellite stable colorectal cancer |
| Esophagus | 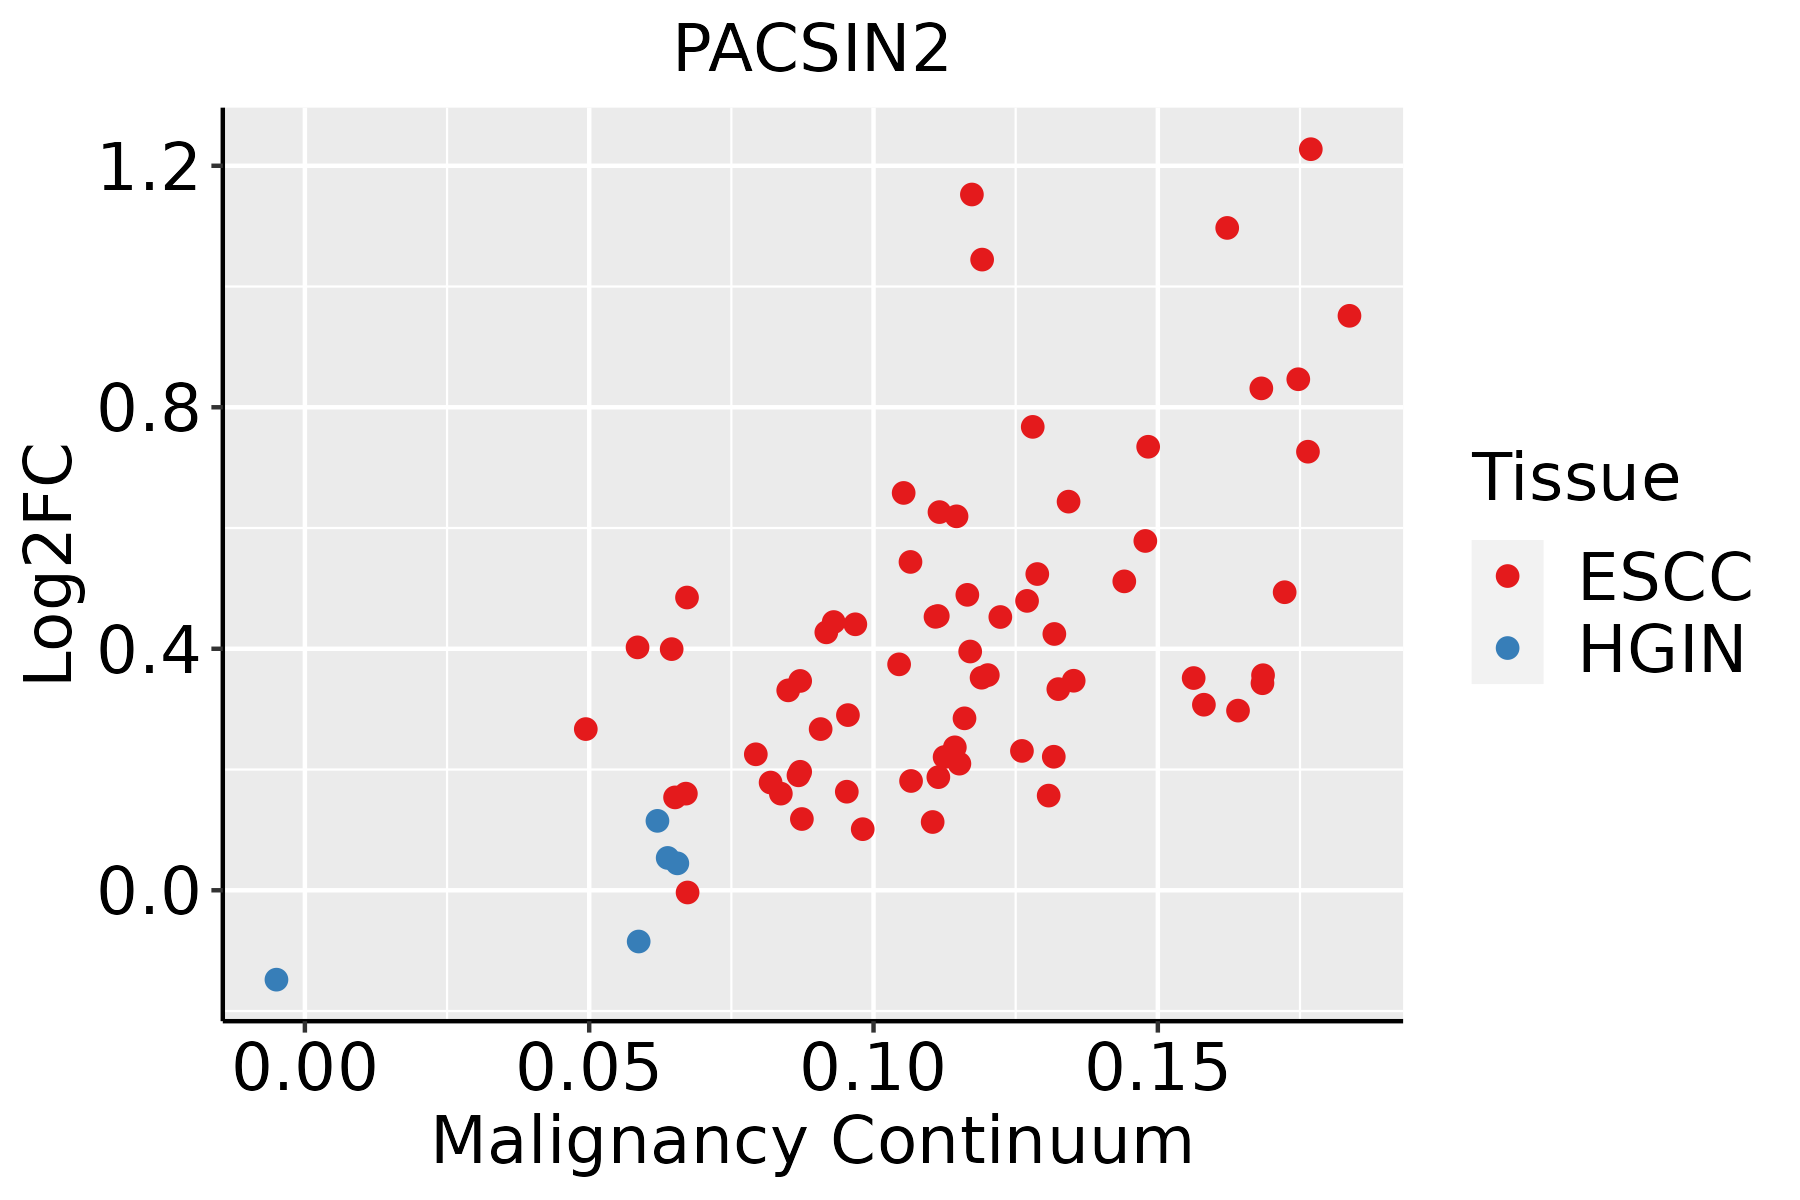 | ESCC: Esophageal squamous cell carcinoma |
| HGIN: High-grade intraepithelial neoplasias |
| LGIN: Low-grade intraepithelial neoplasias |
| Liver | 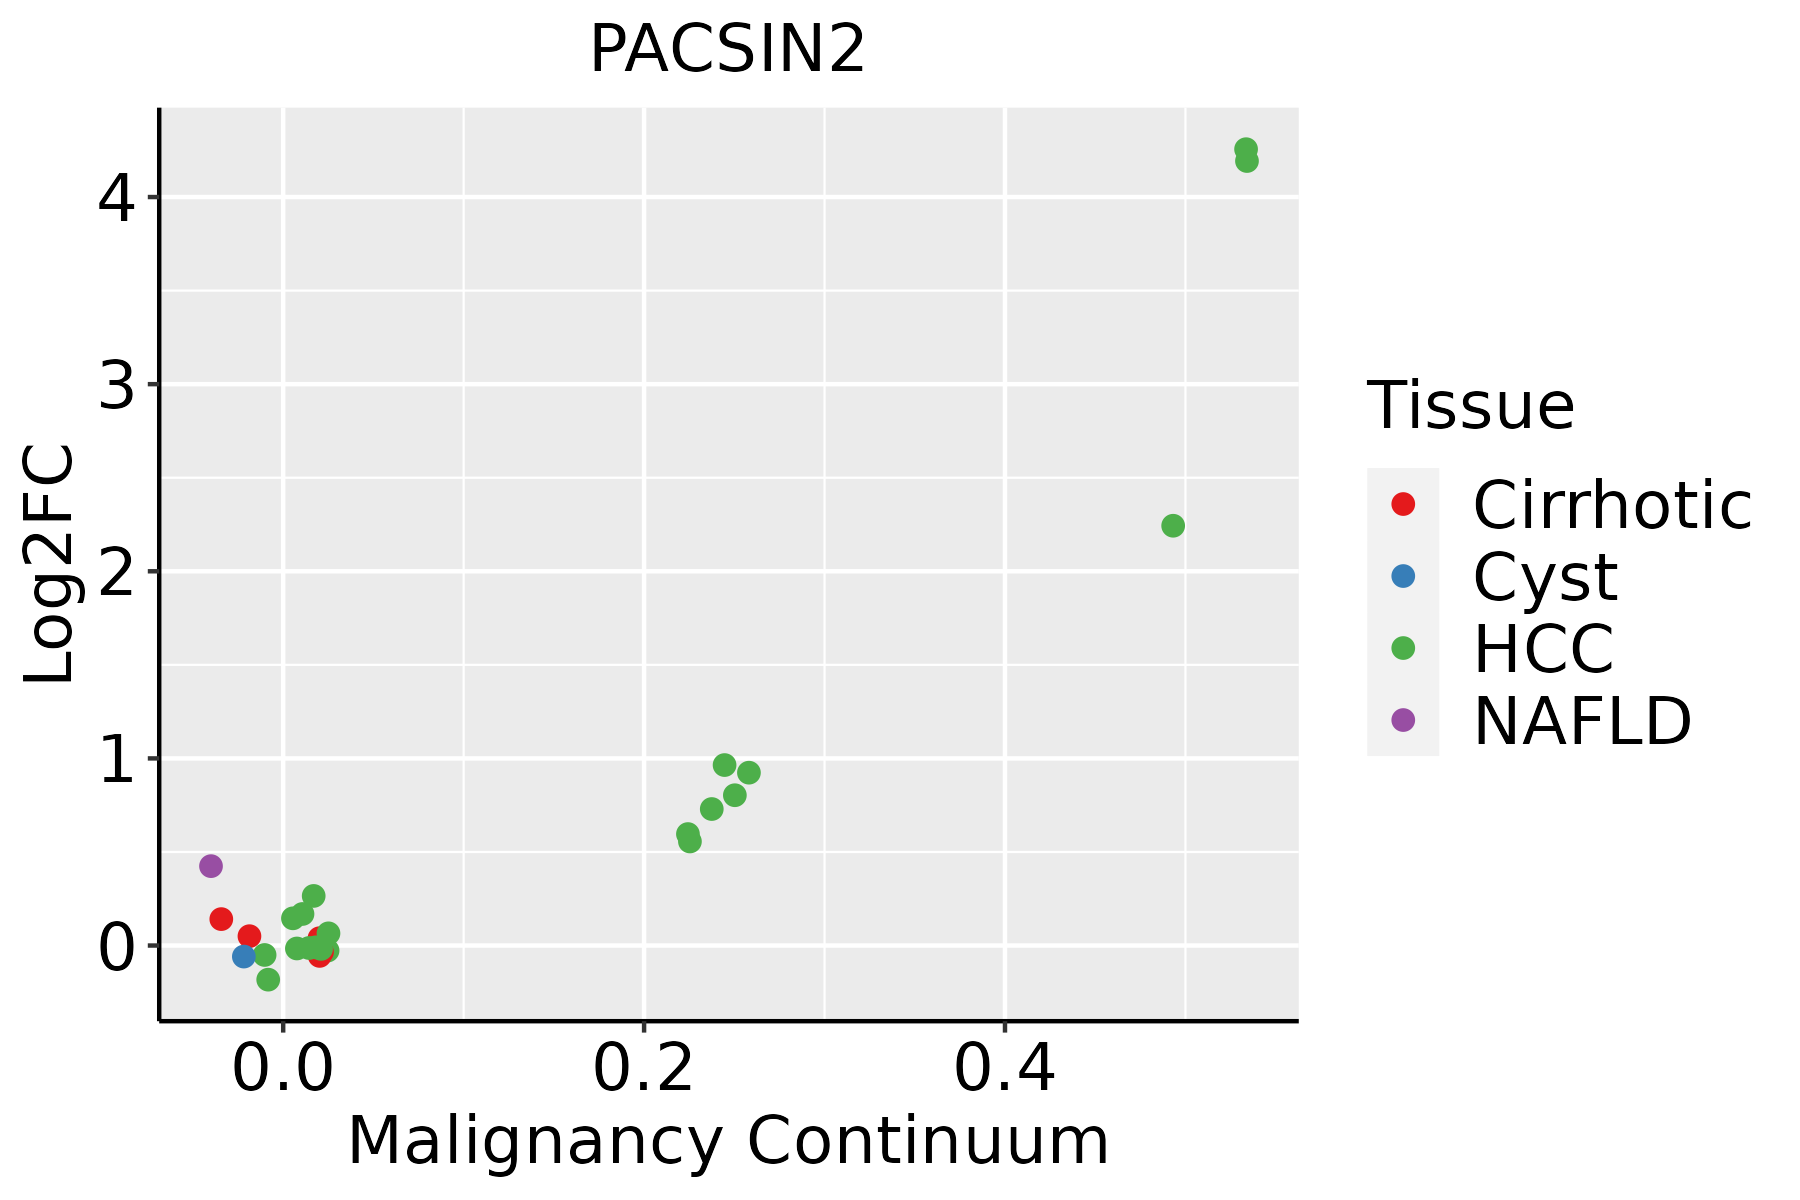 | HCC: Hepatocellular carcinoma |
| NAFLD: Non-alcoholic fatty liver disease |
| Lung |  | AAH: Atypical adenomatous hyperplasia |
| AIS: Adenocarcinoma in situ |
| IAC: Invasive lung adenocarcinoma |
| MIA: Minimally invasive adenocarcinoma |
| Oral Cavity | 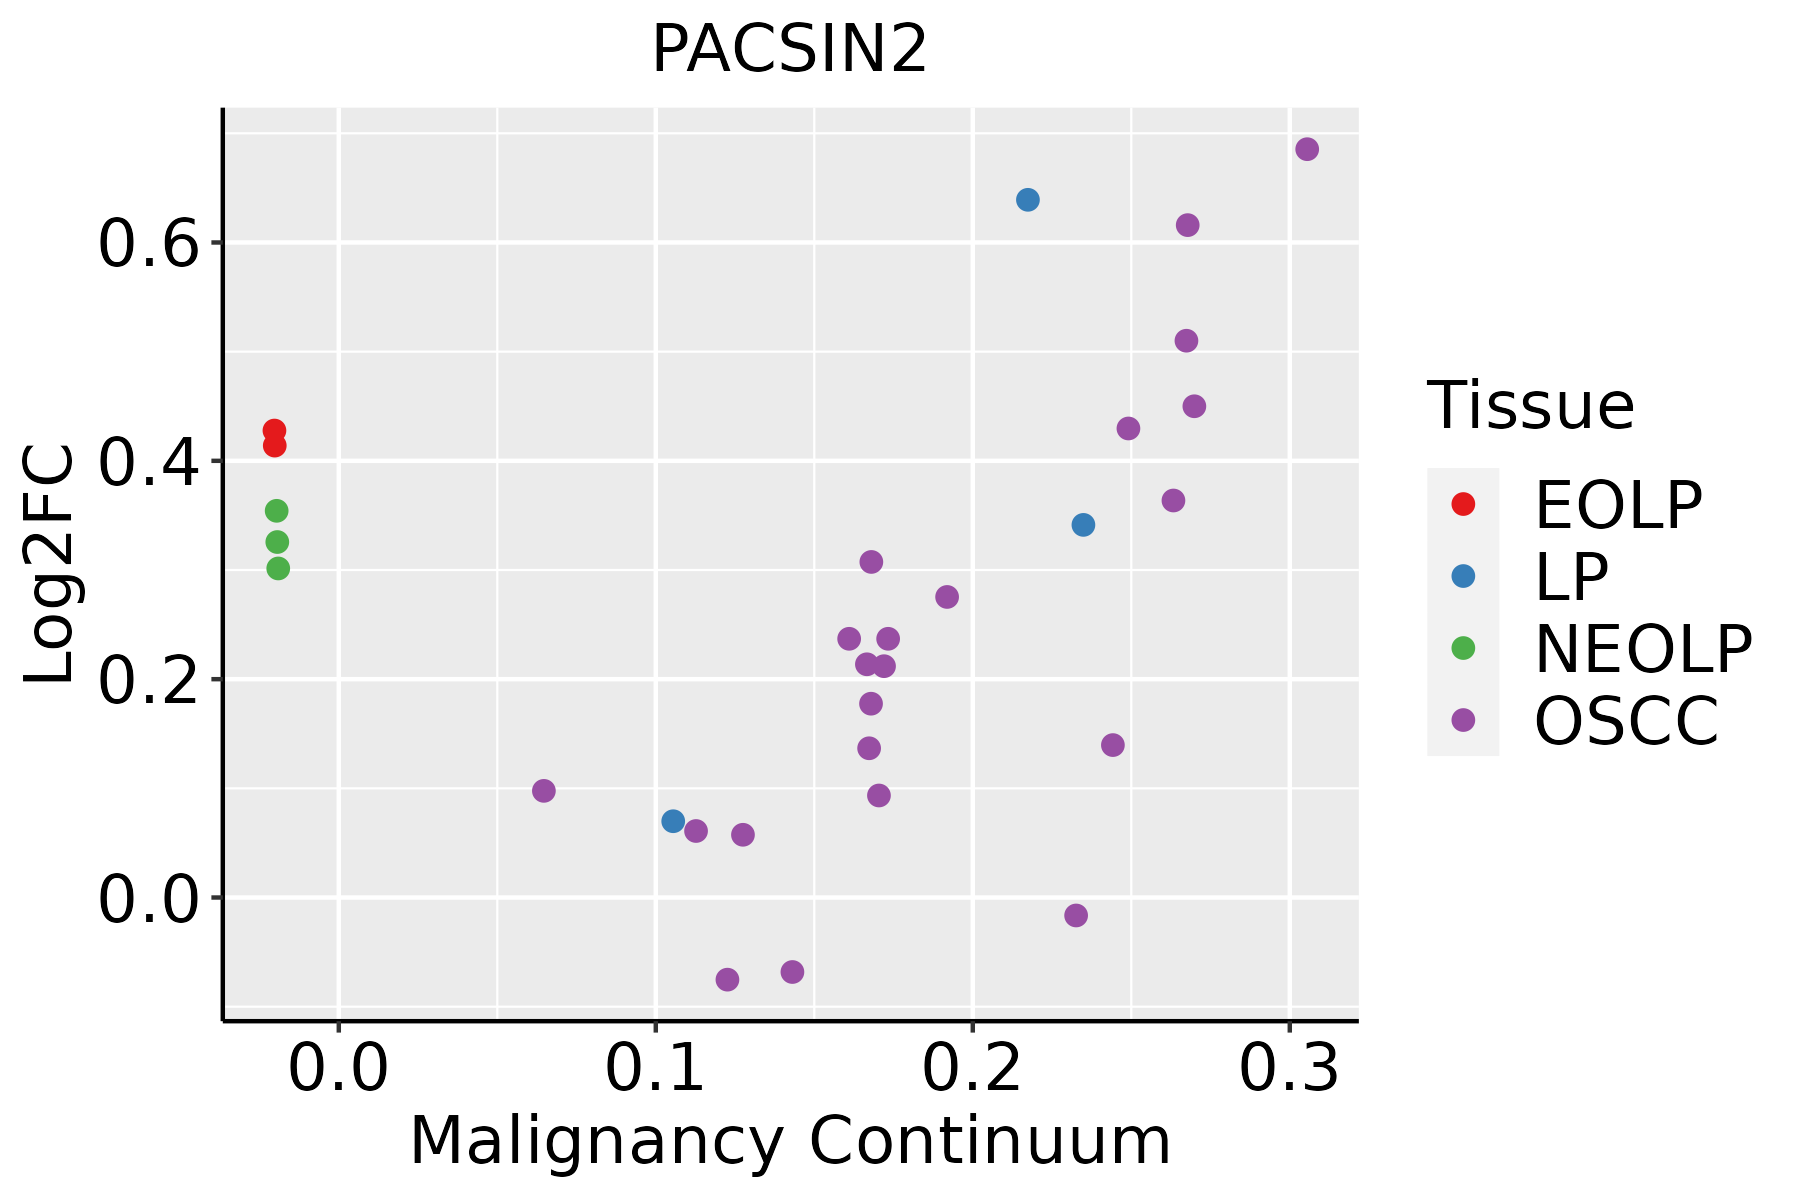 | EOLP: Erosive Oral lichen planus |
| LP: leukoplakia |
| NEOLP: Non-erosive oral lichen planus |
| OSCC: Oral squamous cell carcinoma |
| Prostate | 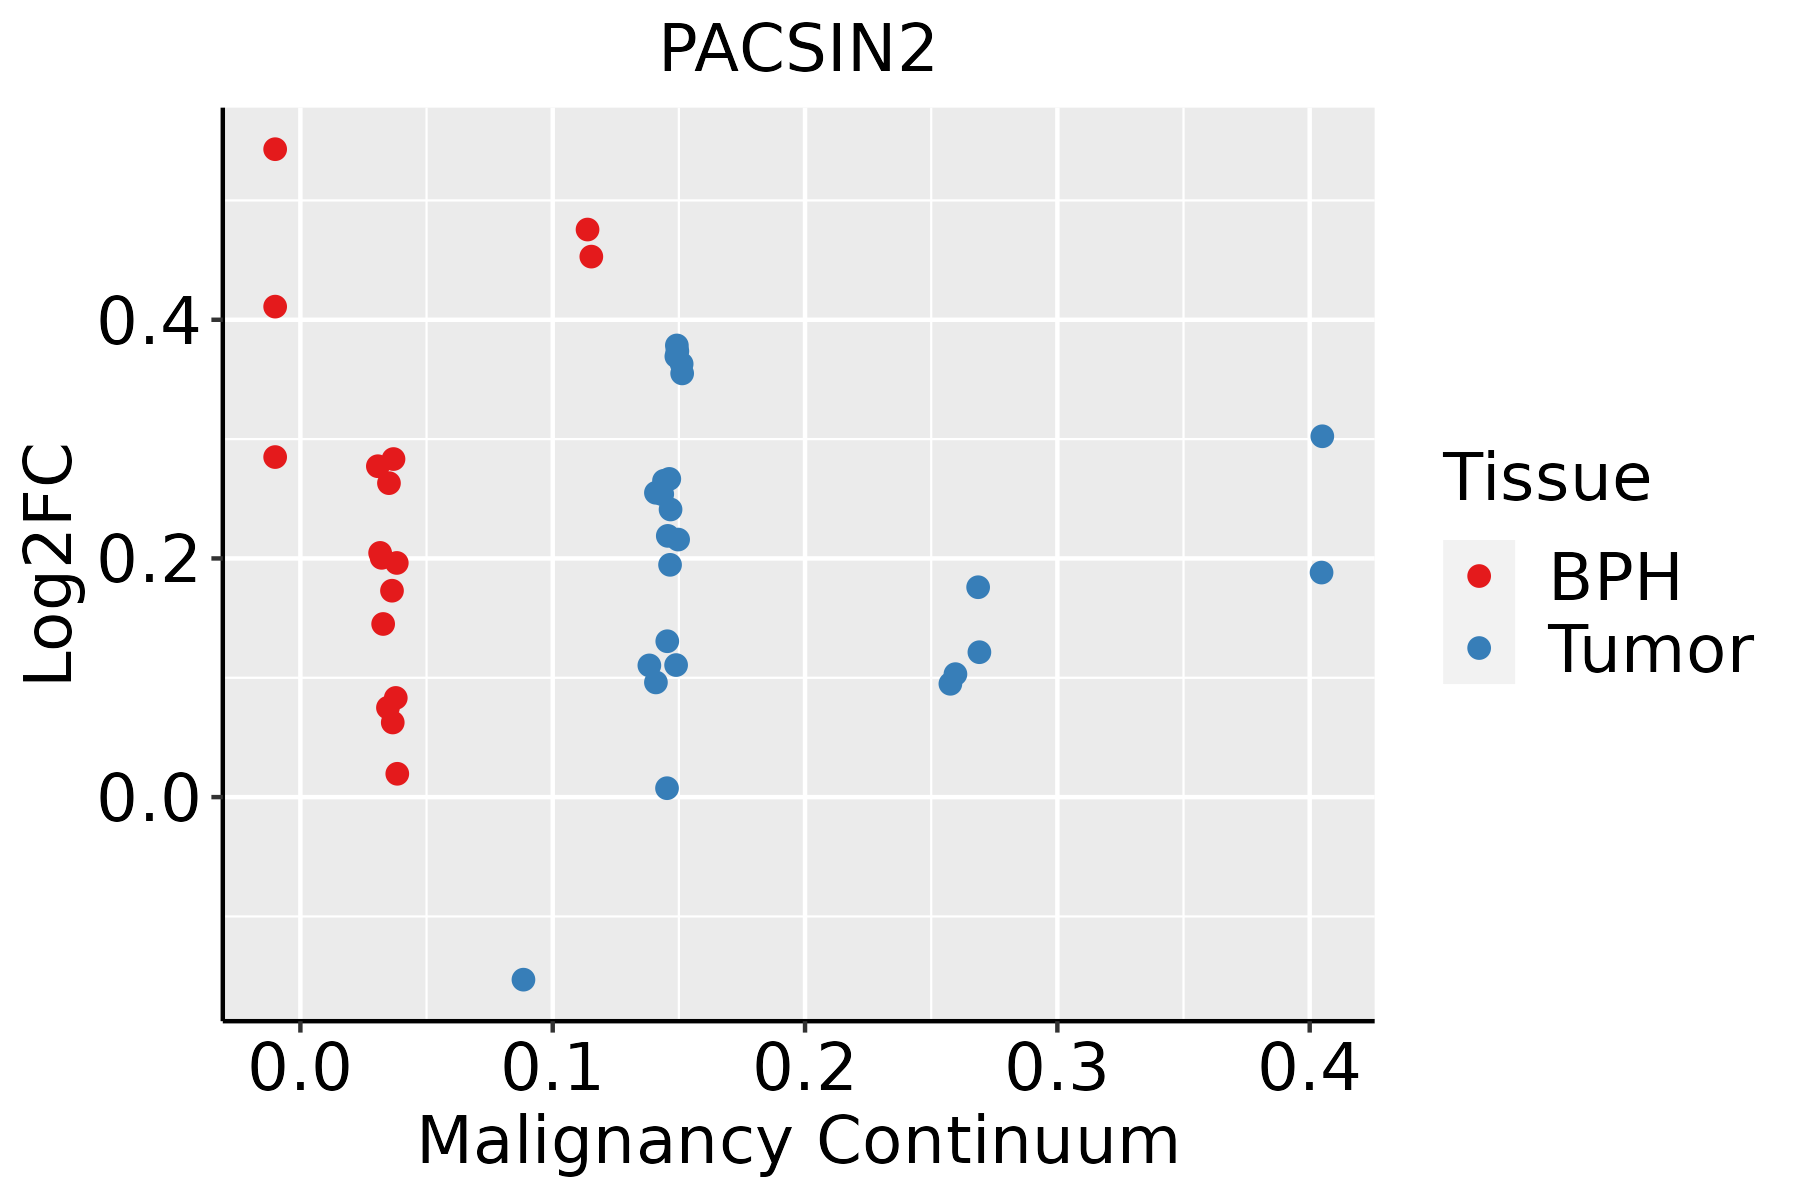 | BPH: Benign Prostatic Hyperplasia |
| Thyroid | 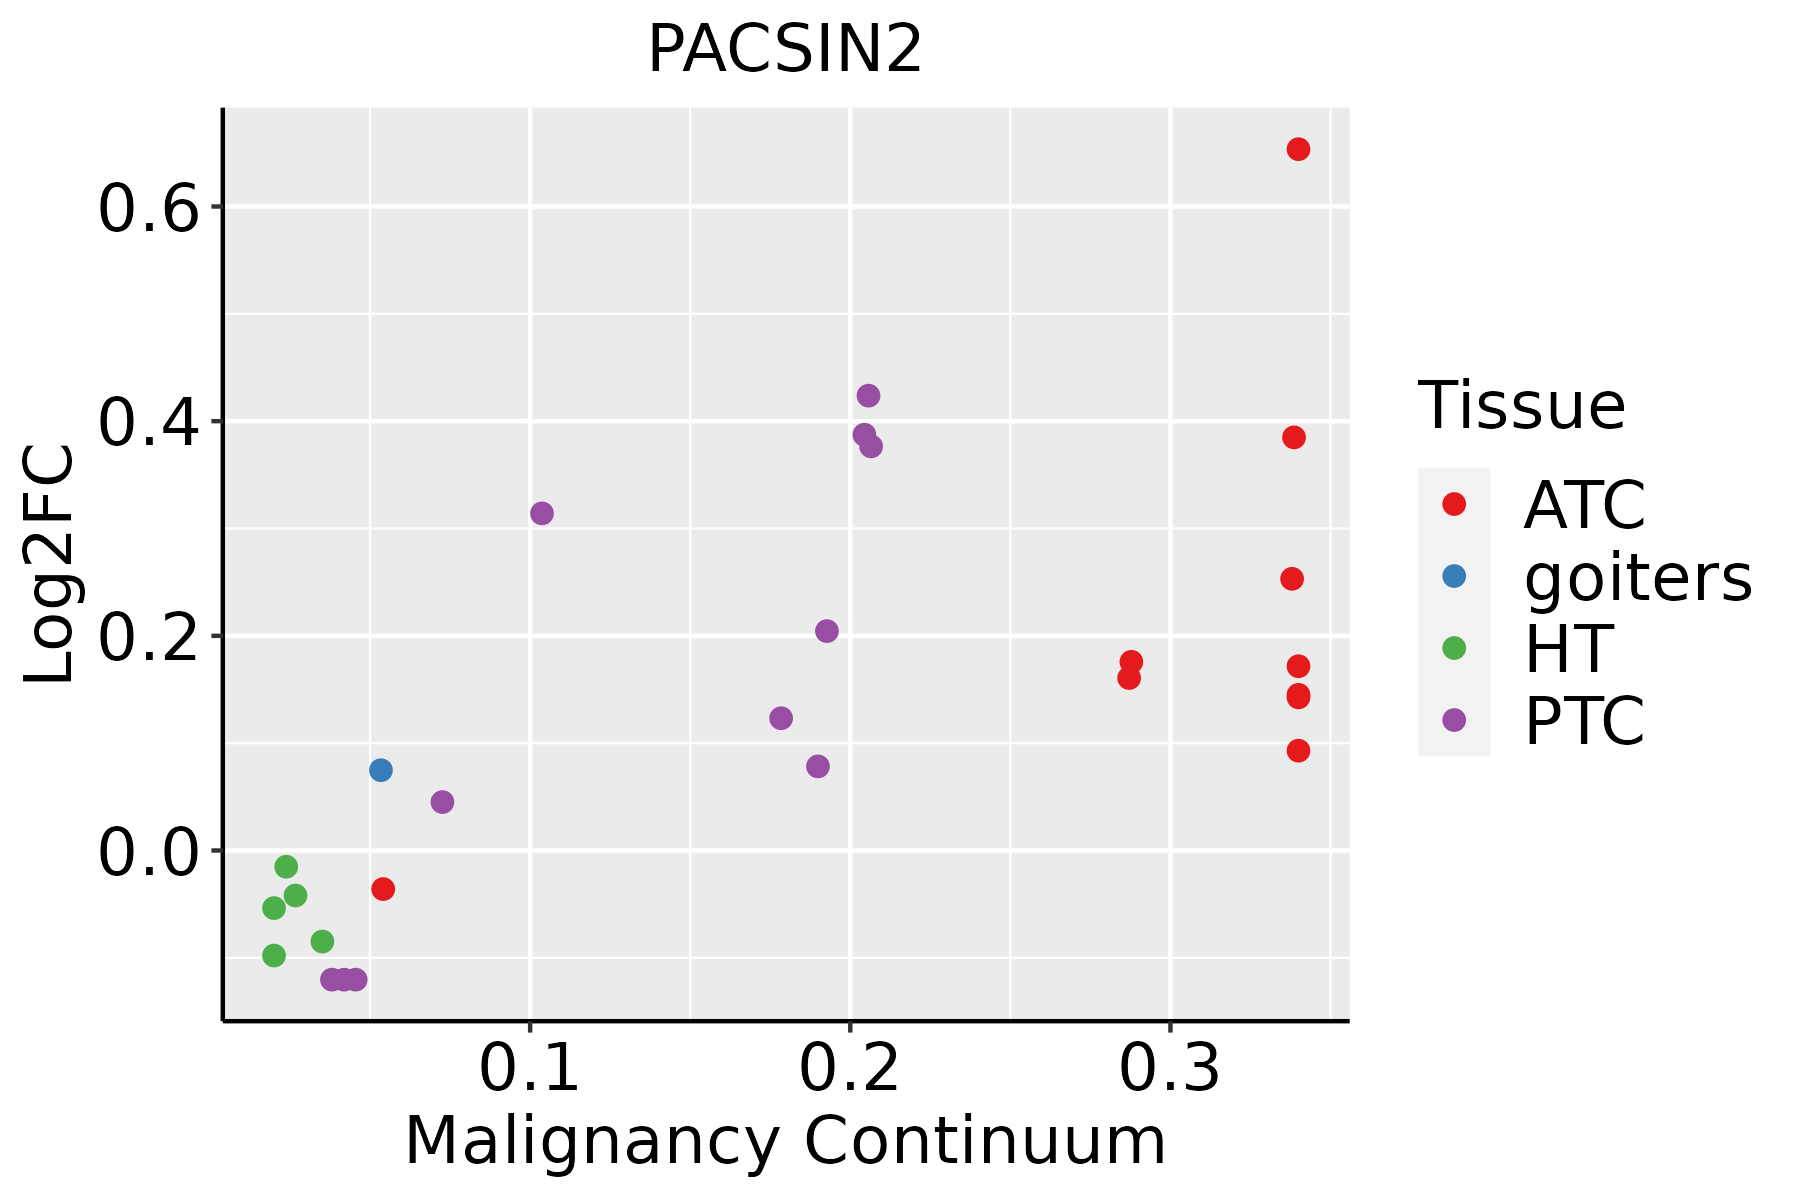 | ATC: Anaplastic thyroid cancer |
| HT: Hashimoto's thyroiditis |
| PTC: Papillary thyroid cancer |
| GO ID | Tissue | Disease Stage | Description | Gene Ratio | Bg Ratio | pvalue | p.adjust | Count |
| GO:00301008 | Cervix | CC | regulation of endocytosis | 47/2311 | 211/18723 | 3.65e-05 | 5.82e-04 | 47 |
| GO:00315795 | Cervix | CC | membrane raft organization | 9/2311 | 25/18723 | 2.09e-03 | 1.52e-02 | 9 |
| GO:00017652 | Cervix | CC | membrane raft assembly | 5/2311 | 11/18723 | 6.92e-03 | 3.74e-02 | 5 |
| GO:00070092 | Cervix | CC | plasma membrane organization | 28/2311 | 142/18723 | 7.85e-03 | 4.14e-02 | 28 |
| GO:0030100 | Colorectum | AD | regulation of endocytosis | 67/3918 | 211/18723 | 1.42e-04 | 2.01e-03 | 67 |
| GO:0071709 | Colorectum | AD | membrane assembly | 22/3918 | 50/18723 | 2.00e-04 | 2.66e-03 | 22 |
| GO:0044091 | Colorectum | AD | membrane biogenesis | 22/3918 | 55/18723 | 9.88e-04 | 9.28e-03 | 22 |
| GO:0036010 | Colorectum | AD | protein localization to endosome | 12/3918 | 24/18723 | 1.48e-03 | 1.25e-02 | 12 |
| GO:00717091 | Colorectum | SER | membrane assembly | 20/2897 | 50/18723 | 2.45e-05 | 6.84e-04 | 20 |
| GO:00440911 | Colorectum | SER | membrane biogenesis | 20/2897 | 55/18723 | 1.21e-04 | 2.49e-03 | 20 |
| GO:0051051 | Colorectum | SER | negative regulation of transport | 98/2897 | 470/18723 | 1.01e-03 | 1.19e-02 | 98 |
| GO:0007009 | Colorectum | SER | plasma membrane organization | 36/2897 | 142/18723 | 1.50e-03 | 1.62e-02 | 36 |
| GO:0031579 | Colorectum | SER | membrane raft organization | 10/2897 | 25/18723 | 2.70e-03 | 2.44e-02 | 10 |
| GO:00301001 | Colorectum | SER | regulation of endocytosis | 48/2897 | 211/18723 | 3.29e-03 | 2.82e-02 | 48 |
| GO:00360101 | Colorectum | SER | protein localization to endosome | 9/2897 | 24/18723 | 7.19e-03 | 4.99e-02 | 9 |
| GO:00301002 | Colorectum | MSS | regulation of endocytosis | 63/3467 | 211/18723 | 4.05e-05 | 7.66e-04 | 63 |
| GO:00360102 | Colorectum | MSS | protein localization to endosome | 12/3467 | 24/18723 | 4.68e-04 | 5.50e-03 | 12 |
| GO:00717092 | Colorectum | MSS | membrane assembly | 19/3467 | 50/18723 | 9.61e-04 | 9.67e-03 | 19 |
| GO:00440912 | Colorectum | MSS | membrane biogenesis | 19/3467 | 55/18723 | 3.47e-03 | 2.59e-02 | 19 |
| GO:00510511 | Colorectum | MSS | negative regulation of transport | 110/3467 | 470/18723 | 4.20e-03 | 3.04e-02 | 110 |
| Hugo Symbol | Variant Class | Variant Classification | dbSNP RS | HGVSc | HGVSp | HGVSp Short | SWISSPROT | BIOTYPE | SIFT | PolyPhen | Tumor Sample Barcode | Tissue | Histology | Sex | Age | Stage | Therapy Types | Drugs | Outcome |
| PACSIN2 | SNV | Missense_Mutation | | c.1349G>C | p.Gly450Ala | p.G450A | Q9UNF0 | protein_coding | deleterious(0) | probably_damaging(1) | TCGA-A2-A04P-01 | Breast | breast invasive carcinoma | Female | <65 | III/IV | Chemotherapy | taxol | PD |
| PACSIN2 | SNV | Missense_Mutation | novel | c.46G>A | p.Asp16Asn | p.D16N | Q9UNF0 | protein_coding | tolerated(0.07) | benign(0.072) | TCGA-D8-A1JP-01 | Breast | breast invasive carcinoma | Female | >=65 | I/II | Hormone Therapy | tamoxiphen | SD |
| PACSIN2 | SNV | Missense_Mutation | | c.249G>C | p.Trp83Cys | p.W83C | Q9UNF0 | protein_coding | deleterious(0) | probably_damaging(1) | TCGA-D8-A1XW-01 | Breast | breast invasive carcinoma | Female | <65 | I/II | Chemotherapy | adriamycin+cyclophosphamide | SD |
| PACSIN2 | SNV | Missense_Mutation | | c.993G>C | p.Gln331His | p.Q331H | Q9UNF0 | protein_coding | tolerated(0.13) | benign(0.001) | TCGA-E2-A1LH-01 | Breast | breast invasive carcinoma | Female | <65 | I/II | Chemotherapy | adriamycin | SD |
| PACSIN2 | SNV | Missense_Mutation | novel | c.315G>C | p.Met105Ile | p.M105I | Q9UNF0 | protein_coding | tolerated(0.39) | benign(0.02) | TCGA-GM-A3NW-01 | Breast | breast invasive carcinoma | Female | <65 | I/II | Chemotherapy | fluorouracil | SD |
| PACSIN2 | insertion | Nonsense_Mutation | novel | c.172_173insGAGTTAACTCAGAACTCGGGTAAGTTCCTATCACGTGGA | p.Gln58delinsArgValAsnSerGluLeuGlyTerValProIleThrTrpLys | p.Q58delinsRVNSELG*VPITWK | Q9UNF0 | protein_coding | | | TCGA-A8-A09W-01 | Breast | breast invasive carcinoma | Female | >=65 | III/IV | Unknown | Unknown | SD |
| PACSIN2 | insertion | Nonsense_Mutation | novel | c.88_89insTGACAGATATGGCCGCTGGAAGGTAGGTG | p.Arg30LeufsTer9 | p.R30Lfs*9 | Q9UNF0 | protein_coding | | | TCGA-B6-A0I8-01 | Breast | breast invasive carcinoma | Female | <65 | I/II | Unknown | Unknown | PD |
| PACSIN2 | SNV | Missense_Mutation | | c.205N>A | p.Leu69Ile | p.L69I | Q9UNF0 | protein_coding | tolerated(0.07) | possibly_damaging(0.899) | TCGA-DR-A0ZM-01 | Cervix | cervical & endocervical cancer | Female | <65 | III/IV | Unspecific | Cisplatin | SD |
| PACSIN2 | SNV | Missense_Mutation | | c.894N>C | p.Trp298Cys | p.W298C | Q9UNF0 | protein_coding | deleterious(0) | probably_damaging(0.921) | TCGA-AA-3492-01 | Colorectum | colon adenocarcinoma | Female | >=65 | I/II | Unknown | Unknown | SD |
| PACSIN2 | SNV | Missense_Mutation | rs531993562 | c.1258N>A | p.Asp420Asn | p.D420N | Q9UNF0 | protein_coding | tolerated(0.07) | benign(0.01) | TCGA-AA-A00N-01 | Colorectum | colon adenocarcinoma | Male | >=65 | I/II | Unknown | Unknown | PD |


