
|
|||||
|
 | |
| |
| |
| |
| |
| |
|
Gene: NUB1 |
Gene summary for NUB1 |
| Gene information | Species | Human | Gene symbol | NUB1 | Gene ID | 51667 |
| Gene name | negative regulator of ubiquitin like proteins 1 | |
| Gene Alias | BS4 | |
| Cytomap | 7q36.1 | |
| Gene Type | protein-coding | GO ID | GO:0002376 | UniProtAcc | H3BM74 |
Top |
Malignant transformation analysis |
| Identification of the aberrant gene expression in precancerous and cancerous lesions by comparing the gene expression of stem-like cells in diseased tissues with normal stem cells |
| Entrez ID | Symbol | Replicates | Species | Organ | Tissue | Adj P-value | Log2FC | Malignancy |
| 51667 | NUB1 | P19T-E | Human | Esophagus | ESCC | 8.67e-09 | 7.68e-01 | 0.1662 |
| 51667 | NUB1 | P20T-E | Human | Esophagus | ESCC | 1.13e-15 | 3.58e-01 | 0.1124 |
| 51667 | NUB1 | P21T-E | Human | Esophagus | ESCC | 6.59e-33 | 7.43e-01 | 0.1617 |
| 51667 | NUB1 | P22T-E | Human | Esophagus | ESCC | 5.91e-14 | 3.31e-01 | 0.1236 |
| 51667 | NUB1 | P23T-E | Human | Esophagus | ESCC | 3.24e-18 | 3.89e-01 | 0.108 |
| 51667 | NUB1 | P24T-E | Human | Esophagus | ESCC | 3.75e-24 | 6.78e-01 | 0.1287 |
| 51667 | NUB1 | P26T-E | Human | Esophagus | ESCC | 2.09e-29 | 5.28e-01 | 0.1276 |
| 51667 | NUB1 | P27T-E | Human | Esophagus | ESCC | 3.40e-20 | 5.65e-01 | 0.1055 |
| 51667 | NUB1 | P28T-E | Human | Esophagus | ESCC | 1.78e-21 | 6.10e-01 | 0.1149 |
| 51667 | NUB1 | P30T-E | Human | Esophagus | ESCC | 5.78e-18 | 7.14e-01 | 0.137 |
| 51667 | NUB1 | P31T-E | Human | Esophagus | ESCC | 2.89e-18 | 4.09e-01 | 0.1251 |
| 51667 | NUB1 | P32T-E | Human | Esophagus | ESCC | 7.11e-30 | 6.89e-01 | 0.1666 |
| 51667 | NUB1 | P36T-E | Human | Esophagus | ESCC | 2.33e-13 | 5.58e-01 | 0.1187 |
| 51667 | NUB1 | P37T-E | Human | Esophagus | ESCC | 3.40e-25 | 5.25e-01 | 0.1371 |
| 51667 | NUB1 | P38T-E | Human | Esophagus | ESCC | 2.40e-09 | 3.30e-01 | 0.127 |
| 51667 | NUB1 | P39T-E | Human | Esophagus | ESCC | 2.22e-12 | 2.53e-01 | 0.0894 |
| 51667 | NUB1 | P40T-E | Human | Esophagus | ESCC | 2.27e-19 | 4.84e-01 | 0.109 |
| 51667 | NUB1 | P42T-E | Human | Esophagus | ESCC | 6.11e-20 | 5.25e-01 | 0.1175 |
| 51667 | NUB1 | P44T-E | Human | Esophagus | ESCC | 7.67e-18 | 4.64e-01 | 0.1096 |
| 51667 | NUB1 | P47T-E | Human | Esophagus | ESCC | 2.45e-20 | 3.38e-01 | 0.1067 |
| Page: 1 2 3 4 5 6 |
| Tissue | Expression Dynamics | Abbreviation |
| Esophagus |  | ESCC: Esophageal squamous cell carcinoma |
| HGIN: High-grade intraepithelial neoplasias | ||
| LGIN: Low-grade intraepithelial neoplasias | ||
| Liver | 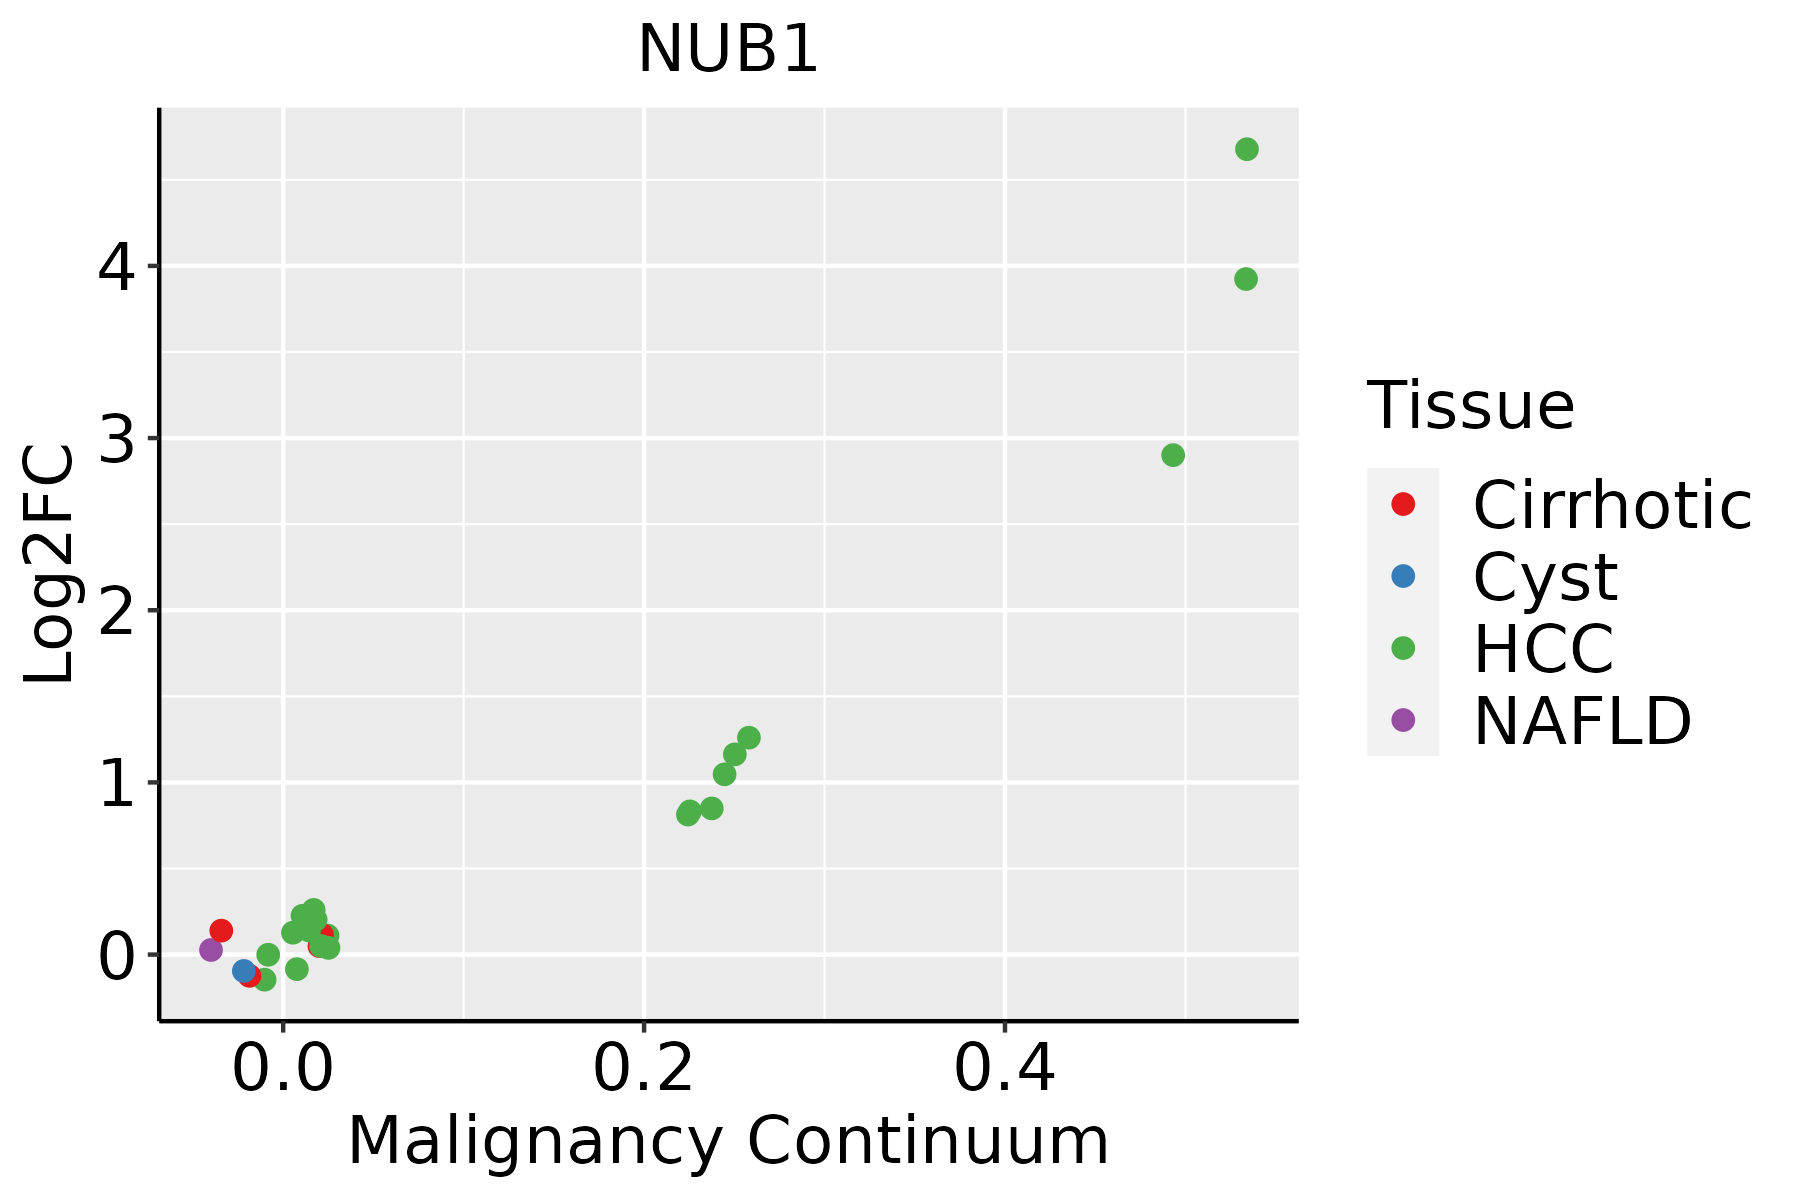 | HCC: Hepatocellular carcinoma |
| NAFLD: Non-alcoholic fatty liver disease | ||
| Oral Cavity | 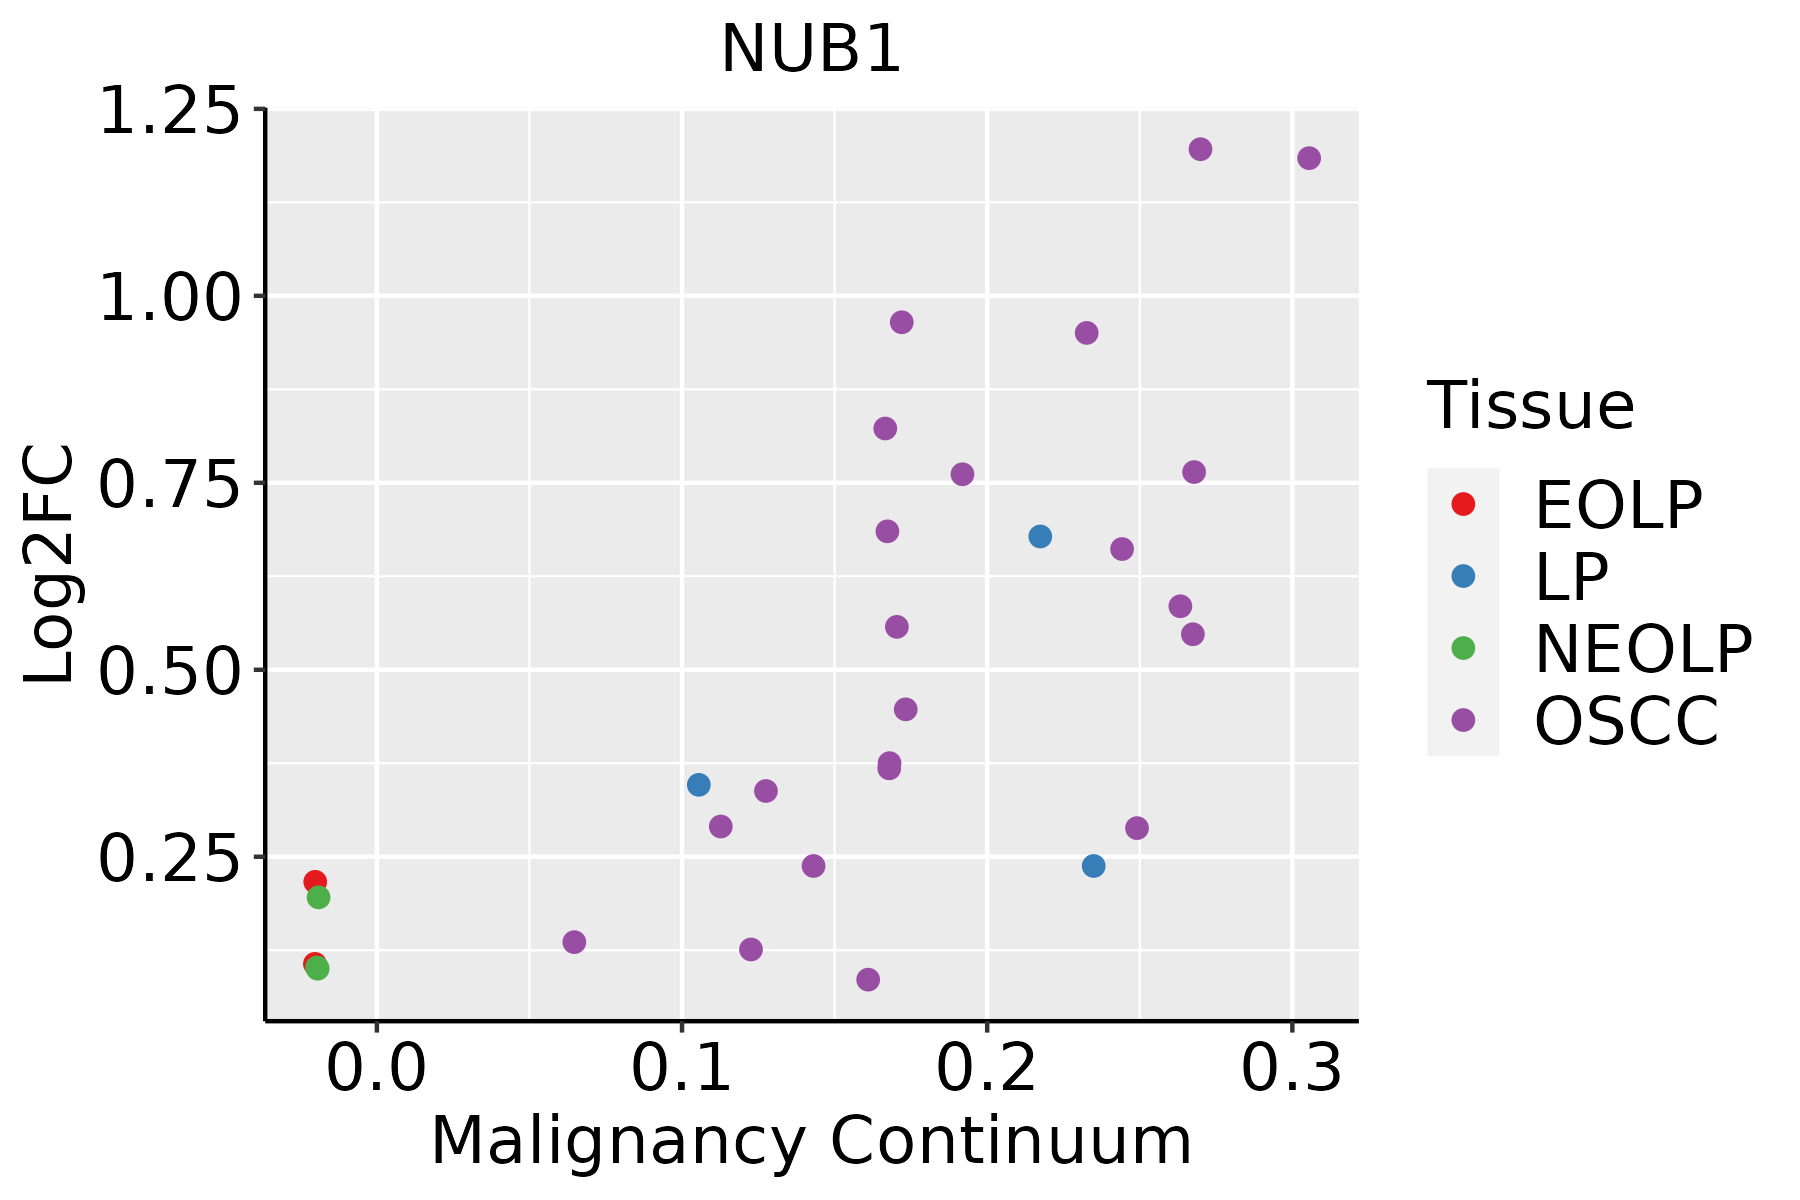 | EOLP: Erosive Oral lichen planus |
| LP: leukoplakia | ||
| NEOLP: Non-erosive oral lichen planus | ||
| OSCC: Oral squamous cell carcinoma | ||
| Skin |  | AK: Actinic keratosis |
| cSCC: Cutaneous squamous cell carcinoma | ||
| SCCIS:squamous cell carcinoma in situ | ||
| Thyroid | 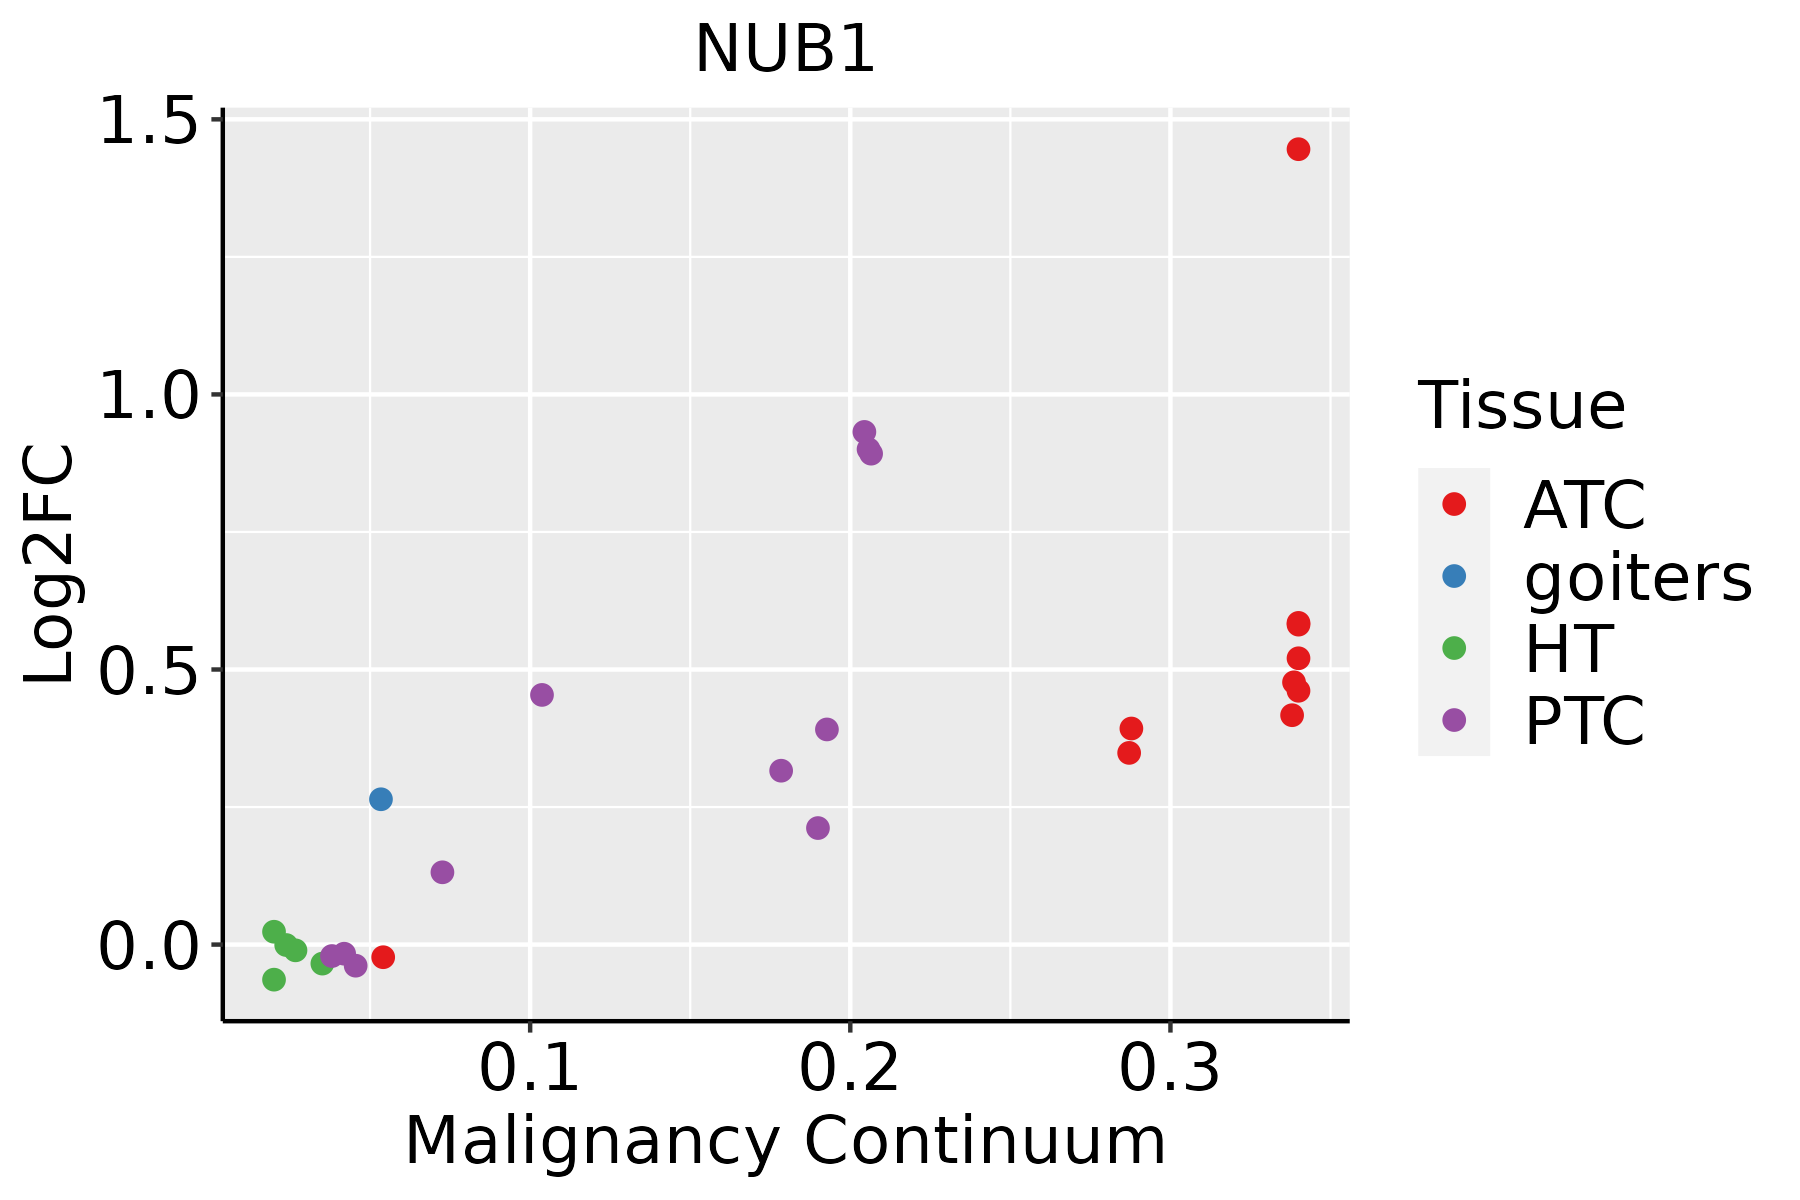 | ATC: Anaplastic thyroid cancer |
| HT: Hashimoto's thyroiditis | ||
| PTC: Papillary thyroid cancer |
| ∗log2FC in expression of this searched gene in stem-like cells from each diseased tissue sample relative to stem-like cells in normal samples in each tissue plotted against the malignancy continuum. Samples are colored based on if they are from different disease stage. |
Top |
Malignant transformation related pathway analysis |
| Find out the enriched GO biological processes and KEGG pathways involved in transition from healthy to precancer to cancer |
| Tissue | Disease Stage | Enriched GO biological Processes |
| Colorectum | AD |  |
| Colorectum | SER |  |
| Colorectum | MSS |  |
| Colorectum | MSI-H |  |
| Colorectum | FAP |  |
| ∗Top 15 enriched GO BP terms are showed in the bar plot of each disease state in each tissue. Each row represents a significant GO biological process which is colored according to the -log10(p.adjust). |
| Page: 1 2 3 4 5 6 7 8 9 |
| GO ID | Tissue | Disease Stage | Description | Gene Ratio | Bg Ratio | pvalue | p.adjust | Count |
| GO:0010498111 | Esophagus | ESCC | proteasomal protein catabolic process | 369/8552 | 490/18723 | 1.13e-41 | 1.80e-38 | 369 |
| GO:0043161111 | Esophagus | ESCC | proteasome-mediated ubiquitin-dependent protein catabolic process | 312/8552 | 412/18723 | 3.53e-36 | 4.48e-33 | 312 |
| GO:0042176111 | Esophagus | ESCC | regulation of protein catabolic process | 280/8552 | 391/18723 | 8.65e-26 | 2.39e-23 | 280 |
| GO:0009896111 | Esophagus | ESCC | positive regulation of catabolic process | 332/8552 | 492/18723 | 4.36e-23 | 9.22e-21 | 332 |
| GO:0031331111 | Esophagus | ESCC | positive regulation of cellular catabolic process | 292/8552 | 427/18723 | 8.67e-22 | 1.53e-19 | 292 |
| GO:1903362111 | Esophagus | ESCC | regulation of cellular protein catabolic process | 188/8552 | 255/18723 | 5.12e-20 | 6.62e-18 | 188 |
| GO:0045862111 | Esophagus | ESCC | positive regulation of proteolysis | 256/8552 | 372/18723 | 7.88e-20 | 9.43e-18 | 256 |
| GO:1903050111 | Esophagus | ESCC | regulation of proteolysis involved in cellular protein catabolic process | 163/8552 | 221/18723 | 1.44e-17 | 1.27e-15 | 163 |
| GO:0061136111 | Esophagus | ESCC | regulation of proteasomal protein catabolic process | 142/8552 | 187/18723 | 2.40e-17 | 2.00e-15 | 142 |
| GO:0045732111 | Esophagus | ESCC | positive regulation of protein catabolic process | 167/8552 | 231/18723 | 1.47e-16 | 1.14e-14 | 167 |
| GO:0032434111 | Esophagus | ESCC | regulation of proteasomal ubiquitin-dependent protein catabolic process | 107/8552 | 134/18723 | 4.06e-16 | 2.93e-14 | 107 |
| GO:2000058111 | Esophagus | ESCC | regulation of ubiquitin-dependent protein catabolic process | 125/8552 | 164/18723 | 1.17e-15 | 7.76e-14 | 125 |
| GO:1903364111 | Esophagus | ESCC | positive regulation of cellular protein catabolic process | 117/8552 | 155/18723 | 3.25e-14 | 1.66e-12 | 117 |
| GO:1901800110 | Esophagus | ESCC | positive regulation of proteasomal protein catabolic process | 91/8552 | 114/18723 | 6.74e-14 | 3.34e-12 | 91 |
| GO:1903052110 | Esophagus | ESCC | positive regulation of proteolysis involved in cellular protein catabolic process | 101/8552 | 133/18723 | 9.58e-13 | 4.19e-11 | 101 |
| GO:0032436111 | Esophagus | ESCC | positive regulation of proteasomal ubiquitin-dependent protein catabolic process | 72/8552 | 90/18723 | 2.30e-11 | 7.87e-10 | 72 |
| GO:2000060111 | Esophagus | ESCC | positive regulation of ubiquitin-dependent protein catabolic process | 81/8552 | 107/18723 | 2.23e-10 | 6.34e-09 | 81 |
| GO:003461220 | Esophagus | ESCC | response to tumor necrosis factor | 149/8552 | 253/18723 | 1.47e-05 | 1.33e-04 | 149 |
| GO:00343418 | Esophagus | ESCC | response to interferon-gamma | 86/8552 | 141/18723 | 1.74e-04 | 1.14e-03 | 86 |
| GO:001049812 | Liver | Cirrhotic | proteasomal protein catabolic process | 216/4634 | 490/18723 | 2.52e-21 | 9.29e-19 | 216 |
| Page: 1 2 3 4 5 6 7 8 |
| Pathway ID | Tissue | Disease Stage | Description | Gene Ratio | Bg Ratio | pvalue | p.adjust | qvalue | Count |
| Page: 1 |
Top |
Cell-cell communication analysis |
| Identification of potential cell-cell interactions between two cell types and their ligand-receptor pairs for different disease states |
| Ligand | Receptor | LRpair | Pathway | Tissue | Disease Stage |
| Page: 1 |
Top |
Single-cell gene regulatory network inference analysis |
| Find out the significant the regulons (TFs) and the target genes of each regulon across cell types for different disease states |
| TF | Cell Type | Tissue | Disease Stage | Target Gene | RSS | Regulon Activity |
| ∗The dot plots of a searched regulon are shown for all cell subpopulations in each disease state of each tissue based on the regulon specific score inferred using pySCENIC and by calculating the average expression. |
| Page: 1 |
Top |
Somatic mutation of malignant transformation related genes |
| Annotation of somatic variants for genes involved in malignant transformation |
| Hugo Symbol | Variant Class | Variant Classification | dbSNP RS | HGVSc | HGVSp | HGVSp Short | SWISSPROT | BIOTYPE | SIFT | PolyPhen | Tumor Sample Barcode | Tissue | Histology | Sex | Age | Stage | Therapy Types | Drugs | Outcome |
| NUB1 | SNV | Missense_Mutation | c.1849N>C | p.Asp617His | p.D617H | protein_coding | deleterious(0) | probably_damaging(0.93) | TCGA-D8-A27G-01 | Breast | breast invasive carcinoma | Female | >=65 | I/II | Unknown | Unknown | SD | ||
| NUB1 | SNV | Missense_Mutation | novel | c.1792N>A | p.Glu598Lys | p.E598K | protein_coding | deleterious(0) | probably_damaging(0.994) | TCGA-PL-A8LZ-01 | Breast | breast invasive carcinoma | Female | <65 | III/IV | Chemotherapy | paclitaxel | SD | |
| NUB1 | insertion | In_Frame_Ins | novel | c.1866_1867insACACGG | p.Ile622_Ala623insThrArg | p.I622_A623insTR | protein_coding | TCGA-A8-A07F-01 | Breast | breast invasive carcinoma | Female | >=65 | I/II | Hormone Therapy | tamoxiphen | SD | |||
| NUB1 | insertion | Frame_Shift_Ins | novel | c.1869dupA | p.Glu624ArgfsTer9 | p.E624Rfs*9 | protein_coding | TCGA-A8-A07F-01 | Breast | breast invasive carcinoma | Female | >=65 | I/II | Hormone Therapy | tamoxiphen | SD | |||
| NUB1 | SNV | Missense_Mutation | c.683T>G | p.Val228Gly | p.V228G | protein_coding | tolerated(0.31) | benign(0.138) | TCGA-FU-A3HZ-01 | Cervix | cervical & endocervical cancer | Female | <65 | I/II | Chemotherapy | cisplatin | CR | ||
| NUB1 | SNV | Missense_Mutation | novel | c.1870G>A | p.Glu624Lys | p.E624K | protein_coding | tolerated(0.44) | benign(0.045) | TCGA-MA-AA41-01 | Cervix | cervical & endocervical cancer | Female | <65 | I/II | Unknown | Unknown | SD | |
| NUB1 | SNV | Missense_Mutation | rs373576077 | c.1118G>A | p.Arg373Gln | p.R373Q | protein_coding | tolerated(0.33) | benign(0.014) | TCGA-AA-3984-01 | Colorectum | colon adenocarcinoma | Female | <65 | I/II | Unknown | Unknown | SD | |
| NUB1 | SNV | Missense_Mutation | novel | c.265T>G | p.Cys89Gly | p.C89G | protein_coding | deleterious(0.02) | benign(0.425) | TCGA-AA-A00O-01 | Colorectum | colon adenocarcinoma | Female | >=65 | III/IV | Unknown | Unknown | SD | |
| NUB1 | SNV | Missense_Mutation | rs373576077 | c.1118G>A | p.Arg373Gln | p.R373Q | protein_coding | tolerated(0.33) | benign(0.014) | TCGA-AA-A01R-01 | Colorectum | colon adenocarcinoma | Male | <65 | III/IV | Chemotherapy | 5-fluorouracil | PD | |
| NUB1 | SNV | Missense_Mutation | rs868105409 | c.1784C>T | p.Ala595Val | p.A595V | protein_coding | tolerated(1) | possibly_damaging(0.804) | TCGA-AA-A01R-01 | Colorectum | colon adenocarcinoma | Male | <65 | III/IV | Chemotherapy | 5-fluorouracil | PD |
| Page: 1 2 3 4 5 |
Top |
Related drugs of malignant transformation related genes |
| Identification of chemicals and drugs interact with genes involved in malignant transfromation |
| (DGIdb 4.0) |
| Entrez ID | Symbol | Category | Interaction Types | Drug Claim Name | Drug Name | PMIDs |
| Page: 1 |

Copyright 2023-Present -The University of Texas Health Science Center at Houston |