
|
|||||
|
 | |
| |
| |
| |
| |
| |
|
Gene: NOMO1 |
Gene summary for NOMO1 |
| Gene information | Species | Human | Gene symbol | NOMO1 | Gene ID | 23420 |
| Gene name | NODAL modulator 1 | |
| Gene Alias | Nomo | |
| Cytomap | 16p13.11 | |
| Gene Type | protein-coding | GO ID | GO:0007154 | UniProtAcc | Q15155 |
Top |
Malignant transformation analysis |
| Identification of the aberrant gene expression in precancerous and cancerous lesions by comparing the gene expression of stem-like cells in diseased tissues with normal stem cells |
| Entrez ID | Symbol | Replicates | Species | Organ | Tissue | Adj P-value | Log2FC | Malignancy |
| 23420 | NOMO1 | HTA11_99999974143_84620 | Human | Colorectum | MSS | 3.99e-09 | 4.86e-01 | 0.3005 |
| 23420 | NOMO1 | A015-C-203 | Human | Colorectum | FAP | 5.21e-04 | -1.77e-01 | -0.1294 |
| 23420 | NOMO1 | A015-C-204 | Human | Colorectum | FAP | 6.77e-03 | -1.68e-01 | -0.0228 |
| 23420 | NOMO1 | A002-C-201 | Human | Colorectum | FAP | 3.83e-03 | -1.38e-01 | 0.0324 |
| 23420 | NOMO1 | A002-C-205 | Human | Colorectum | FAP | 1.66e-04 | -1.60e-01 | -0.1236 |
| 23420 | NOMO1 | A015-C-005 | Human | Colorectum | FAP | 1.61e-03 | -1.71e-01 | -0.0336 |
| 23420 | NOMO1 | A015-C-006 | Human | Colorectum | FAP | 1.36e-02 | -1.63e-01 | -0.0994 |
| 23420 | NOMO1 | A015-C-106 | Human | Colorectum | FAP | 2.38e-02 | -1.53e-01 | -0.0511 |
| 23420 | NOMO1 | A002-C-114 | Human | Colorectum | FAP | 7.30e-04 | -1.69e-01 | -0.1561 |
| 23420 | NOMO1 | A015-C-104 | Human | Colorectum | FAP | 2.67e-03 | -1.64e-01 | -0.1899 |
| 23420 | NOMO1 | A002-C-016 | Human | Colorectum | FAP | 2.38e-03 | -1.40e-01 | 0.0521 |
| 23420 | NOMO1 | A001-C-203 | Human | Colorectum | FAP | 2.00e-02 | -1.38e-01 | -0.0481 |
| 23420 | NOMO1 | A002-C-116 | Human | Colorectum | FAP | 3.49e-03 | -1.26e-01 | -0.0452 |
| 23420 | NOMO1 | A014-C-008 | Human | Colorectum | FAP | 6.48e-04 | -1.86e-01 | -0.191 |
| 23420 | NOMO1 | A018-E-020 | Human | Colorectum | FAP | 1.13e-03 | -1.55e-01 | -0.2034 |
| 23420 | NOMO1 | F034 | Human | Colorectum | FAP | 4.30e-03 | -1.52e-01 | -0.0665 |
| 23420 | NOMO1 | F072B | Human | Colorectum | FAP | 2.36e-02 | -1.61e-01 | 0.257 |
| 23420 | NOMO1 | LZE7T | Human | Esophagus | ESCC | 5.31e-07 | 3.51e-01 | 0.0667 |
| 23420 | NOMO1 | LZE8T | Human | Esophagus | ESCC | 1.74e-04 | 1.07e-01 | 0.067 |
| 23420 | NOMO1 | LZE20T | Human | Esophagus | ESCC | 1.82e-04 | 1.70e-01 | 0.0662 |
| Page: 1 2 3 4 5 6 7 |
| Tissue | Expression Dynamics | Abbreviation |
| Colorectum (GSE201348) | 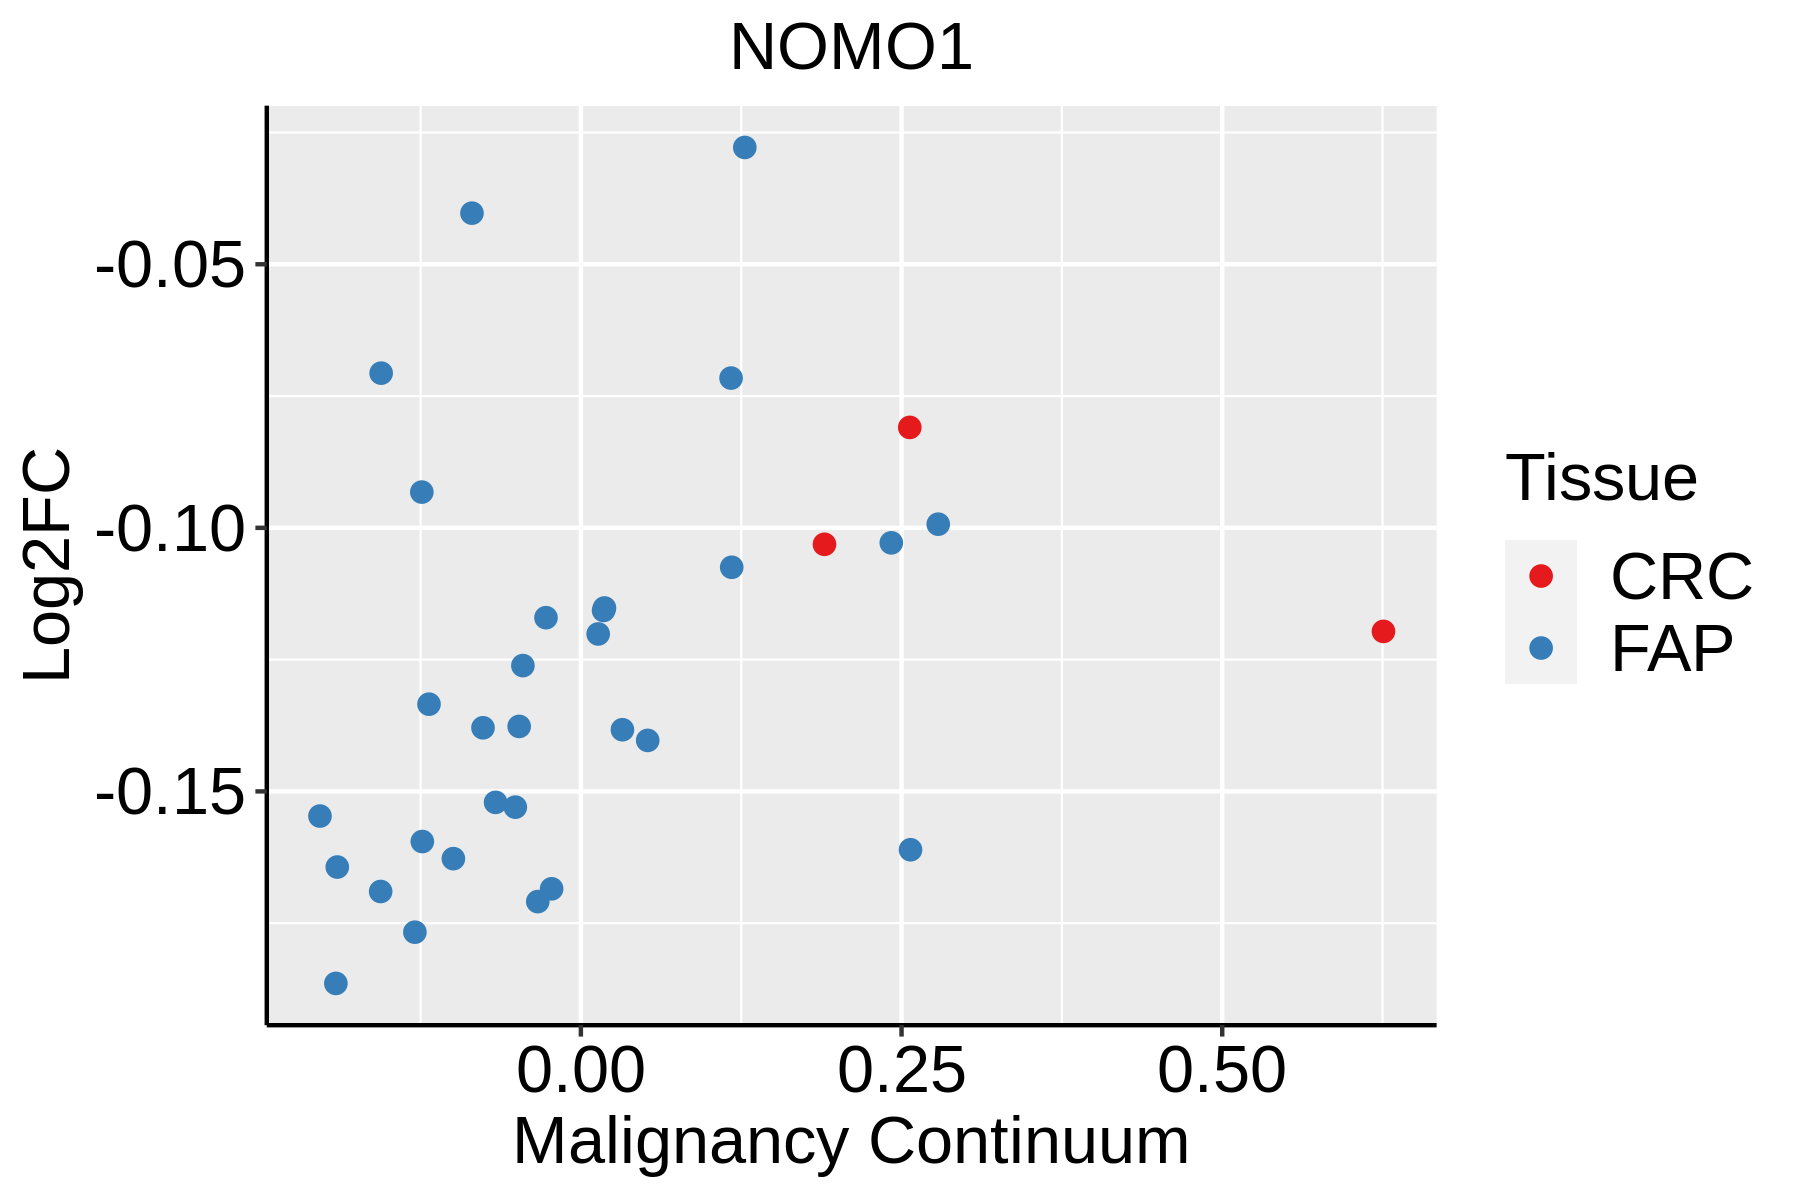 | FAP: Familial adenomatous polyposis |
| CRC: Colorectal cancer | ||
| Colorectum (HTA11) |  | AD: Adenomas |
| SER: Sessile serrated lesions | ||
| MSI-H: Microsatellite-high colorectal cancer | ||
| MSS: Microsatellite stable colorectal cancer | ||
| Esophagus | 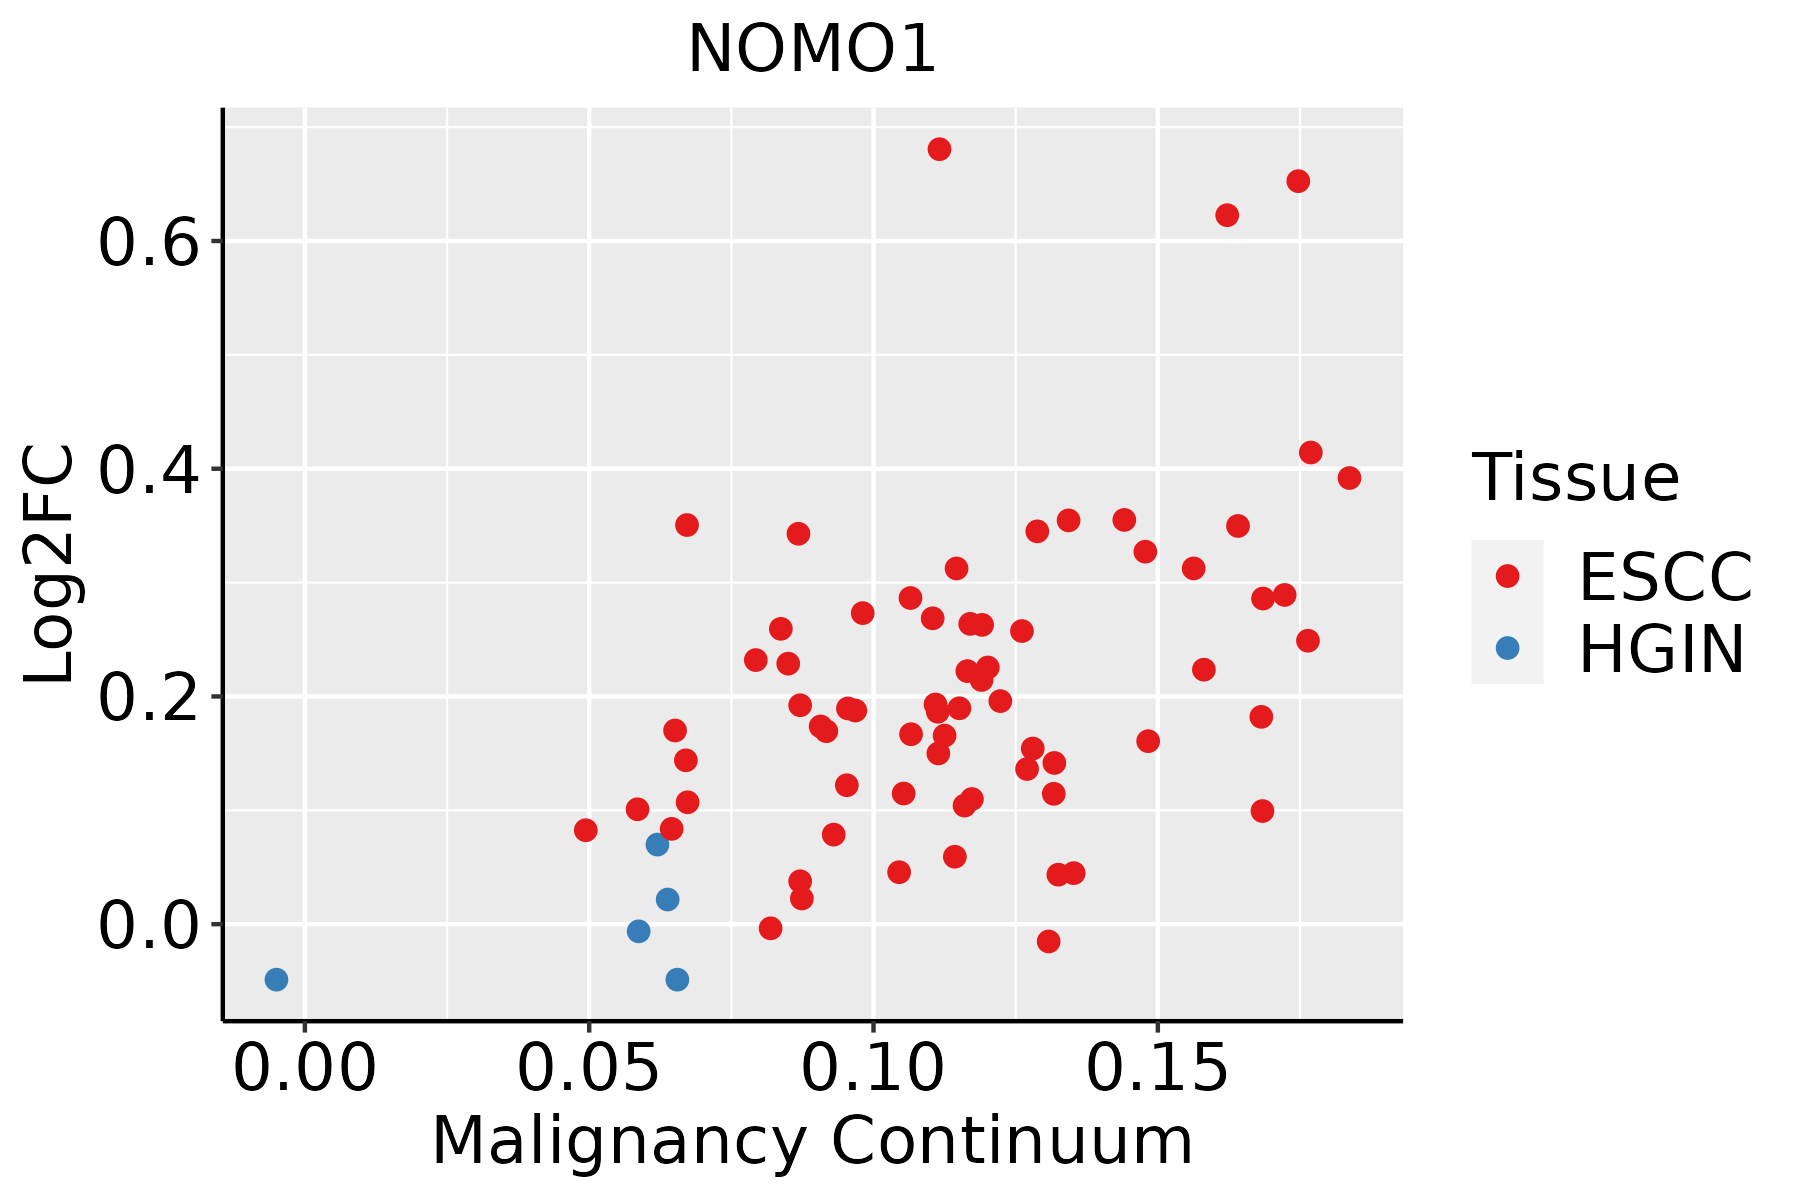 | ESCC: Esophageal squamous cell carcinoma |
| HGIN: High-grade intraepithelial neoplasias | ||
| LGIN: Low-grade intraepithelial neoplasias | ||
| Liver | 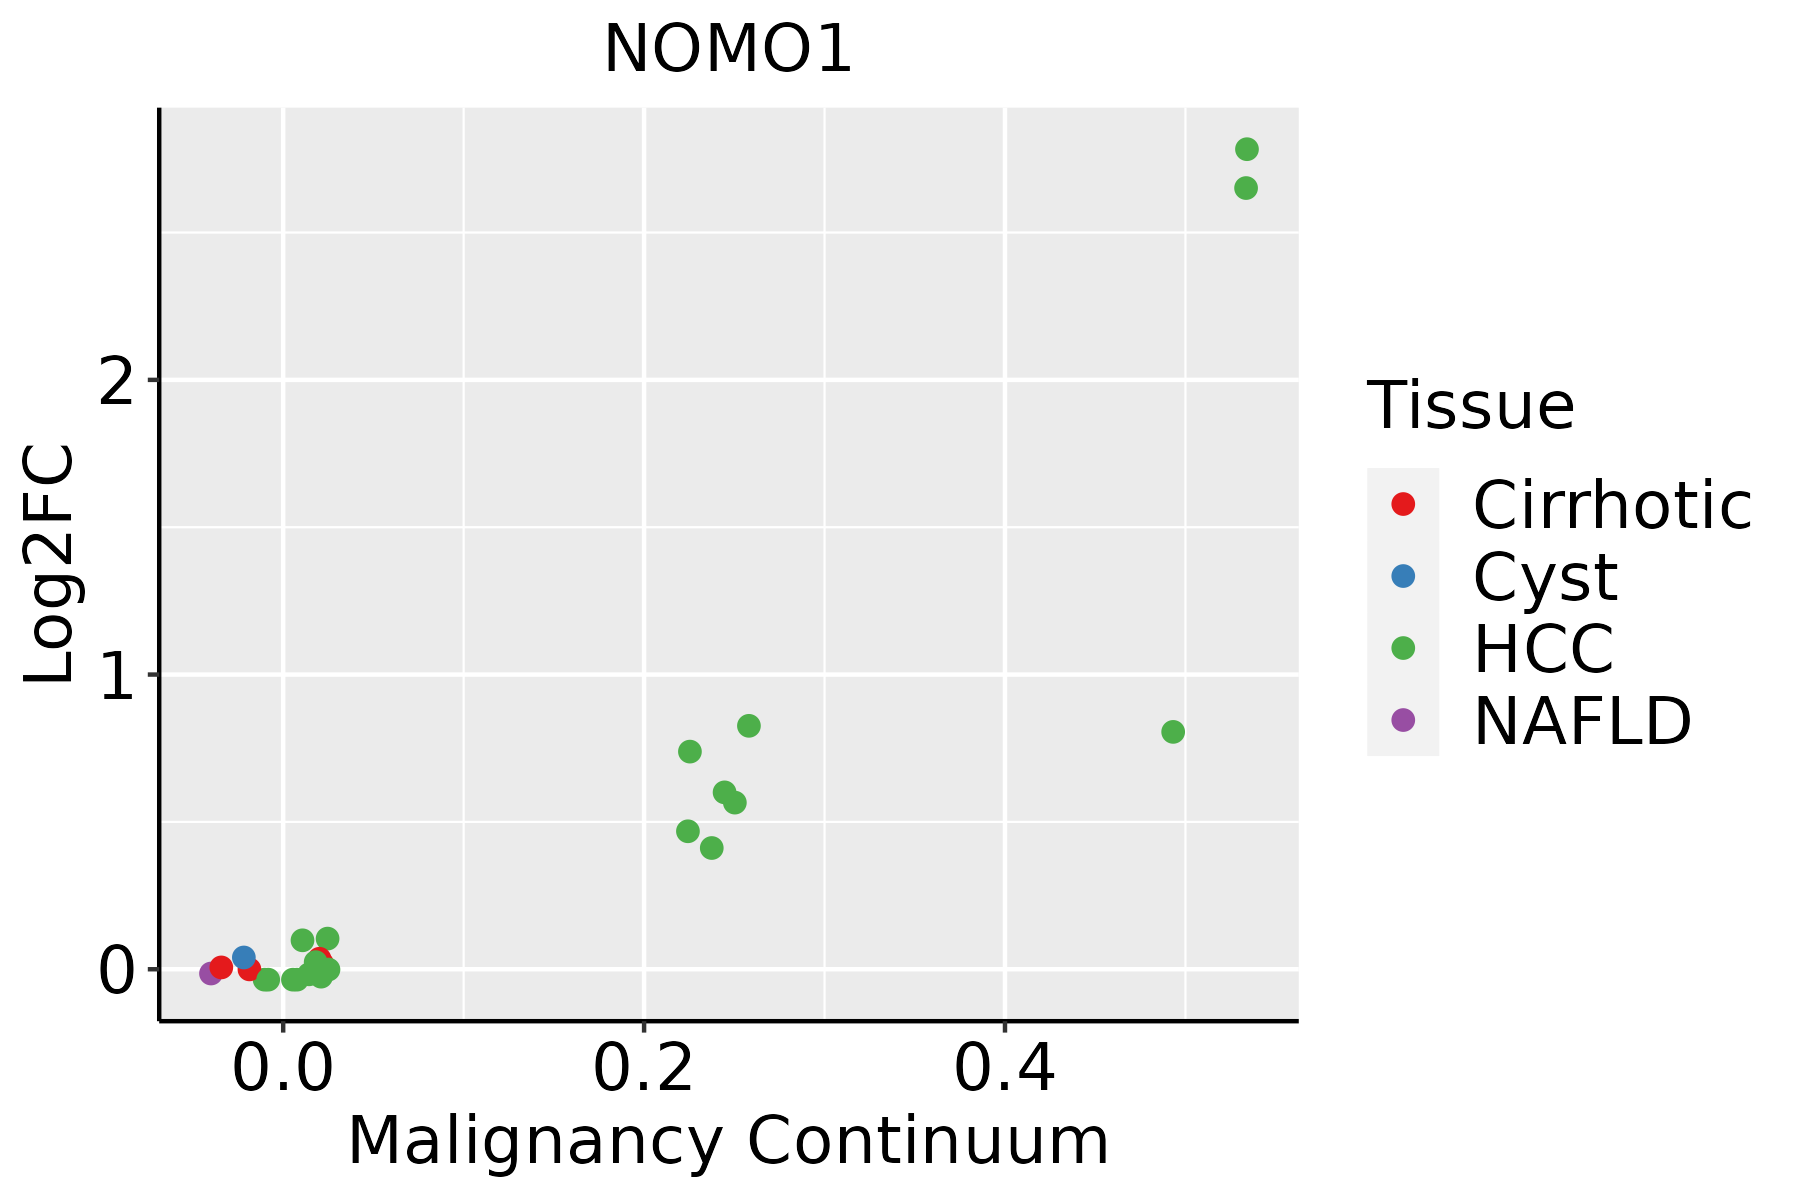 | HCC: Hepatocellular carcinoma |
| NAFLD: Non-alcoholic fatty liver disease | ||
| Oral Cavity | 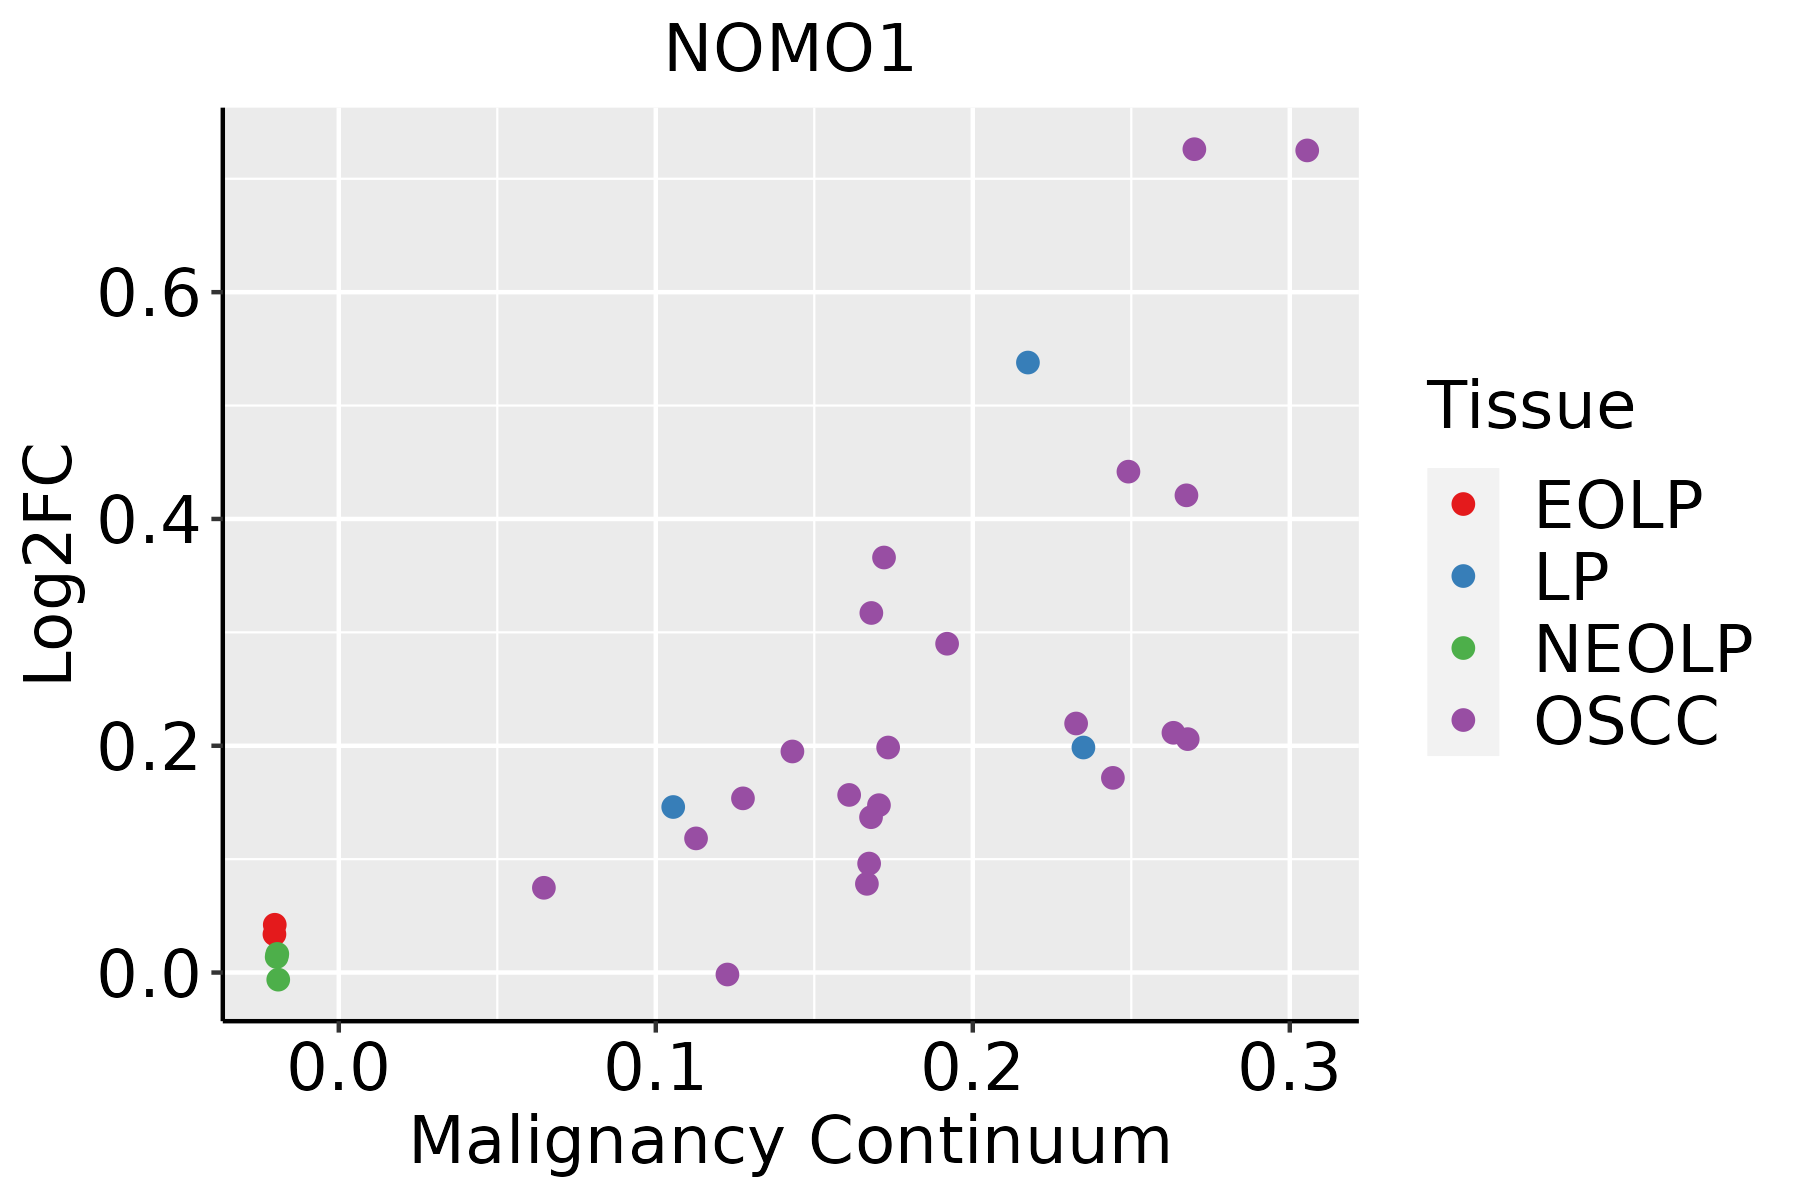 | EOLP: Erosive Oral lichen planus |
| LP: leukoplakia | ||
| NEOLP: Non-erosive oral lichen planus | ||
| OSCC: Oral squamous cell carcinoma |
| ∗log2FC in expression of this searched gene in stem-like cells from each diseased tissue sample relative to stem-like cells in normal samples in each tissue plotted against the malignancy continuum. Samples are colored based on if they are from different disease stage. |
Top |
Malignant transformation related pathway analysis |
| Find out the enriched GO biological processes and KEGG pathways involved in transition from healthy to precancer to cancer |
| Tissue | Disease Stage | Enriched GO biological Processes |
| Colorectum | AD |  |
| Colorectum | SER |  |
| Colorectum | MSS |  |
| Colorectum | MSI-H |  |
| Colorectum | FAP |  |
| ∗Top 15 enriched GO BP terms are showed in the bar plot of each disease state in each tissue. Each row represents a significant GO biological process which is colored according to the -log10(p.adjust). |
| Page: 1 2 3 4 5 6 7 8 9 |
| GO ID | Tissue | Disease Stage | Description | Gene Ratio | Bg Ratio | pvalue | p.adjust | Count |
| GO:0007178 | Colorectum | AD | transmembrane receptor protein serine/threonine kinase signaling pathway | 99/3918 | 355/18723 | 9.92e-04 | 9.28e-03 | 99 |
| GO:00071781 | Colorectum | MSS | transmembrane receptor protein serine/threonine kinase signaling pathway | 86/3467 | 355/18723 | 4.04e-03 | 2.95e-02 | 86 |
| GO:00071782 | Colorectum | FAP | transmembrane receptor protein serine/threonine kinase signaling pathway | 81/2622 | 355/18723 | 4.28e-06 | 1.46e-04 | 81 |
| GO:0090092 | Colorectum | FAP | regulation of transmembrane receptor protein serine/threonine kinase signaling pathway | 52/2622 | 256/18723 | 3.33e-03 | 2.44e-02 | 52 |
| GO:000717810 | Esophagus | ESCC | transmembrane receptor protein serine/threonine kinase signaling pathway | 195/8552 | 355/18723 | 2.58e-04 | 1.58e-03 | 195 |
| GO:00071789 | Oral cavity | OSCC | transmembrane receptor protein serine/threonine kinase signaling pathway | 165/7305 | 355/18723 | 2.31e-03 | 1.02e-02 | 165 |
| Page: 1 |
| Pathway ID | Tissue | Disease Stage | Description | Gene Ratio | Bg Ratio | pvalue | p.adjust | qvalue | Count |
| Page: 1 |
Top |
Cell-cell communication analysis |
| Identification of potential cell-cell interactions between two cell types and their ligand-receptor pairs for different disease states |
| Ligand | Receptor | LRpair | Pathway | Tissue | Disease Stage |
| Page: 1 |
Top |
Single-cell gene regulatory network inference analysis |
| Find out the significant the regulons (TFs) and the target genes of each regulon across cell types for different disease states |
| TF | Cell Type | Tissue | Disease Stage | Target Gene | RSS | Regulon Activity |
| ∗The dot plots of a searched regulon are shown for all cell subpopulations in each disease state of each tissue based on the regulon specific score inferred using pySCENIC and by calculating the average expression. |
| Page: 1 |
Top |
Somatic mutation of malignant transformation related genes |
| Annotation of somatic variants for genes involved in malignant transformation |
| Hugo Symbol | Variant Class | Variant Classification | dbSNP RS | HGVSc | HGVSp | HGVSp Short | SWISSPROT | BIOTYPE | SIFT | PolyPhen | Tumor Sample Barcode | Tissue | Histology | Sex | Age | Stage | Therapy Types | Drugs | Outcome |
| NOMO1 | SNV | Missense_Mutation | c.1421G>C | p.Arg474Thr | p.R474T | Q15155 | protein_coding | deleterious(0.04) | benign(0.104) | TCGA-A2-A0CL-01 | Breast | breast invasive carcinoma | Female | <65 | III/IV | Chemotherapy | cytoxan | SD | |
| NOMO1 | SNV | Missense_Mutation | rs771995798 | c.3130N>A | p.Asp1044Asn | p.D1044N | Q15155 | protein_coding | tolerated(0.14) | benign(0.223) | TCGA-A2-A0CX-01 | Breast | breast invasive carcinoma | Female | <65 | I/II | Chemotherapy | adriamycin | SD |
| NOMO1 | SNV | Missense_Mutation | rs779029500 | c.2660N>C | p.Asp887Ala | p.D887A | Q15155 | protein_coding | deleterious(0.04) | benign(0.057) | TCGA-A2-A1G4-01 | Breast | breast invasive carcinoma | Female | >=65 | III/IV | Chemotherapy | adriamycin | SD |
| NOMO1 | SNV | Missense_Mutation | c.1084N>C | p.Asp362His | p.D362H | Q15155 | protein_coding | deleterious(0) | probably_damaging(0.96) | TCGA-AC-A23H-01 | Breast | breast invasive carcinoma | Female | >=65 | I/II | Unknown | Unknown | PD | |
| NOMO1 | SNV | Missense_Mutation | c.3202N>C | p.Glu1068Gln | p.E1068Q | Q15155 | protein_coding | tolerated(0.07) | possibly_damaging(0.702) | TCGA-AC-A23H-01 | Breast | breast invasive carcinoma | Female | >=65 | I/II | Unknown | Unknown | PD | |
| NOMO1 | SNV | Missense_Mutation | rs763791304 | c.1456N>G | p.Leu486Val | p.L486V | Q15155 | protein_coding | tolerated(1) | benign(0) | TCGA-AC-A3BB-01 | Breast | breast invasive carcinoma | Female | <65 | III/IV | Chemotherapy | cytoxan | CR |
| NOMO1 | SNV | Missense_Mutation | novel | c.387C>A | p.Phe129Leu | p.F129L | Q15155 | protein_coding | deleterious(0.01) | benign(0.292) | TCGA-AN-A046-01 | Breast | breast invasive carcinoma | Female | >=65 | I/II | Unknown | Unknown | SD |
| NOMO1 | SNV | Missense_Mutation | novel | c.415N>A | p.Gly139Arg | p.G139R | Q15155 | protein_coding | deleterious(0.01) | benign(0.103) | TCGA-AN-A04C-01 | Breast | breast invasive carcinoma | Female | <65 | I/II | Unknown | Unknown | SD |
| NOMO1 | SNV | Missense_Mutation | c.2998N>C | p.Glu1000Gln | p.E1000Q | Q15155 | protein_coding | deleterious(0.04) | possibly_damaging(0.518) | TCGA-AO-A0JC-01 | Breast | breast invasive carcinoma | Female | <65 | I/II | Chemotherapy | fluorouracil | SD | |
| NOMO1 | SNV | Missense_Mutation | c.1084N>A | p.Asp362Asn | p.D362N | Q15155 | protein_coding | tolerated(0.17) | probably_damaging(0.922) | TCGA-AR-A1AJ-01 | Breast | breast invasive carcinoma | Female | >=65 | I/II | Unknown | Unknown | SD |
| Page: 1 2 3 4 5 6 7 8 9 10 |
Top |
Related drugs of malignant transformation related genes |
| Identification of chemicals and drugs interact with genes involved in malignant transfromation |
| (DGIdb 4.0) |
| Entrez ID | Symbol | Category | Interaction Types | Drug Claim Name | Drug Name | PMIDs |
| Page: 1 |

Copyright 2023-Present -The University of Texas Health Science Center at Houston |