| Entrez ID | Symbol | Replicates | Species | Organ | Tissue | Adj P-value | Log2FC | Malignancy |
| 11188 | NISCH | Dong_P1 | Human | Prostate | Tumor | 8.77e-08 | 5.14e-02 | 0.035 |
| 11188 | NISCH | Dong_P3 | Human | Prostate | Tumor | 9.49e-19 | 2.81e-01 | 0.0278 |
| 11188 | NISCH | Dong_P4 | Human | Prostate | Tumor | 1.98e-02 | 1.50e-01 | 0.0292 |
| 11188 | NISCH | Dong_P5 | Human | Prostate | Tumor | 1.28e-12 | 7.41e-03 | 0.053 |
| 11188 | NISCH | GSM5353215_PA_AUG_PB_1B_S2 | Human | Prostate | Tumor | 2.36e-03 | 6.31e-01 | 0.1557 |
| 11188 | NISCH | GSM5353221_PA_PB2A_Pool_1_3_S25_L001 | Human | Prostate | Tumor | 1.63e-05 | 4.35e-01 | 0.1633 |
| 11188 | NISCH | GSM5353222_PA_PB2B_Pool_1_3_S52_L002 | Human | Prostate | Tumor | 9.23e-05 | 3.82e-01 | 0.1608 |
| 11188 | NISCH | GSM5353223_PA_PB2B_Pool_2_S26_L001 | Human | Prostate | Tumor | 4.86e-08 | 5.44e-01 | 0.1604 |
| 11188 | NISCH | GSM5353236_PA_PR5251_T1_S7_L001 | Human | Prostate | Tumor | 3.81e-05 | 6.09e-01 | 0.1608 |
| 11188 | NISCH | GSM5353237_PA_PR5251_T2_S8_L001 | Human | Prostate | Tumor | 3.67e-02 | 4.88e-01 | 0.1622 |
| 11188 | NISCH | GSM5353240_PA_PR5254_T1_S15_L001 | Human | Prostate | Tumor | 7.35e-05 | 3.82e-01 | 0.1575 |
| 11188 | NISCH | GSM5353243_PA_PR5261_T1_S23_L002 | Human | Prostate | Tumor | 3.09e-02 | 2.81e-01 | 0.1545 |
| 11188 | NISCH | GSM5353244_PA_PR5261_T2_S24_L002 | Human | Prostate | Tumor | 9.31e-03 | 2.65e-01 | 0.1569 |
| 11188 | NISCH | male-WTA | Human | Thyroid | PTC | 8.24e-24 | 1.90e-01 | 0.1037 |
| 11188 | NISCH | PTC01 | Human | Thyroid | PTC | 1.13e-07 | 1.43e-01 | 0.1899 |
| 11188 | NISCH | PTC03 | Human | Thyroid | PTC | 6.00e-05 | 2.40e-01 | 0.1784 |
| 11188 | NISCH | PTC04 | Human | Thyroid | PTC | 1.58e-11 | 2.88e-01 | 0.1927 |
| 11188 | NISCH | PTC05 | Human | Thyroid | PTC | 2.16e-10 | 4.67e-01 | 0.2065 |
| 11188 | NISCH | PTC06 | Human | Thyroid | PTC | 3.10e-25 | 4.97e-01 | 0.2057 |
| 11188 | NISCH | PTC07 | Human | Thyroid | PTC | 9.66e-23 | 3.24e-01 | 0.2044 |
| Tissue | Expression Dynamics | Abbreviation |
| Liver |  | HCC: Hepatocellular carcinoma |
| NAFLD: Non-alcoholic fatty liver disease |
| Oral Cavity | 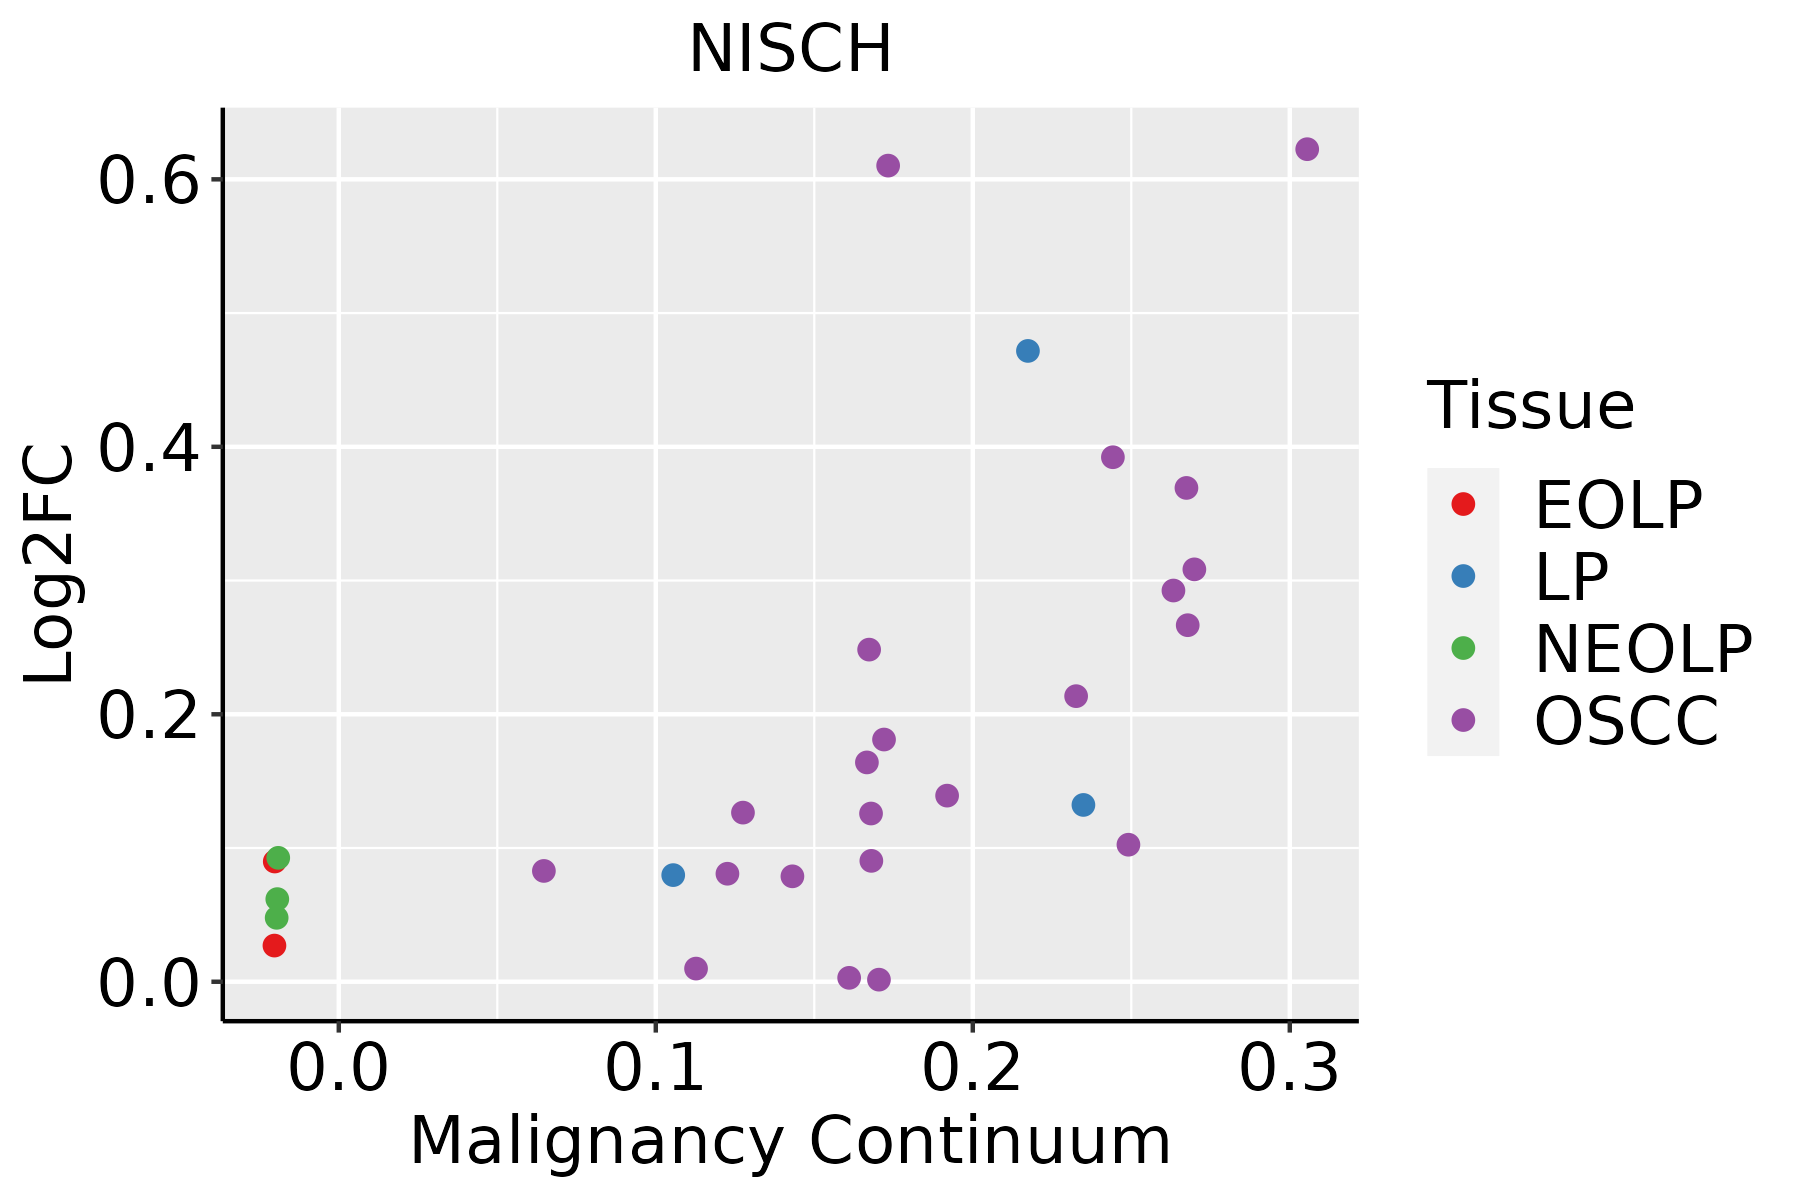 | EOLP: Erosive Oral lichen planus |
| LP: leukoplakia |
| NEOLP: Non-erosive oral lichen planus |
| OSCC: Oral squamous cell carcinoma |
| Prostate | 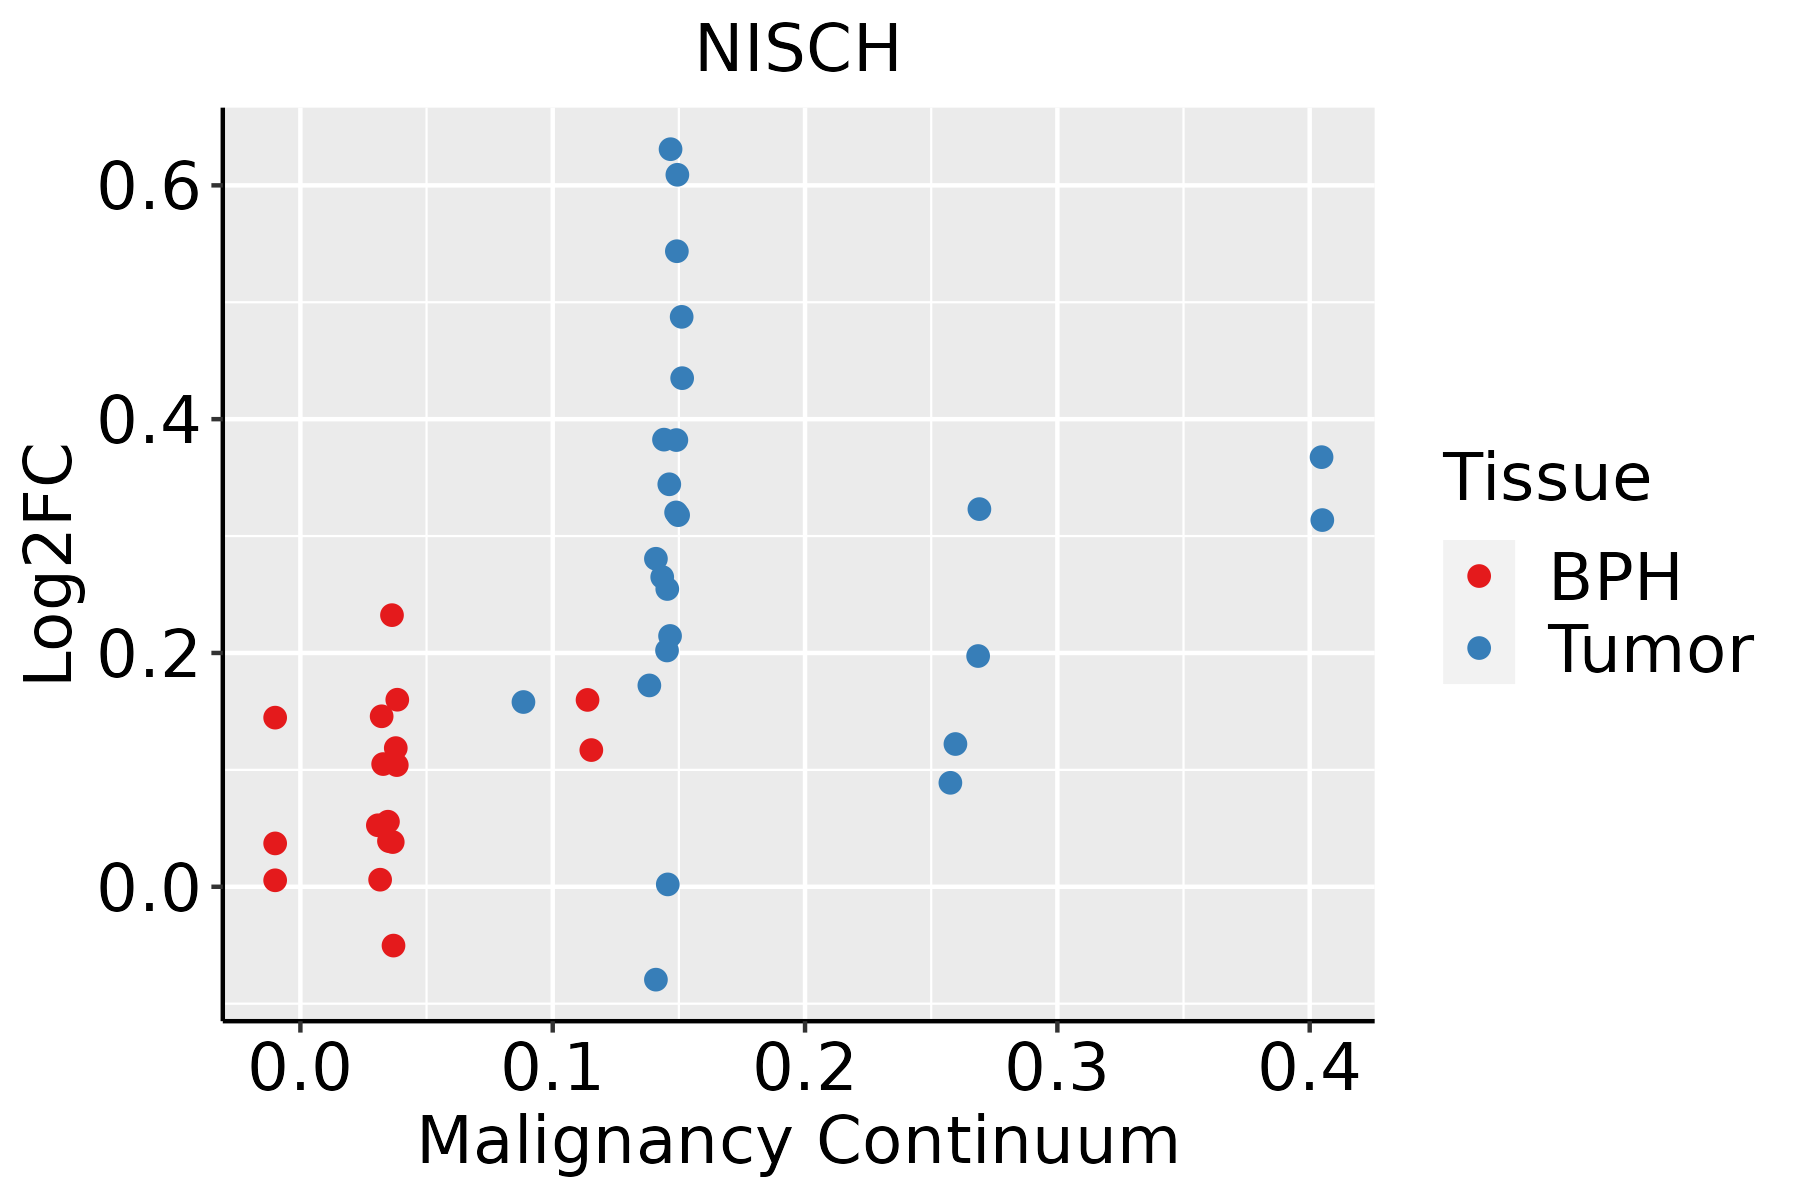 | BPH: Benign Prostatic Hyperplasia |
| Thyroid |  | ATC: Anaplastic thyroid cancer |
| HT: Hashimoto's thyroiditis |
| PTC: Papillary thyroid cancer |
| GO ID | Tissue | Disease Stage | Description | Gene Ratio | Bg Ratio | pvalue | p.adjust | Count |
| GO:000599621 | Liver | HCC | monosaccharide metabolic process | 167/7958 | 257/18723 | 2.31e-13 | 1.25e-11 | 167 |
| GO:001931821 | Liver | HCC | hexose metabolic process | 155/7958 | 237/18723 | 7.63e-13 | 3.90e-11 | 155 |
| GO:000600621 | Liver | HCC | glucose metabolic process | 128/7958 | 196/18723 | 8.60e-11 | 3.06e-09 | 128 |
| GO:000726521 | Liver | HCC | Ras protein signal transduction | 187/7958 | 337/18723 | 8.89e-07 | 1.35e-05 | 187 |
| GO:001660121 | Liver | HCC | Rac protein signal transduction | 28/7958 | 42/18723 | 1.35e-03 | 7.26e-03 | 28 |
| GO:00072659 | Oral cavity | OSCC | Ras protein signal transduction | 185/7305 | 337/18723 | 1.95e-09 | 4.60e-08 | 185 |
| GO:00059968 | Oral cavity | OSCC | monosaccharide metabolic process | 129/7305 | 257/18723 | 1.63e-04 | 1.13e-03 | 129 |
| GO:00166018 | Oral cavity | OSCC | Rac protein signal transduction | 28/7305 | 42/18723 | 2.61e-04 | 1.67e-03 | 28 |
| GO:00193188 | Oral cavity | OSCC | hexose metabolic process | 118/7305 | 237/18723 | 4.53e-04 | 2.73e-03 | 118 |
| GO:00060068 | Oral cavity | OSCC | glucose metabolic process | 98/7305 | 196/18723 | 1.10e-03 | 5.63e-03 | 98 |
| GO:000726514 | Prostate | Tumor | Ras protein signal transduction | 101/3246 | 337/18723 | 6.29e-09 | 2.44e-07 | 101 |
| GO:005127114 | Prostate | Tumor | negative regulation of cellular component movement | 92/3246 | 367/18723 | 1.03e-04 | 9.99e-04 | 92 |
| GO:000600613 | Prostate | Tumor | glucose metabolic process | 55/3246 | 196/18723 | 1.22e-04 | 1.14e-03 | 55 |
| GO:200014614 | Prostate | Tumor | negative regulation of cell motility | 89/3246 | 359/18723 | 1.99e-04 | 1.74e-03 | 89 |
| GO:001660112 | Prostate | Tumor | Rac protein signal transduction | 17/3246 | 42/18723 | 3.45e-04 | 2.73e-03 | 17 |
| GO:004001313 | Prostate | Tumor | negative regulation of locomotion | 94/3246 | 391/18723 | 4.20e-04 | 3.21e-03 | 94 |
| GO:003033613 | Prostate | Tumor | negative regulation of cell migration | 84/3246 | 344/18723 | 4.95e-04 | 3.66e-03 | 84 |
| GO:00193187 | Prostate | Tumor | hexose metabolic process | 59/3246 | 237/18723 | 1.96e-03 | 1.14e-02 | 59 |
| GO:00059967 | Prostate | Tumor | monosaccharide metabolic process | 62/3246 | 257/18723 | 3.38e-03 | 1.75e-02 | 62 |
| GO:000726519 | Thyroid | PTC | Ras protein signal transduction | 162/5968 | 337/18723 | 3.16e-10 | 1.02e-08 | 162 |
| Hugo Symbol | Variant Class | Variant Classification | dbSNP RS | HGVSc | HGVSp | HGVSp Short | SWISSPROT | BIOTYPE | SIFT | PolyPhen | Tumor Sample Barcode | Tissue | Histology | Sex | Age | Stage | Therapy Types | Drugs | Outcome |
| NISCH | SNV | Missense_Mutation | | c.544N>A | p.Asp182Asn | p.D182N | Q9Y2I1 | protein_coding | deleterious(0) | probably_damaging(0.975) | TCGA-AC-A23H-01 | Breast | breast invasive carcinoma | Female | >=65 | I/II | Unknown | Unknown | PD |
| NISCH | SNV | Missense_Mutation | rs773401264 | c.2936N>A | p.Arg979His | p.R979H | Q9Y2I1 | protein_coding | tolerated(0.08) | probably_damaging(0.932) | TCGA-AO-A128-01 | Breast | breast invasive carcinoma | Female | <65 | I/II | Chemotherapy | doxorubicin | SD |
| NISCH | SNV | Missense_Mutation | | c.3322N>C | p.Ser1108Arg | p.S1108R | Q9Y2I1 | protein_coding | deleterious(0) | possibly_damaging(0.638) | TCGA-AO-A128-01 | Breast | breast invasive carcinoma | Female | <65 | I/II | Chemotherapy | doxorubicin | SD |
| NISCH | SNV | Missense_Mutation | novel | c.2480G>T | p.Ser827Ile | p.S827I | Q9Y2I1 | protein_coding | tolerated(0.06) | possibly_damaging(0.731) | TCGA-BH-A1FC-01 | Breast | breast invasive carcinoma | Female | >=65 | I/II | Unknown | Unknown | SD |
| NISCH | insertion | In_Frame_Ins | novel | c.476_477insGGG | p.Glu159_Gln160insGly | p.E159_Q160insG | Q9Y2I1 | protein_coding | | | TCGA-A2-A0EM-01 | Breast | breast invasive carcinoma | Female | >=65 | I/II | Hormone Therapy | tamoxiphen | SD |
| NISCH | insertion | Frame_Shift_Ins | novel | c.1762_1763insGATATAAATCCTTGTCAAA | p.Leu588ArgfsTer53 | p.L588Rfs*53 | Q9Y2I1 | protein_coding | | | TCGA-A8-A07U-01 | Breast | breast invasive carcinoma | Female | >=65 | III/IV | Chemotherapy | 5-fluorouracil | SD |
| NISCH | deletion | Frame_Shift_Del | novel | c.3770delN | p.Cys1257SerfsTer2 | p.C1257Sfs*2 | Q9Y2I1 | protein_coding | | | TCGA-EW-A2FV-01 | Breast | breast invasive carcinoma | Female | <65 | III/IV | Chemotherapy | docetaxel | SD |
| NISCH | SNV | Missense_Mutation | novel | c.3997G>A | p.Ala1333Thr | p.A1333T | Q9Y2I1 | protein_coding | deleterious(0) | possibly_damaging(0.79) | TCGA-2W-A8YY-01 | Cervix | cervical & endocervical cancer | Female | <65 | I/II | Chemotherapy | cisplatin | CR |
| NISCH | SNV | Missense_Mutation | novel | c.1896N>T | p.Gln632His | p.Q632H | Q9Y2I1 | protein_coding | tolerated(0.13) | benign(0) | TCGA-C5-A1M6-01 | Cervix | cervical & endocervical cancer | Female | <65 | I/II | Chemotherapy | cisplatin | PD |
| NISCH | SNV | Missense_Mutation | | c.3460N>C | p.Glu1154Gln | p.E1154Q | Q9Y2I1 | protein_coding | deleterious(0.04) | probably_damaging(0.991) | TCGA-EK-A2R8-01 | Cervix | cervical & endocervical cancer | Female | <65 | I/II | Unknown | Unknown | SD |


